Keywords: Tissue Engineering, Biomaterials, PLGA Mechanical Characterization
EF008
The Challenge
To Characterize the Variation in Material Properties of Non-Woven PLGA Fibers
Background
Poly (lactic-co-glycolic acid), or PLGA, is a biocompatible, biodegradable, and FDA-approved polymer. For these reasons, PLGA is commonly used as a scaffold in tissue engineering and as a vehicle for drug delivery in the body. It is important to fully characterize the mechanical properties of PLGA and and to ensure proper response under physiological loading and environments.
Meeting the Challenge
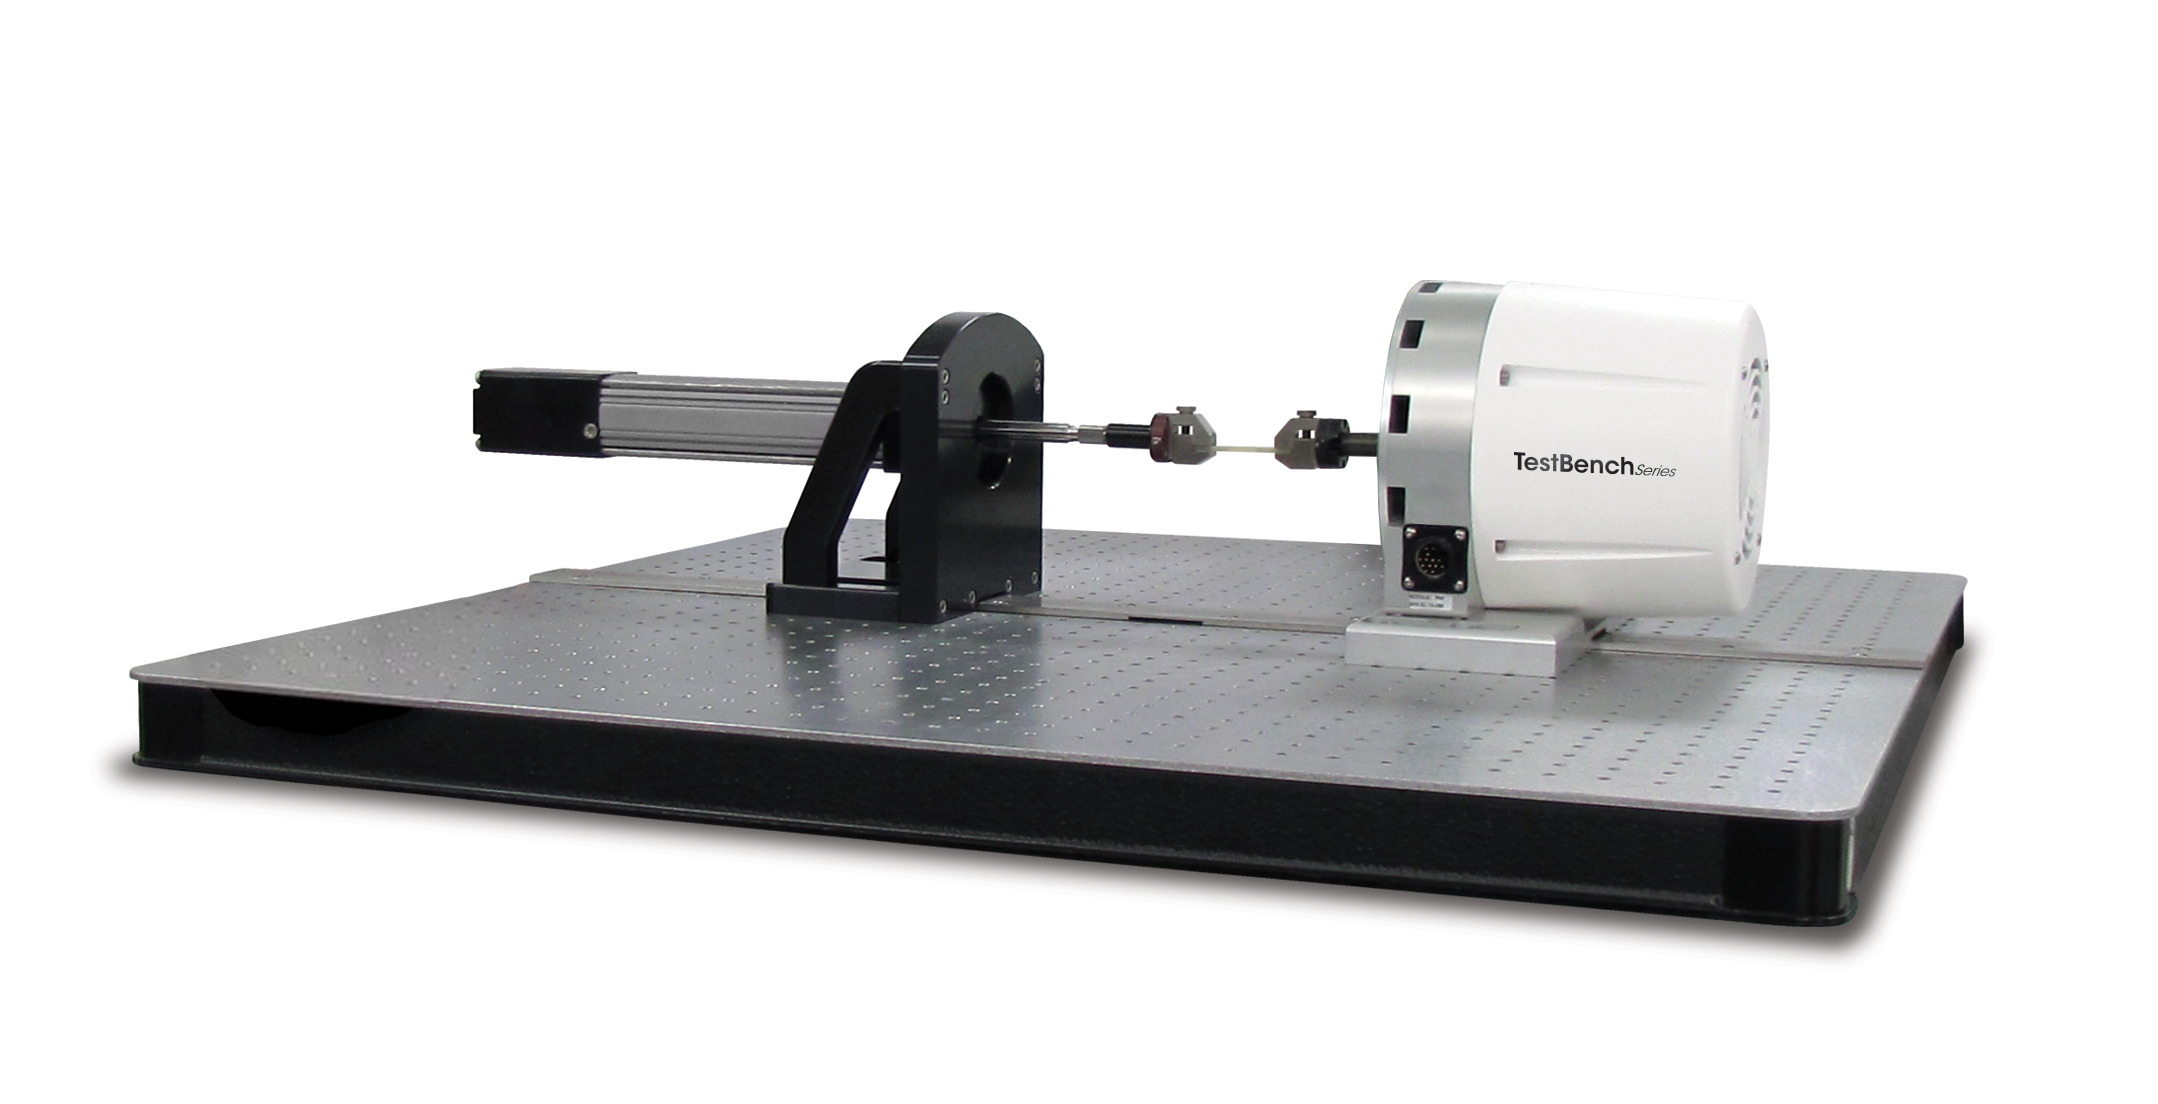
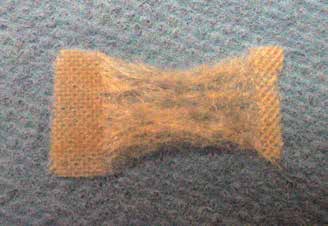
An ElectroForce® 200N TestBench instrument (Figure. 1) with an extended stroke (-ES) motor was used to investigate the material properties of a sheet of non-woven PLGA (Figure. 2). This extended stroke configuration was chosen to meet the desired displacement of the test while maintaining high waveform fidelity and excellent ability to precisely and accurately measure low forces applicable to many biological tissues.
One motor was a 200 N electrodynamic linear motor with a 13 mm of stroke and the second motor was the ElectroForce extended stroke actuator with 150 mm of stroke. These two motor technologies complement each other to deliver the respective attributes of high cycle durability and frequency loading, and slower long-stroke motions. The system was equipped with an optional 22 N force sensor and a temperature-controlled fluid bath.
Materials and Methods
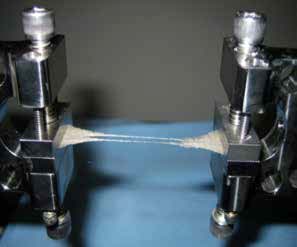
Five samples were cut from different locations within a sheet of non-woven PLGA biofelt (90% PGA, 10% PLA) provided by Biomedical Structures (Warwick, RI). Samples were cut into 12 mm wide strips, hydrated in 37 °C tap water for 75 minutes and measured. The strips (Figure 2) were clamped with tensile grips between opposing motors. All samples were tested while submerged in a 37 °C Saline environment.
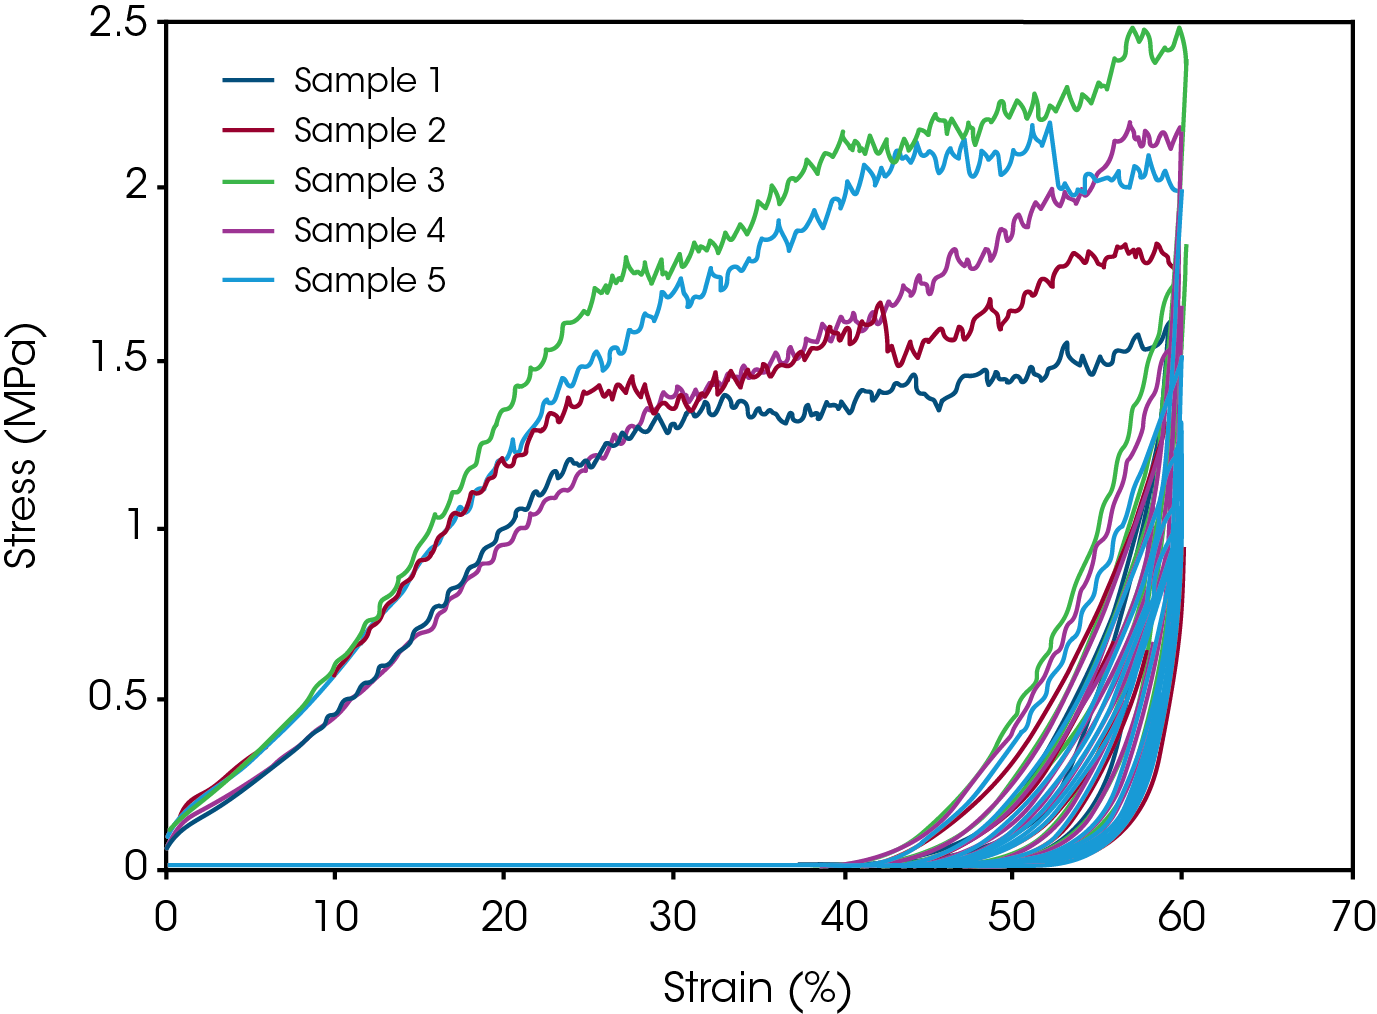
Samples were mounted at an approximate gauge length of 10 mm. A 0.5 N force was applied to enable measurement of the actual gage lengths. To aid in fiber alignment and to determine the linear region of the strips, the samples were further conditioned with a cyclic triangular waveform. The waveform had an amplitude of 60% strain and ran for 50 cycles at a frequency of 0.05 Hz. Figure 3 illustrates the stress versus strain response for the 5 samples and the difference between the first cycles and the subsequent cycles shown stacked on the the right.
A small preload force of 0.5 N was applied to measure the change in gage length before and after the cyclic loading. The gage lengths were remeasured and the average secondary preloaded gauge length, GL”, was 16.47 mm (± 0.57 mm), compared to the average initial gauge length, GL’, of 10.88 mm (± 0.24 mm). This 50% increase in the preloaded gauge length of the samples was due to the preconditioning protocol and indicates that load-induced alterations in the PLGA sheet fibers occurred.
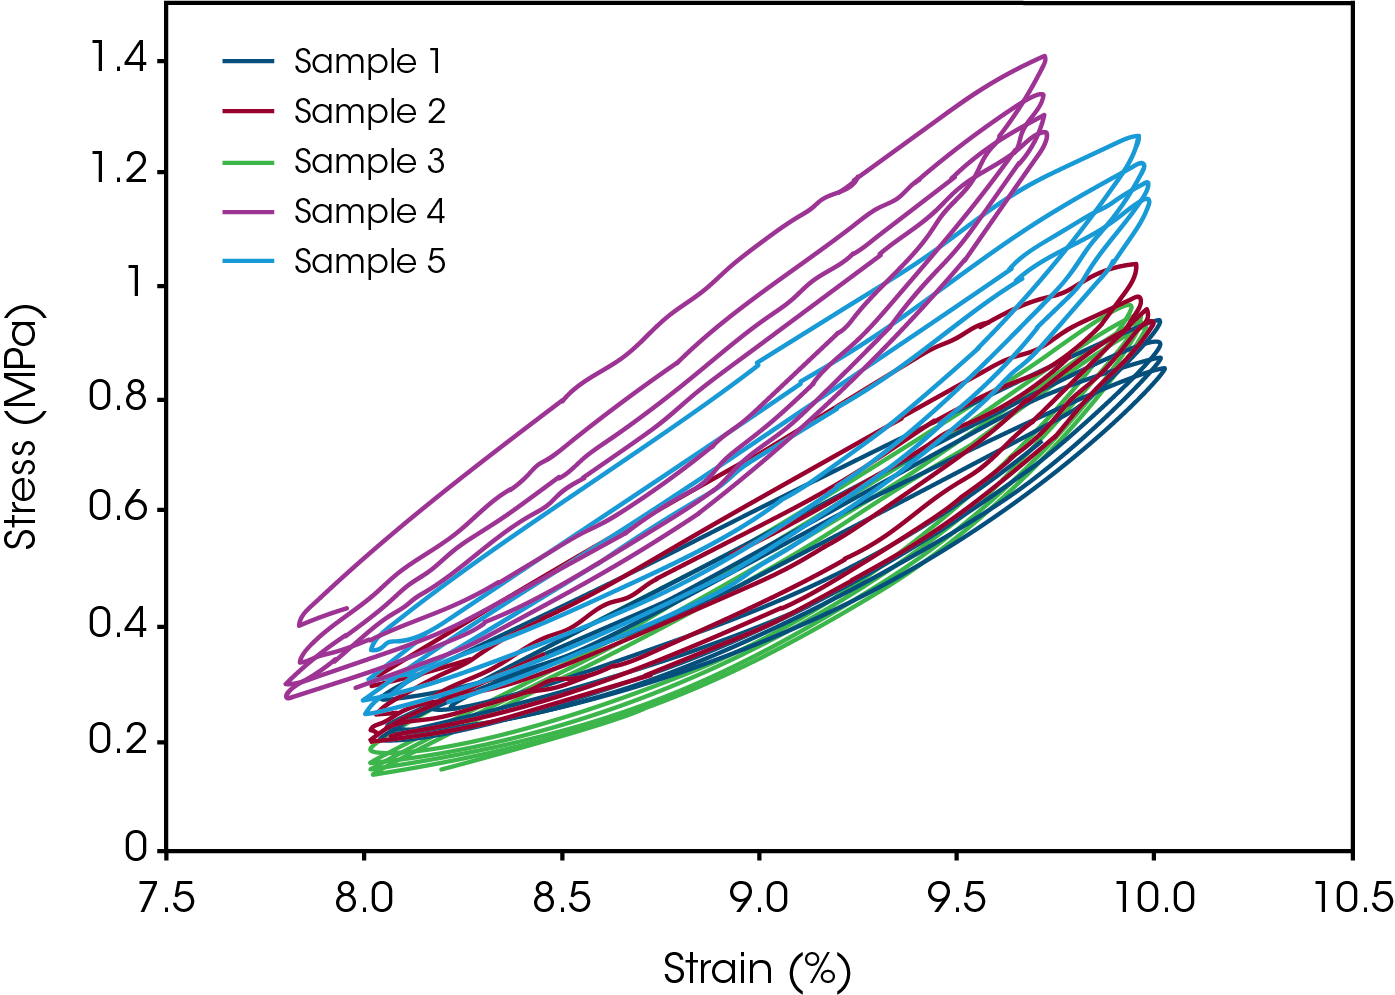
After the preconditioning protocols, samples were cyclically loaded under tension to characterize the dynamic properties of the PLGA strips. A triangular waveform was applied for 100 cycles at a frequency of 0.05 Hz, between 8% and 10% tensile strain relative to GL’’. This 8% to 10% strain region was determined to be the most linear loading region in the preconditioning tests.
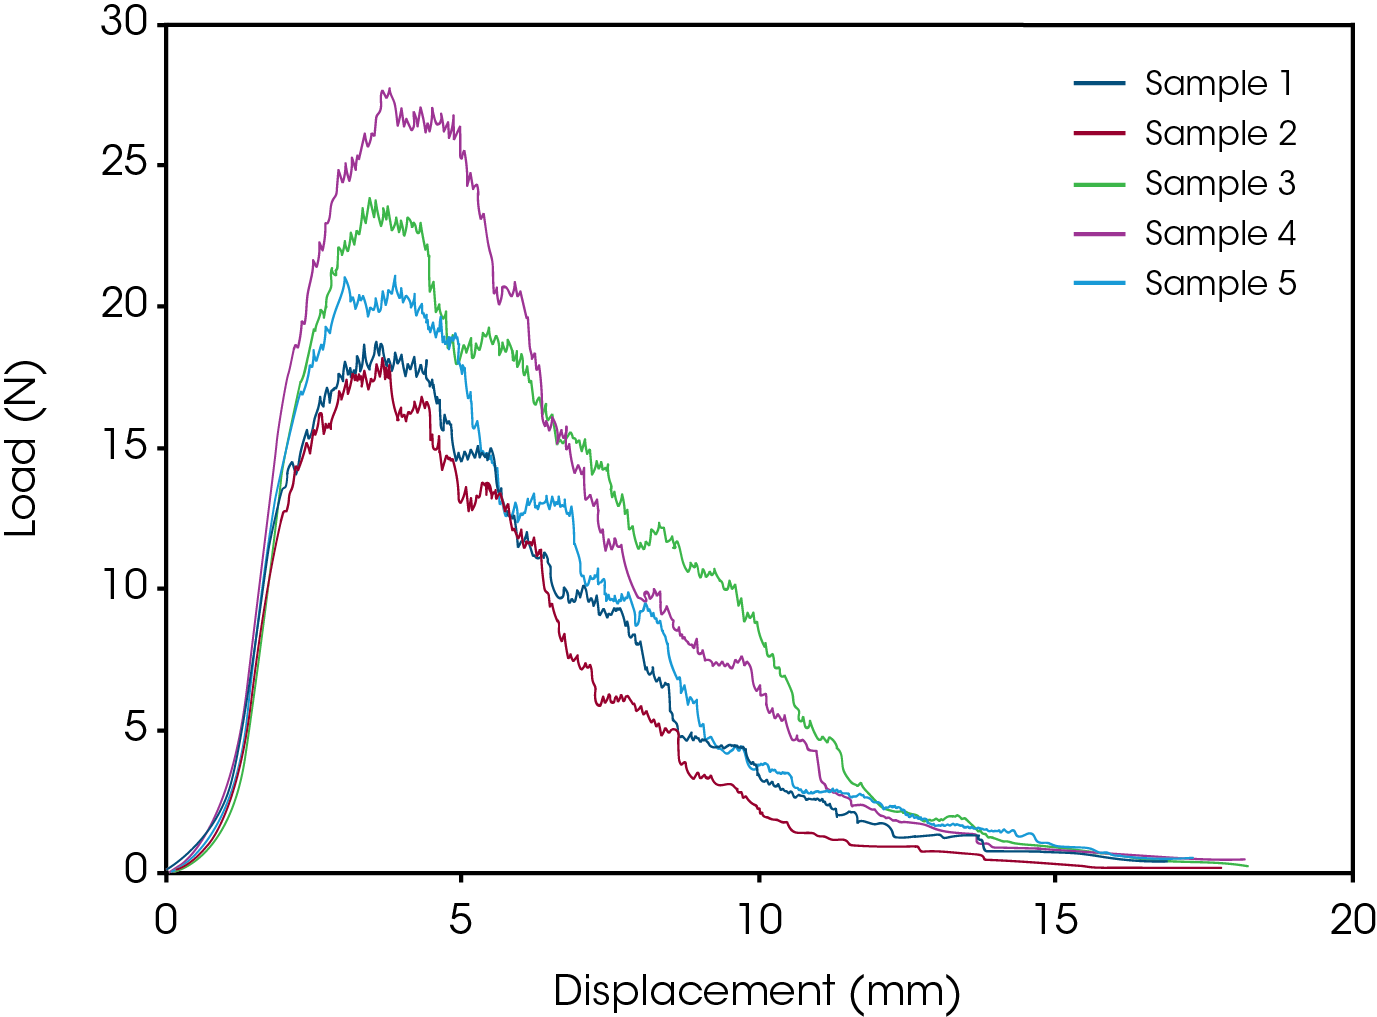
Finally, samples were pulled to failure immediately after cyclic loading to prevent relaxation. Samples were slowly ramped at a strain rate of 0.05 mm/s until total failure occurred at approximately 20% strain (Figure 4). Key mechanical properties, such as ultimate tensile strength and Young’s modulus, were calculated from the force-displacement data for each sample.
Results
The Stress-strain curves for the five samples (Figure 5) show the loading and unloading portions of the curves. They illustrate that the first cycle result in the highest forces after which stress relaxation is measured. The average peak force during the first cycle was 21.94 N (±3.53 N) for the five samples.
Ultimate tensile strength and Young’s modulus were calculated from the final force-displacement data for each sample during the final pull to failure. The average Young’s modulus was measured to be 32.0 MPa (± 7.3 MPa) and the average ultimate tensile strength was 4.3 MPa (± 1.0 MPa).
Summary
The purpose of this study was to characterize the variation in mechanical properties of a sheet of non-woven PLGA. Five sample strips were cut from the PLGA sheet and subjected to tensile loading. Preconditioning, cyclic straining and pull to failure tests were performed on the strips to determine variations in the strip gauge length, Young’s modulus and ultimate tensile strength. Sample variation is evident in the stress-strain and force-displacement plots. The fluctuations correlate to a 23% variation in the Young’s modulus and ultimate tensile strength of the samples. Possible causes for variations in stiffness may be attributed to changes in sample thickness and width, fiber concentration and other imperfections due to fabrication. A slight correlation was seen between the thickness, gauge length and stiffness of the strips. Samples with greater thickness seemed to have a shorter preloaded gauge length and increased compliance. However, a more extensive study should be performed to establish the statistical significance of this trend.
The study reported here showed that the ElectroForce® TestBench system featuring the extended stroke actuator is capable of producing large displacements while precisely monitoring force. Dynamic preconditioning, cyclic straining and pull to failure tests were all performed to characterize the mechanical properties of non-woven PLGA subjected to uniaxial loading. Stiffness variations in the fabricated sheet of PLGA could be detected because of the sensitivity of the instrument. The TestBench instrument is available available in a number of configurations, including configurations that allow for uniaxial loading, planar biaxial testing to further characterize the mechanical properties of polymers such as the PLGA scaffolds studied here.
Acknowledgement
Click here to download the printable version of this application note.

