Dedicated Humidity Instrument
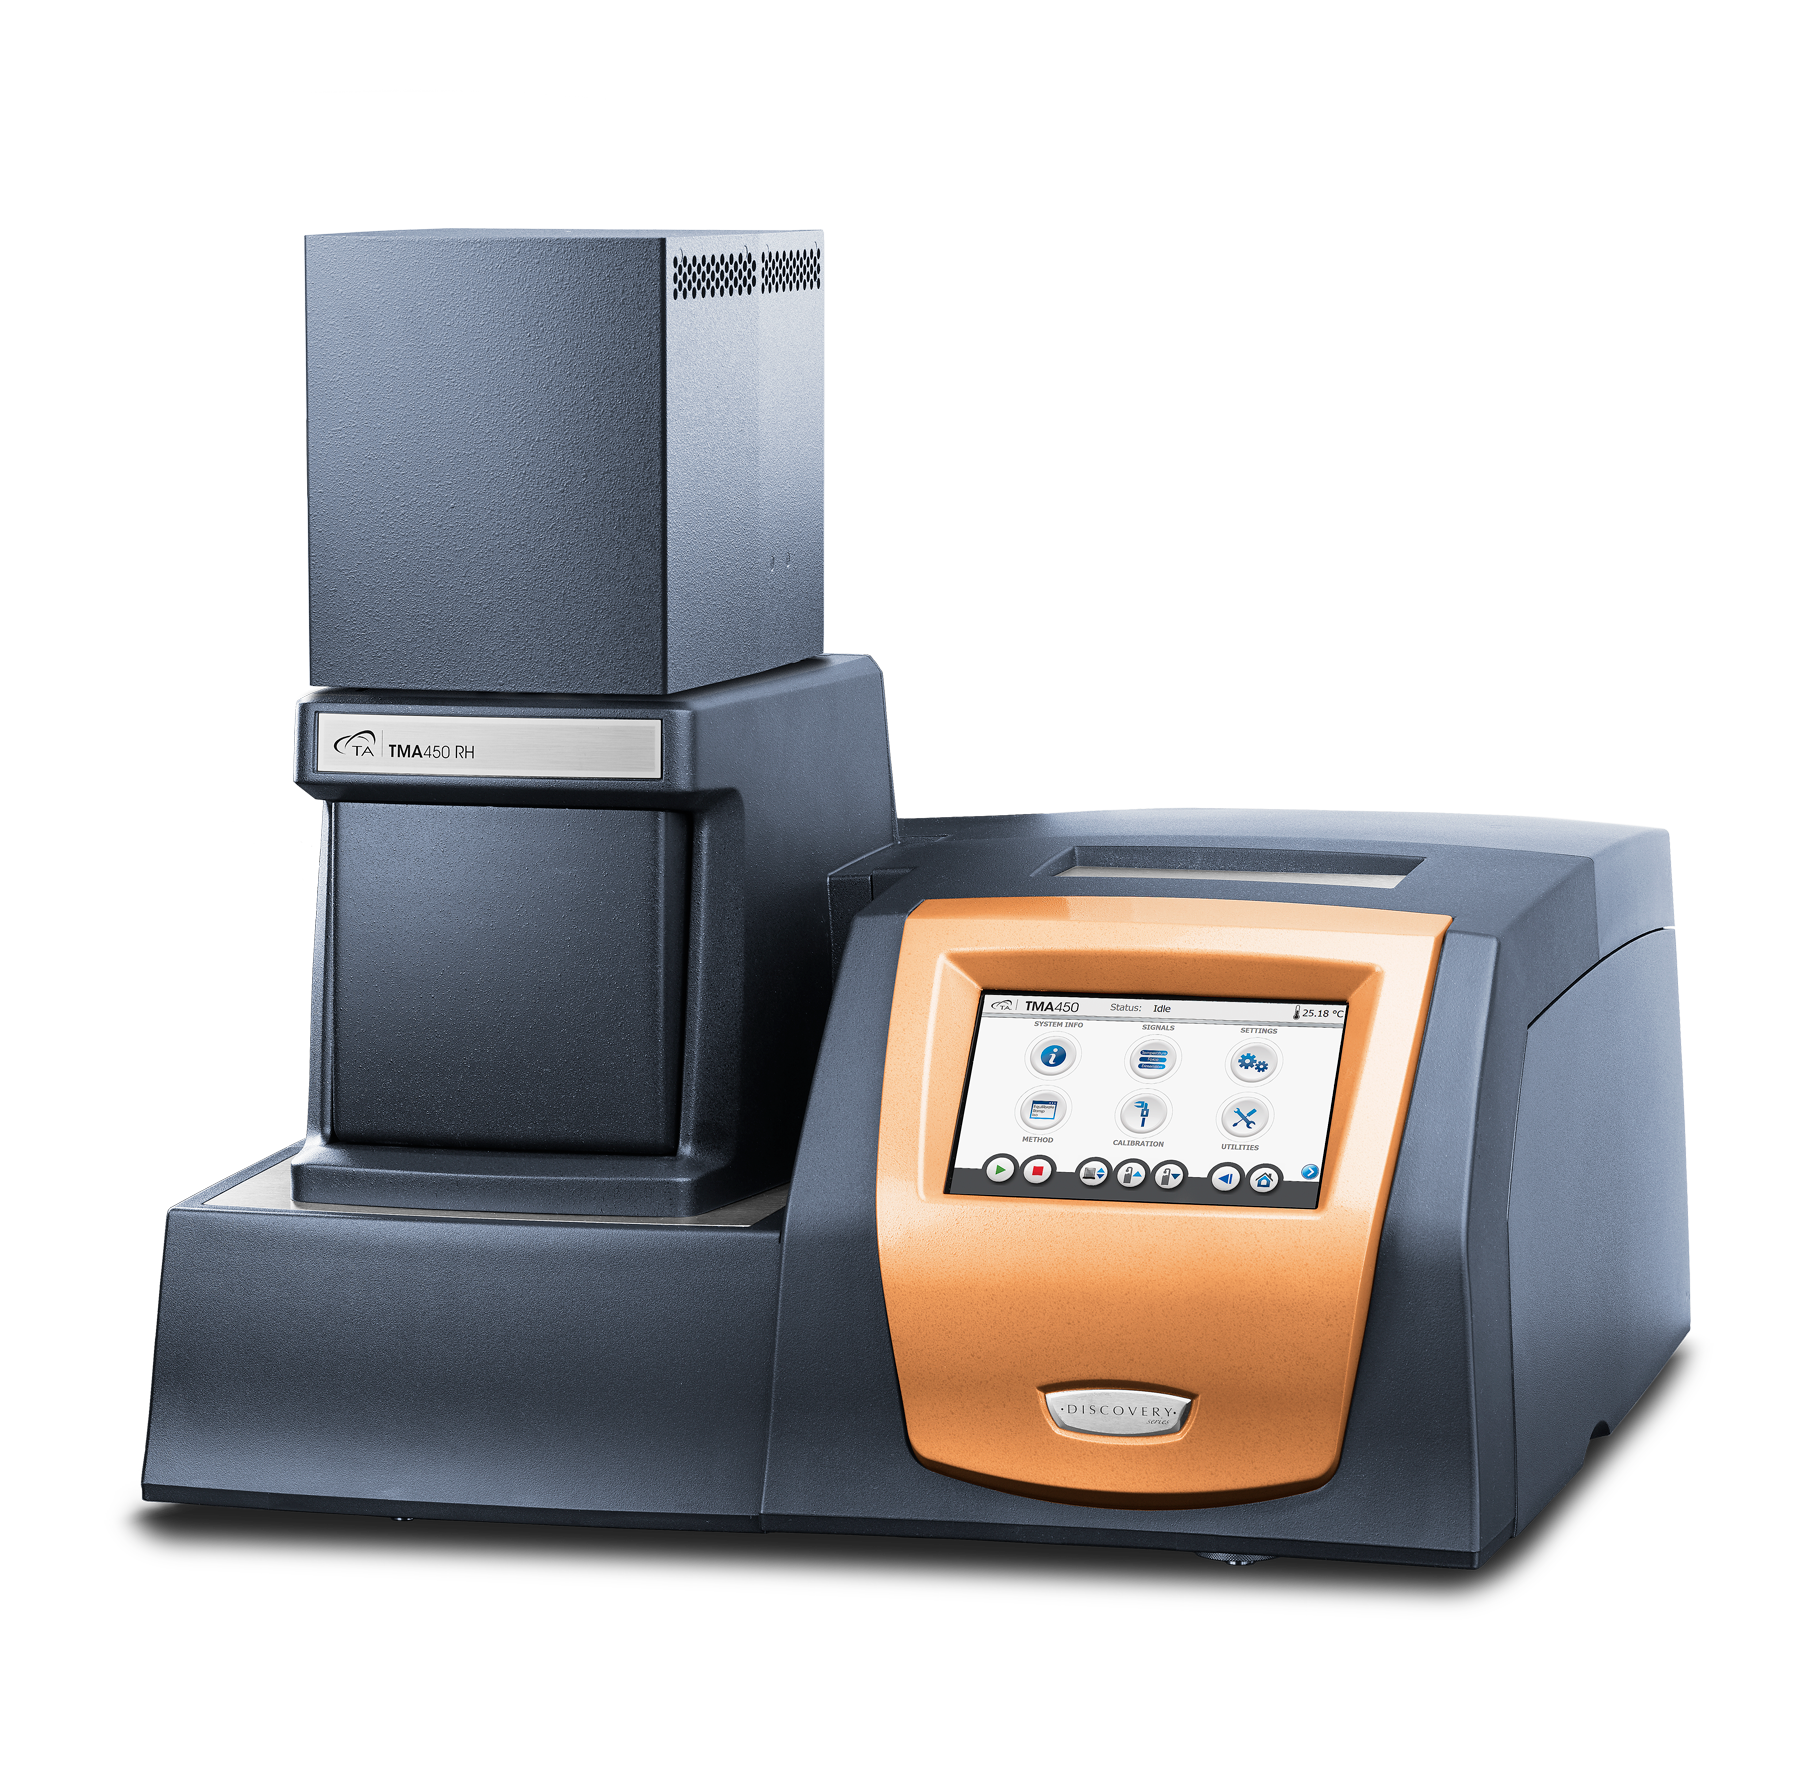
The ALL NEW TMA 450 RH is a stand-alone instrument that allows for controlled relative humidity experiments over both wide temperature and RH ranges. Measure CHE, CTE*, track Tg changes, and perform dynamic experiments, all under a controlled RH environment.
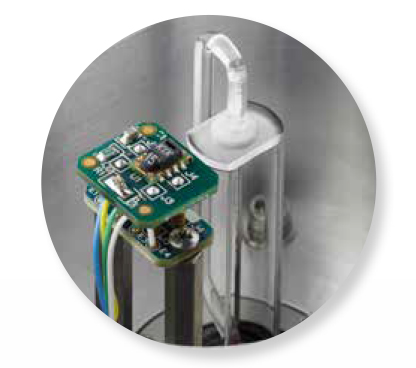
The TMA 450 RH sample chamber is specifically designed with a precisely positioned temperature and humidity sensor to provide the best control of the sample’s temperature and humidity environment.
Features and Benefits:
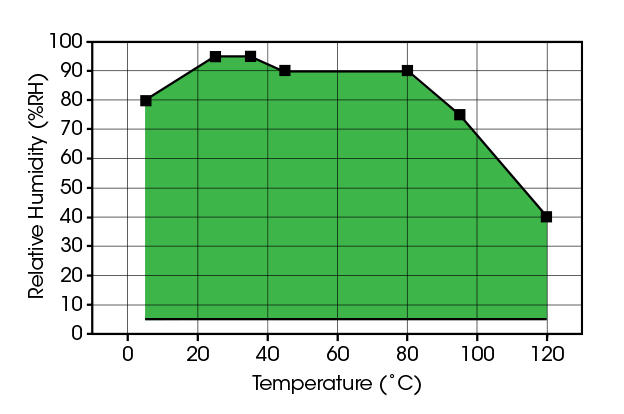
- Broadest range of RH and Temperature of any instrument on the market (See graph in specifications tab).
- Widest range of low-expansion quartz fixtures providing industry-leading baseline flatness for superior dimension change measurements.
- Non-contact, friction-free motor delivers forces from 0.001 N to 2 N enabling measurements on the widest range of samples.
- Advanced modes for dynamic, creep, stress relaxation, or isostrain experiments.
- Powerful TRIOS software combines instrument control, data analysis, and reporting in an integrated package to deliver an exceptional user experience.
- Innovative, “app-style” touch screen enhances usability by putting instrument functionality simply One-Touch Away™.
Discovery TMA RH Specifications
| Temperature Range | 5 – 120 °C |
| Temperature Precision | ±0.1°C |
| Heating/Cooling Rate | 0.01 – 1°C/min |
| Humidity Range | 5 – 95% (see chart) |
| Humidity Accuracy | 5 – 90% ±3% >90 – 95% ±5% |
| Humidity Ramp Rate | 0.1 – 2 %RH/min |
| Maximum Sample Size | 26 mm |
| Measurement Precision | ±0.1% |
| Sensitivity | 15 nm |
| Force Range | 0.001 – 2 N |
| Frequency Range | 0.01 – 2 Hz |
 The Most VERSATILE CONTROL and ANALYSIS SOFTWARE!
TA Instruments’ state-of-the-art software package uses cutting-edge technology for instrument control, data collection, and data analysis for thermal analysis and rheology. The intuitive user interface allows you to simply and effectively program experiments, and move easily between processing experiments and viewing and analyzing data.
JSON Export
JSON Export: The Future of Data Management
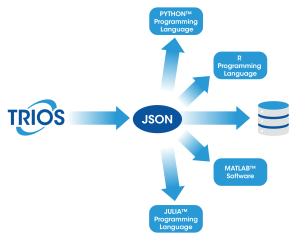
- Seamless Integration: Convert your TRIOS data into the open standard JSON format, making it easy to integrate with programming tools, data science workflows, and lab systems (e.g. LIMS). JSON is available:
- Automatically on every save (enabled in options)
- Through manual export dialogs
- As part of the “Send to LIMS” functionality
- Via the “Batch” processing dialog or from the command line
- In TRIOS AutoPilot
- Data Consistency: Our publicly available JSON schema ensures a consistent data structure, allowing you to write code once and apply it universally across all your data files.
- Python Library: Use our open-sourced python library, TA Data Kit, to simplify your data ingestion or learn how to take advantage of the power of our data with our code examples.
For more information, click here
TRIOS Features
TRIOS Features
- Control multiple instruments with a single PC and software package
- Overlayand compare results across techniques including TMA, DMA, DSC, TGA, SDT, and rheometers
- One-Click analysis for increased productivity
- Automatedcustomreport generation including: experimental details, data plots and tables, analysis results
- Convenient data export to plain-text, PDF, CSV, XML, Excel®, Word®, PowerPoint®, and image formats
- Optional TRIOS Guardian with electronic signatures for audit trail and data integrity
Excel®, Word®, and PowerPoint® are registered trademarks of Microsoft Corporation
Touch Screen
 Touch Screen
The Discovery TMA 450 features TA’s innovative touch screen, making operation easier than ever with enhanced One-Touch- Away™ functionality.
Touch Screen Features and Benefits:
- Ergonomic design for enhanced accessibility and productivity
- Packedwith functionality to simplify instrument operation
- Resilient, responsive touch screen for an enhanced user experience The One-Touch-Away™ interface includes:
- Start/stop controls Real-time signals and plot
- Active method viewing Temperaturesettings
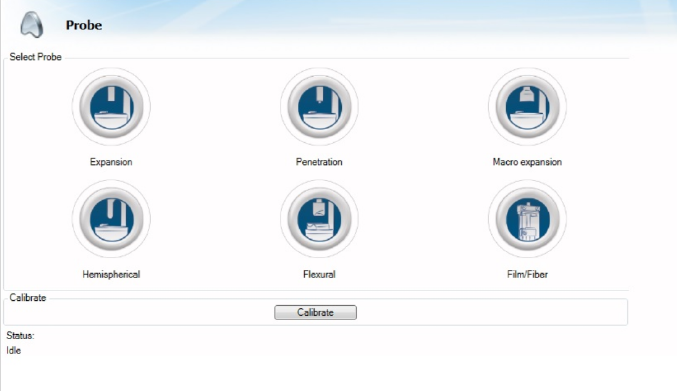
- Probeand force calibrations Probe position and sample measurement settings
- System information Testand instrument status
The app-style touch screen, powerful new TRIOS software, and quick robust calibration routines work seamlessly to dramatically improve laboratory workflows and productivity.
Ease of Use
Ease of Use
TRIOS software makes calibration and operation of the TMA 450 simple. Users can easily generate multiple calibration data sets under varying experimental conditions (e.g. different heating rates or gas selections) and seamlessly switch between them to match the experimental conditions used for sample testing. Real-time signals and the progress of running experiments is readily available, with the added capability of modifying a running method on the fly. TRIOS software offers a level of flexibility that is unmatched in the industry.
Quick & Easy Calibration
Quick & Easy Calibration
TRIOS software makes calibrating the sample fixtures/probes and the TMA 450 effortless. Clear instructions, available on both the touch screen and TRIOS software, guide the operator through simple calibration steps that end with a summary report. The report provides calibration status at a glance and is stored with each data file to ensure data integrity.
Complete Data Record
Complete Data Record
The advanced data collection system automatically saves all relevant signals, active calibrations, and system settings. This comprehensive set of information is invaluable for method development, procedure deployment, and data validation.
Complete Data Analysis Capabilities
Complete Data Analysis Capabilities
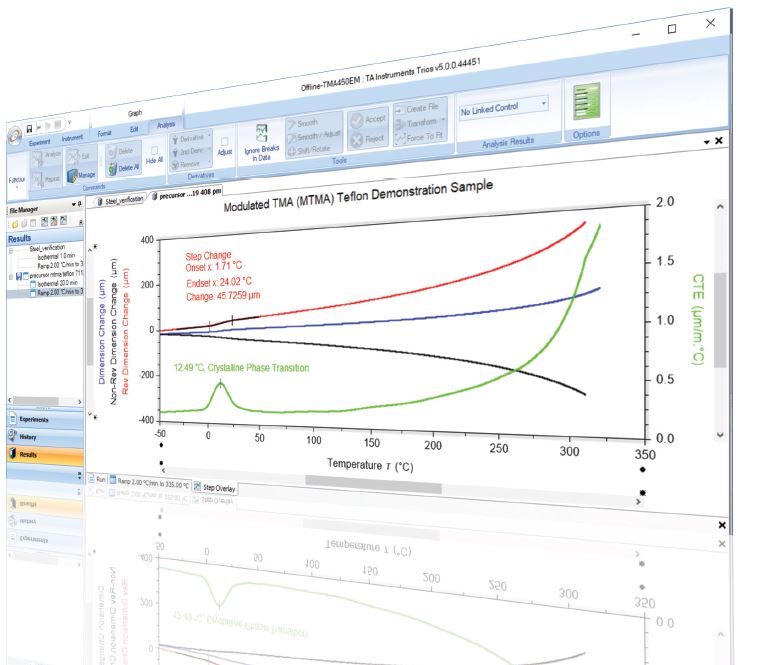
A comprehensive set of relevant tools are available for real-time data analysis, even during experiments. Gain actionable insights into your material behavior through a powerful and versatile set of features seamlessly integrated into TRIOS.
All Standard TMA Analyses:
- Alpha at X1 (CTE)
- Alpha at X1 to X2 (CTE)
- Alpha fit X1 to X2 (CTE)
- Onset and endset analysis
- Dimension change (absolute and %)
- Signal maximum and minimum
- Steptransition
- Curve values at specific X or Y points
- 1st and 2nd derivatives
- Mathematical fitting: straight line, polynomial, or exponential
Advanced Analysis Capabilities on the TMA 450EM:
- Storageand loss moduli, with tan delta peak analysis when using Dynamic TMA
- Deconvolution of the Total Dimension Change signal with Modulated TMATM (MTMATM) into Reversing and Non-Reversing dimension change signals for separating expansion from contraction, shrinkage, and stress relaxation
Humidity Applications
Assessing CHE
Assessing CHE
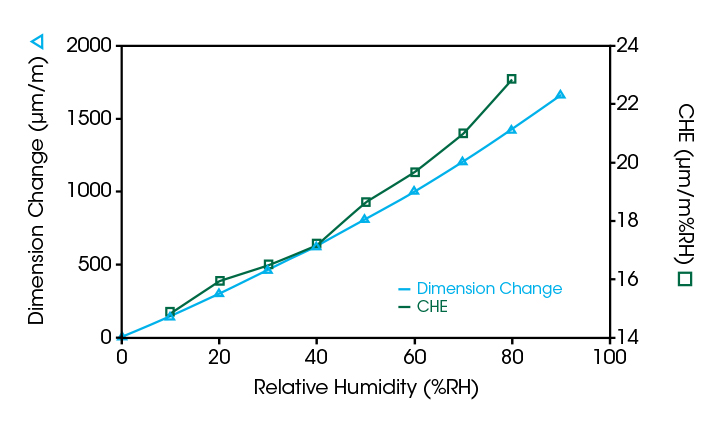
The expansion or swelling of a material due to water uptake is dependent on the material’s coefficient of hygroscopicity (CHE). The plot to the right measures this property for Kapton, an important polyimide used in the electronics industry. The plot is a sorption isotherm produced from a stepped humidity experiment. Also shown is the calculated CHE between successive points.
Comparing Hygroscopicity
Comparing Hygroscopicity
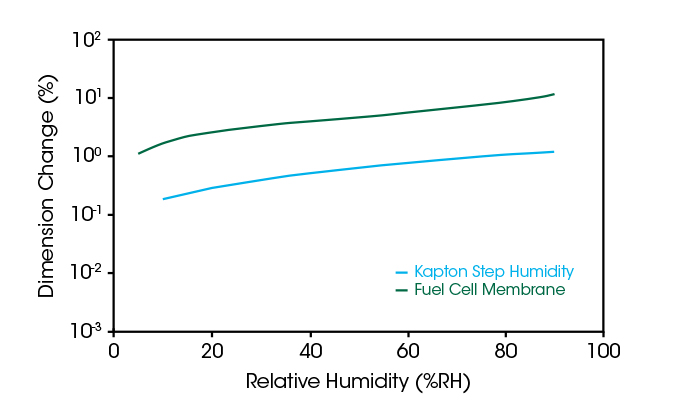
Perflurosulfonic Acid (PFSA) films, also known as proton exchange membranes, are used extensively in new battery technology. Many advanced polymers must be tested for responses to humid conditions. The plot to the right the comparison of the hygroscopicity of commercial film compared against the Kapton data above. The PFSA film has approximately an order of magnitude larger response to humidity than the Kapton.
Detecting Tg
Detecting Tg
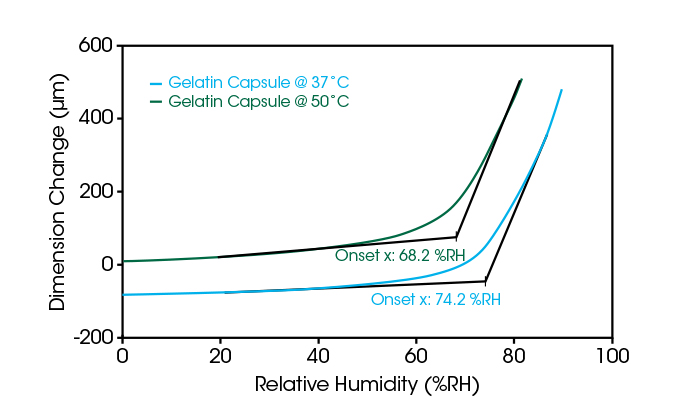
Glass transitions are sensitive to water uptake, as the water acts as a plasticizer. Detecting and tracking changes in Tg are critical to material function and storage. The plot to the right shows the Tg of a gelatin used in pharmaceutical drug capsules captured with a RH ramp of 2%/min at 37 and 50°C. At higher temperatures, the Tg is shifted to lower RH levels due to higher water uptake and resultant plasticization.
Shrinking on Drying
Shrinking on Drying
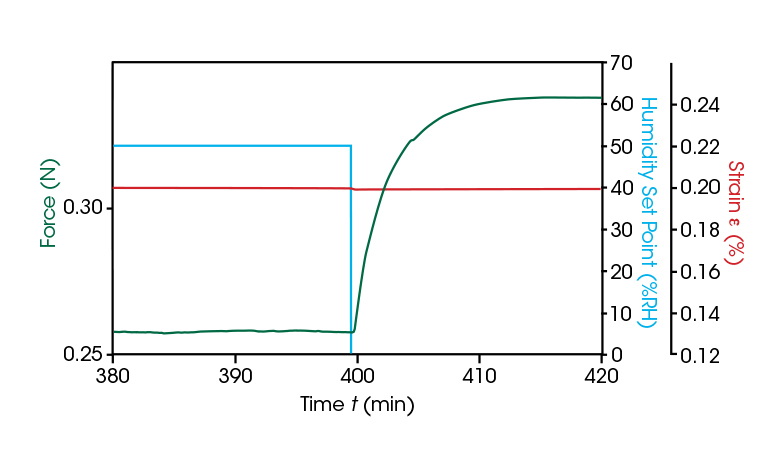
Many materials shrink while drying, and it is important to be able to understand the forces involved. In the plot on the right, a polymer film is held under isostrain conditions of 0.2% and the force necessary to maintain this strain is tracked during a rapid change in humidity from 50 to 0%. The increase in force necessary to maintain the strain constant is clearly measured.
- Description
-
The ALL NEW TMA 450 RH is a stand-alone instrument that allows for controlled relative humidity experiments over both wide temperature and RH ranges. Measure CHE, CTE*, track Tg changes, and perform dynamic experiments, all under a controlled RH environment.
The TMA 450 RH sample chamber is specifically designed with a precisely positioned temperature and humidity sensor to provide the best control of the sample’s temperature and humidity environment.

- Features & Benefits
-
Features and Benefits:
- Broadest range of RH and Temperature of any instrument on the market (See graph in specifications tab).
- Widest range of low-expansion quartz fixtures providing industry-leading baseline flatness for superior dimension change measurements.
- Non-contact, friction-free motor delivers forces from 0.001 N to 2 N enabling measurements on the widest range of samples.
- Advanced modes for dynamic, creep, stress relaxation, or isostrain experiments.
- Powerful TRIOS software combines instrument control, data analysis, and reporting in an integrated package to deliver an exceptional user experience.
- Innovative, “app-style” touch screen enhances usability by putting instrument functionality simply One-Touch Away™.
- Specifications
-
Discovery TMA RH Specifications
Temperature Range 5 – 120 °C Temperature Precision ±0.1°C Heating/Cooling Rate 0.01 – 1°C/min Humidity Range 5 – 95% (see chart) Humidity Accuracy 5 – 90% ±3%
>90 – 95% ±5%Humidity Ramp Rate 0.1 – 2 %RH/min Maximum Sample Size 26 mm Measurement Precision ±0.1% Sensitivity 15 nm Force Range 0.001 – 2 N Frequency Range 0.01 – 2 Hz 
- Software
-
 The Most VERSATILE CONTROL and ANALYSIS SOFTWARE!
TA Instruments’ state-of-the-art software package uses cutting-edge technology for instrument control, data collection, and data analysis for thermal analysis and rheology. The intuitive user interface allows you to simply and effectively program experiments, and move easily between processing experiments and viewing and analyzing data.
JSON Export
JSON Export: The Future of Data Management

- Seamless Integration: Convert your TRIOS data into the open standard JSON format, making it easy to integrate with programming tools, data science workflows, and lab systems (e.g. LIMS). JSON is available:
- Automatically on every save (enabled in options)
- Through manual export dialogs
- As part of the “Send to LIMS” functionality
- Via the “Batch” processing dialog or from the command line
- In TRIOS AutoPilot
- Data Consistency: Our publicly available JSON schema ensures a consistent data structure, allowing you to write code once and apply it universally across all your data files.
- Python Library: Use our open-sourced python library, TA Data Kit, to simplify your data ingestion or learn how to take advantage of the power of our data with our code examples.
For more information, click here
TRIOS Features
TRIOS Features
- Control multiple instruments with a single PC and software package
- Overlayand compare results across techniques including TMA, DMA, DSC, TGA, SDT, and rheometers
- One-Click analysis for increased productivity
- Automatedcustomreport generation including: experimental details, data plots and tables, analysis results
- Convenient data export to plain-text, PDF, CSV, XML, Excel®, Word®, PowerPoint®, and image formats
- Optional TRIOS Guardian with electronic signatures for audit trail and data integrity

Excel®, Word®, and PowerPoint® are registered trademarks of Microsoft Corporation
Touch Screen
 Touch Screen
 The Discovery TMA 450 features TA’s innovative touch screen, making operation easier than ever with enhanced One-Touch- Away™ functionality.
Touch Screen Features and Benefits:
- Ergonomic design for enhanced accessibility and productivity
- Packedwith functionality to simplify instrument operation
- Resilient, responsive touch screen for an enhanced user experience The One-Touch-Away™ interface includes:
- Start/stop controls Real-time signals and plot
- Active method viewing Temperaturesettings
- Probeand force calibrations Probe position and sample measurement settings
- System information Testand instrument status
The app-style touch screen, powerful new TRIOS software, and quick robust calibration routines work seamlessly to dramatically improve laboratory workflows and productivity.
Ease of Use
Ease of Use
TRIOS software makes calibration and operation of the TMA 450 simple. Users can easily generate multiple calibration data sets under varying experimental conditions (e.g. different heating rates or gas selections) and seamlessly switch between them to match the experimental conditions used for sample testing. Real-time signals and the progress of running experiments is readily available, with the added capability of modifying a running method on the fly. TRIOS software offers a level of flexibility that is unmatched in the industry.
Quick & Easy Calibration
Quick & Easy Calibration
TRIOS software makes calibrating the sample fixtures/probes and the TMA 450 effortless. Clear instructions, available on both the touch screen and TRIOS software, guide the operator through simple calibration steps that end with a summary report. The report provides calibration status at a glance and is stored with each data file to ensure data integrity.
Complete Data Record
Complete Data Record
The advanced data collection system automatically saves all relevant signals, active calibrations, and system settings. This comprehensive set of information is invaluable for method development, procedure deployment, and data validation.
Complete Data Analysis Capabilities
Complete Data Analysis Capabilities
A comprehensive set of relevant tools are available for real-time data analysis, even during experiments. Gain actionable insights into your material behavior through a powerful and versatile set of features seamlessly integrated into TRIOS.

All Standard TMA Analyses:
- Alpha at X1 (CTE)
- Alpha at X1 to X2 (CTE)
- Alpha fit X1 to X2 (CTE)
- Onset and endset analysis
- Dimension change (absolute and %)
- Signal maximum and minimum
- Steptransition
- Curve values at specific X or Y points
- 1st and 2nd derivatives
- Mathematical fitting: straight line, polynomial, or exponential
Advanced Analysis Capabilities on the TMA 450EM:
- Storageand loss moduli, with tan delta peak analysis when using Dynamic TMA
- Deconvolution of the Total Dimension Change signal with Modulated TMATM (MTMATM) into Reversing and Non-Reversing dimension change signals for separating expansion from contraction, shrinkage, and stress relaxation
- Seamless Integration: Convert your TRIOS data into the open standard JSON format, making it easy to integrate with programming tools, data science workflows, and lab systems (e.g. LIMS). JSON is available:
- Applications
-
Humidity Applications
Assessing CHE
Assessing CHE
The expansion or swelling of a material due to water uptake is dependent on the material’s coefficient of hygroscopicity (CHE). The plot to the right measures this property for Kapton, an important polyimide used in the electronics industry. The plot is a sorption isotherm produced from a stepped humidity experiment. Also shown is the calculated CHE between successive points.

Comparing Hygroscopicity
Comparing Hygroscopicity
Perflurosulfonic Acid (PFSA) films, also known as proton exchange membranes, are used extensively in new battery technology. Many advanced polymers must be tested for responses to humid conditions. The plot to the right the comparison of the hygroscopicity of commercial film compared against the Kapton data above. The PFSA film has approximately an order of magnitude larger response to humidity than the Kapton.

Detecting Tg
Detecting Tg
Glass transitions are sensitive to water uptake, as the water acts as a plasticizer. Detecting and tracking changes in Tg are critical to material function and storage. The plot to the right shows the Tg of a gelatin used in pharmaceutical drug capsules captured with a RH ramp of 2%/min at 37 and 50°C. At higher temperatures, the Tg is shifted to lower RH levels due to higher water uptake and resultant plasticization.

Shrinking on Drying
Shrinking on Drying
Many materials shrink while drying, and it is important to be able to understand the forces involved. In the plot on the right, a polymer film is held under isostrain conditions of 0.2% and the force necessary to maintain this strain is tracked during a rapid change in humidity from 50 to 0%. The increase in force necessary to maintain the strain constant is clearly measured.

- Video
-


