Keywords: biomolecules, structure stability, proteins, antibodies, drug formulation, pharmaceuticals
MC151
Introduction
Perturbations in the structure of large biomolecules (DNA, mRNA, proteins, and antibodies) results in concomitant changes in biomolecular function. Biological molecules require stabilization for in vitro analysis, as well as extended storage, manufacturing, and processing. In the case of biotherapeutic molecules, changes in structure could unexpectedly reduce or enhance drug product quality and safety. The primary stabilizing forces for biomolecules in solution are the non-covalent interactions between the biomolecule and its immediate solution environment. In living organisms, biomolecules are stabilized through a network of active cellular processes, but in solution, biomolecules rely on excipients (salts, detergents, sugars, buffers, etc.) for stabilization. Analytical instruments that can quantify the chemical influence of excipients on the structural stability of a biomolecule include: Spectroscopic, scattering, fluorescence, and thermodynamic techniques. Thermodynamic techniques are sensitive, reproducible, and extremely easy to setup because samples do not require labeling or modification. We performed a comparability study of a liquid protein reference formulation using a nano differential scanning calorimeter (Nano DSC) to reveal that this thermodynamic technology detects the smallest changes in biomolecular structure in response to subtle manipulations in the reference formulation.
Materials and Methods
Lysozyme reference samples (1 mg / mL) in glycine buffer (TA Instruments-Waters LLC) were pH adjusted to 5 different pH values (2.2, 2.4, 2.7, 3.2, and 3.6), or 6 different concentrations (0 M, 0.1 M, 0.2 M, 0.5 M, 1 M, and 1.5 M) of sorbitol (Sigma-Aldrich) at a solution pH of 3.2. Each reference sample formulation condition was run in triplicate on a Nano DSC (TA Instruments-Waters LLC) equipped with an autosampler and 96-well plates. The structure stability changes in the protein sample were measured thermodynamically over the temperature range 30 °C to 100 °C, and at a temperature scan rate of 1 °C / minute. Determination of the peak thermodynamic stability temperature (Tmax) for each sample was calculated and visualized using NanoAnalyze (TA Instruments-Waters LLC). Comparative analysis and modeling were performed via plot of Tmax versus pH, or Tmax versus sorbitol concentration ([Sorbitol]), and the average Tmax and percent relative standard deviations were calculated for each set of experimental conditions.
Results
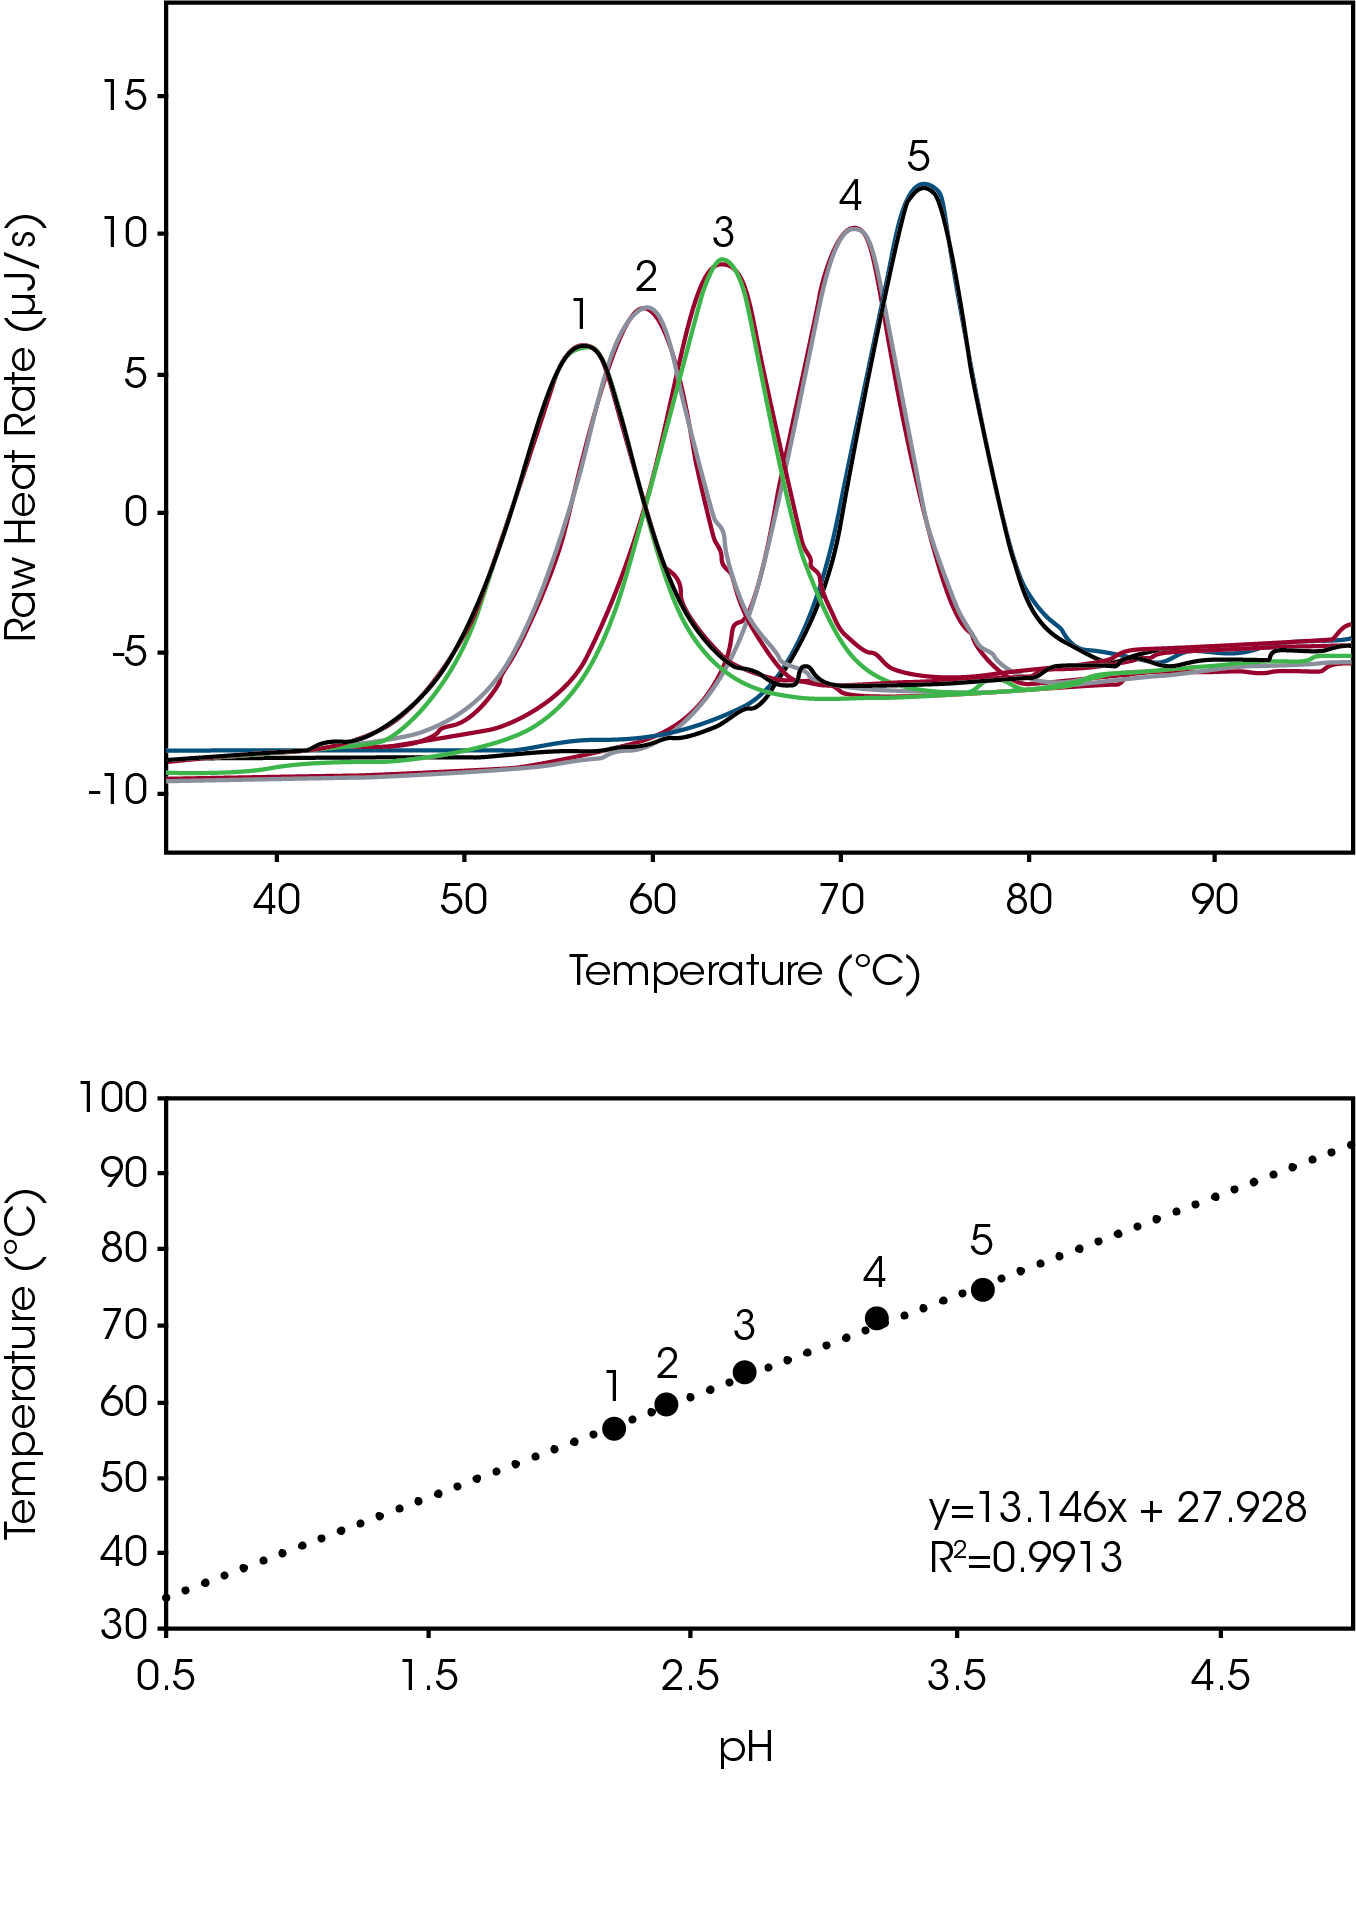
Biomolecules have energetically favored conformations (structures) in solution. Optimization of a molecules ionic charge is an essential step to ensure the charge stability of the molecules structure [1]. To determine the degree of structure stability change that occurs as a function of buffer pH, we incrementally adjusted the pH of a lysozyme reference sample and tracked the peak temperature of thermal denaturation (Tmax). Small adjustment of solvent pH yields large changes in Tmax, and the attenuation of thermal denaturation at the higher pH values indicates an increase in biomolecular structure stability (Fig 1 Top). Over the effective acidic buffer range of glycine (pH 2.2 – 3.6) there is an apparent linear change in structure stability (R2 = 0.99) in the plot of Temperature Stability versus pH (Fig 1, Bottom). Data reveal maximum lysozyme stability at a glycine buffer pH of 3.6 and excellent triplicate reproducibility (% RSD ≤ 0.15) (Table 1).
Tabulated average peak value (Tmax) and % RSD (n=3).
| Curve # | pH | Tmax (ºC) | % RSD |
|---|---|---|---|
| 1 | 2.2 | 56.25 | 0.11 |
| 2 | 2.4 | 59.57 | 0.10 |
| 3 | 2.7 | 63.83 | 0.15 |
| 4 | 3.2 | 70.90 | 0.12 |
| 5 | 3.6 | 74.45 | 0.15 |

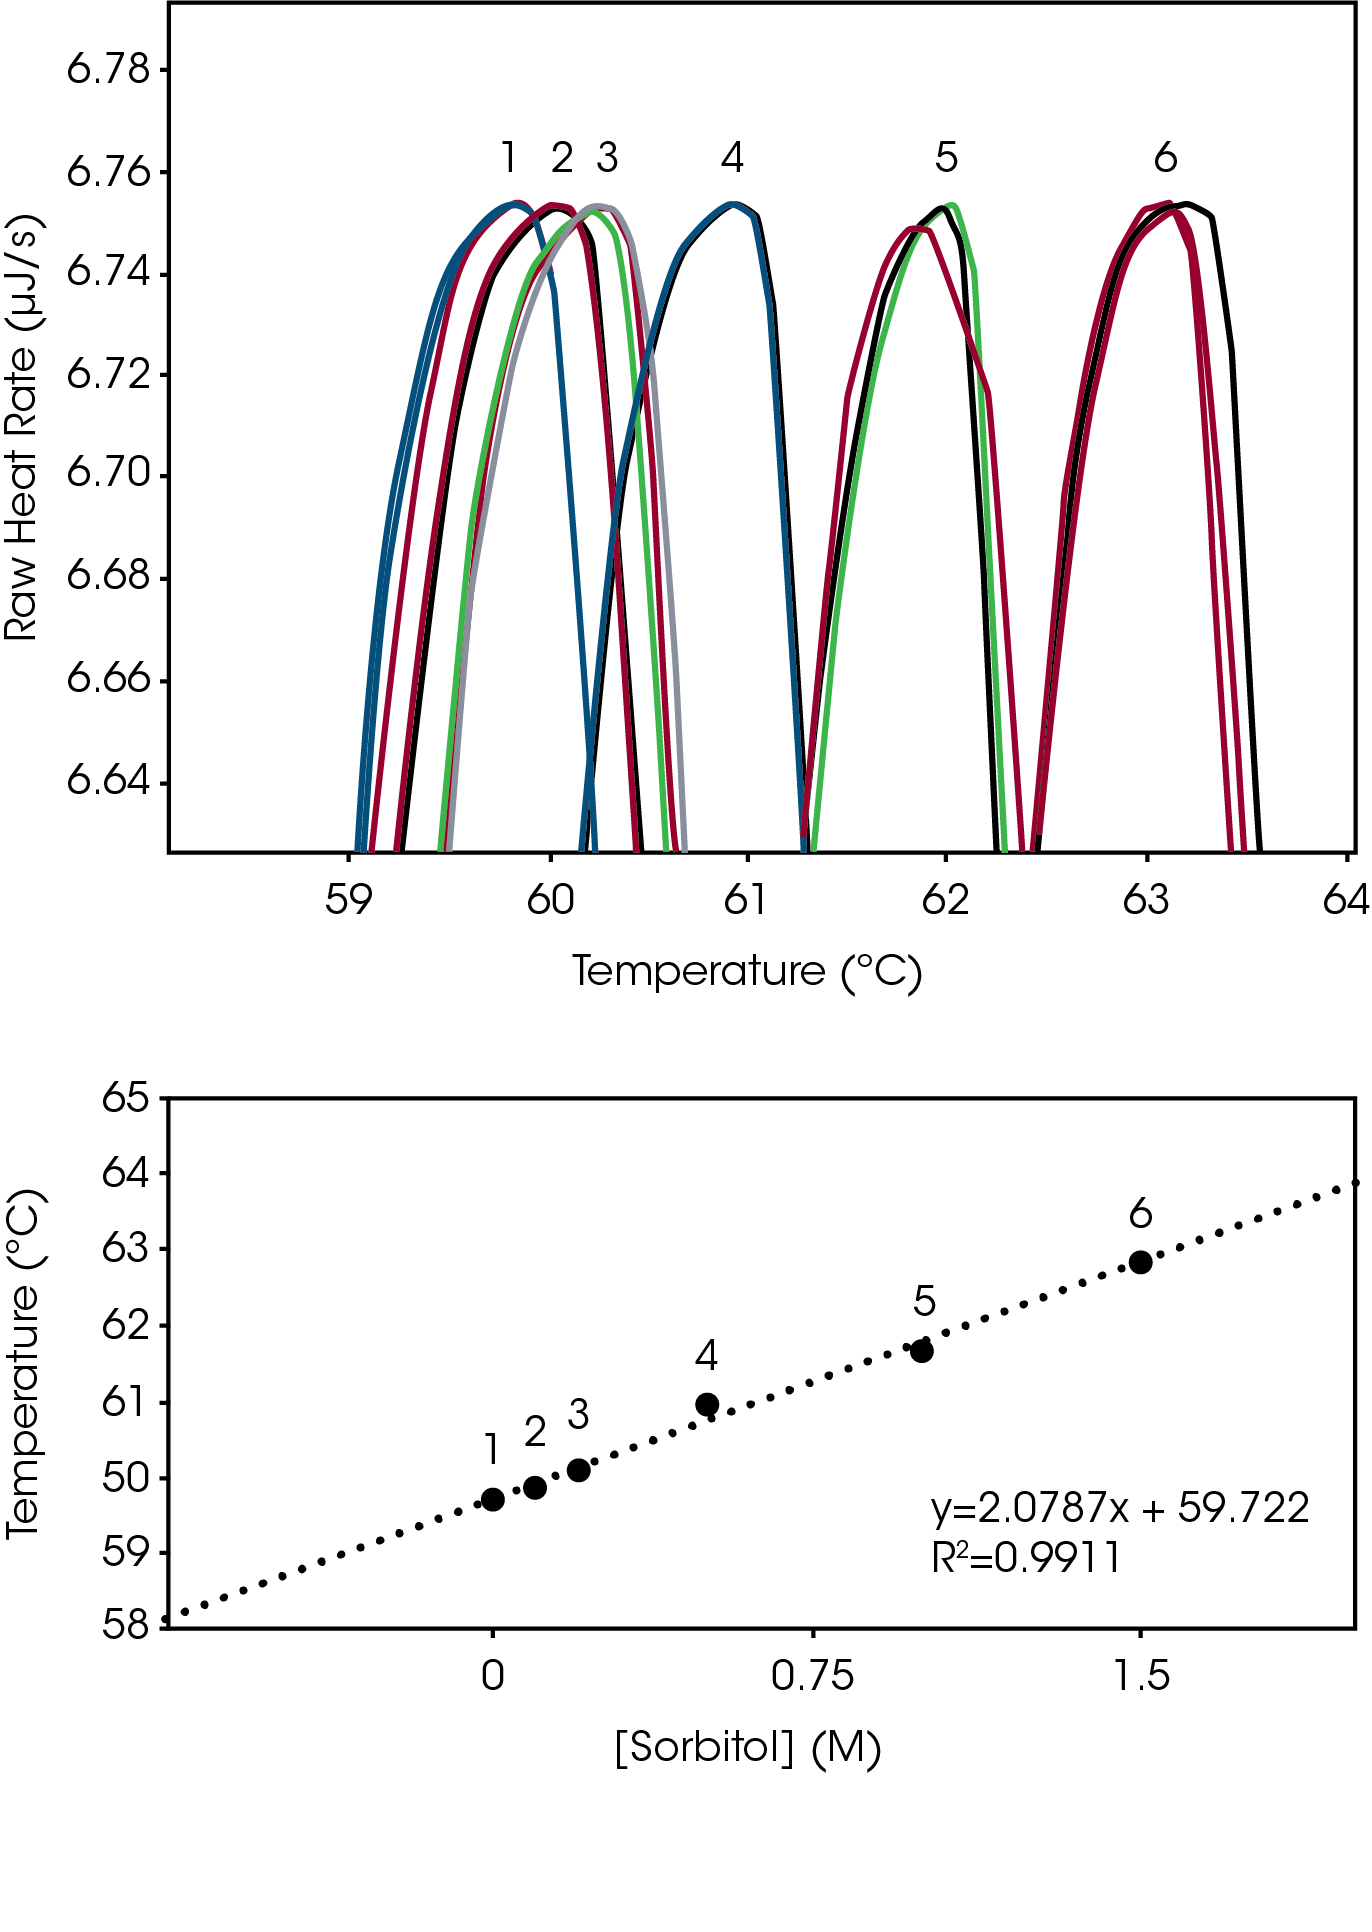
Excipients, such as sorbitol, glycerol and glycols increase biomolecular structure stability by increasing solubility in aqueous environments [2]. The degree of biomolecular structure stability change that occurs when a solubilizing agent is adjusted was assessed for the lysozyme reference sample, from 0 M to 1.5 M sorbitol. Unlike the relatively large changes detected with pH adjustment, adjustment of sorbitol over the entire range was approximately 3 °C (Fig 2, Top). The plot of Sorbitol Concentration vs Tmax also displayed the proportional linear change in stability temperature (Fig 2, Bottom), like the plot of pH versus Tmax (Fig 1, Bottom). The Nano DSC resolved structure stability changes as small as 0.2 °C with excellent triplicate reproducibility (% RMS ≤ 0.24°C, Table 2).
Tabulated average peak value (Tmax) and % RSD (n=3).
| Curve # | [Sorbitol] | Tmax (ºC) | % RSD |
|---|---|---|---|
| 1 | 0 | 59.69 | 0.10 |
| 2 | 0.1 | 59.89 | 0.15 |
| 3 | 0.2 | 60.11 | 0.17 |
| 4 | 0.5 | 60.97 | 0.20 |
| 5 | 1 | 61.66 | 0.10 |
| 6 | 1.5 | 62.87 | 0.24 |

Conclusion
Information from Nano DSC experiments enable scientists to make the best formulations, as well as monitor changes in their product over time. For the lysozyme reference sample, changes in pH elicit large differences in biomolecular stability, and changes in solubilizing agent revealed miniscule changes in biomolecular stability. The small changes measured during the sorbitol studies highlight the next-level sensitivity of the Nano DSC. When used as part of a DOE (Design of Experiment), Nano DSC could determine ideal formulation conditions, identify changes that occur in drug manufacturing, or storage. Nano DSC also offers significant ease of use because samples do not require fluorescent labeling, fusion-tagging, or chemical digestion. While it is uncommon for these types of modifications to perturb the biomolecule’s structure-function relationship, there are well known cases where such sample modifications have impeded the progress of science. When automated, the Nano DSC is an efficiency-increasing tool that provides peace of mind in decision making. The Nano DSC should be a part of every Discovery, Formulation and Analytical R&D testing panel.
References
1. Rabeh et al., General Biochemistry, preprint, (2020), DOI: https://doi.org/10.21203/rs.3.rs-40945/v1
2. Olsen et al., Thermochimica Acta, 484, (2009), 32-37
Acknowledgement
This application note was written by Neil Demarse, Microcalorimetry Product Manager at TA Instruments and Calliste Reiling, Applications Engineer at TA Instruments.
Click here to download the printable version of this application note.

