Keywords: nylon, nylon 66, polyamide, recycle, regrind, injection molding, DSC, TGA, MDSC, thermal analysis
TA469
Abstract
Thermal analysis of gears manufactured from nylon 6,6 with increasing percentages of added recycle ground from process scrap was performed to assess potential adverse effects on intermediate and final product properties.
Thermogravimetric analysis (TGA) shows minor changes in stability for the samples with up to 36% added recycle. The two 100% recycle samples show significant reduction in thermal stability.
Differential scanning calorimetry (DSC) results show differences in thermal transitions in the first heat that are likely due only to processing variations as the transitions appear to show less variation in the second heat. The most significant difference is in the relative standard deviation (RSD) in the change in heat capacity (ΔCP) at the glass transition (TG) which is 39% in the first heat and 11% in the second heat. ΔCP is proportional to the amount of amorphous phase present and appears to converge in the second heat indicating that the large variation observed in the first heat is due to processing. This may indicate that correlated physical properties may not be adversely affected by incorporating significant levels of recycle. The TG in the first heat is significantly lower than the second heat due to the plasticizing effect of water.
Enthalpic relaxation appears to increase with higher levels of recycle. Enthalpic relaxation is indicated in the DSC experiment by an endotherm at the glass transition known as enthalpic recovery. The associated energy was quantified by separating it from the glass transition using modulated DSC (MDSC).
Introduction
The use of recycled plastics is a key component of the circular economy and is increasing due to demand for industrial fabrication with less environmental impact. Recycling plastics is dependent on the polymer type as the balance of cost, properties and performance must be advantageous. Thermoplastics such as polyamides (PA) commercially sold as Nylon are used in the manufacturing of many industrial products including automotive parts. Low density, wear and impact resistance, chemical resistance, and noise reduction are some of the properties that make nylon an attractive alternative to certain metals in automotive applications, specifically a transmission gear in this example. Thermoplastics are extruded and injection molded making them suitable for fabrication into many complex shapes as well as good candidates for recycling.
One opportunity to recycle is inherent in the injection molding process which can generate a large volume of scrap. This scrap material can be ground and mixed with virgin polymer and fed back into the extruder. There is a need to evaluate the structure and properties of the parts produced using this recycled material to ensure there is no significant performance degradation. In this note, the thermal properties of nylon gears with increasing mass fractions of recycled material are evaluated.
Experimental
Samples
Gears were injection molded from a blend of high molecular weight polyamide 6,6 (95%) and polyamide 6 (5%). The samples tested are listed in Table 1.
Table 1. PA 6,6 samples analyzed
| Sample | %Recycle |
|---|---|
| Pellets | 0 |
| 0% Gear | 0 |
| 10% Gear | 10 |
| 20% Gear | 20 |
| 36% Gear | 36 |
| 100% Gear | 100 |
| 100% Recycled Pellets | 100 |
Instrument Experimental Parameters
TGA experiments were run using a TA Instruments Discovery 5500 TGA with conditions shown in Table 2. DSC and MDSC experiments were run on a TA Instruments Discovery 2500 DSC. Experimental parameters for the DSC and MDSC experiments are shown in Table 3 and Table 4.
Table 2. Discovery 5500 experimental parameters
| Instrument | TA Instruments Discovery 5500 |
|---|---|
| Purge Gas | N2 |
| Pan | 100 microliter Pt |
| Heating Rate | 10 °C / min |
| Temperature Range | Ambient to 1000 °C |
| Sample Mass | 5 mg nominal |
Table 3. Discovery 2500 experimental parameters
| Instrument | TA Instruments Discovery 2500® |
|---|---|
| Purge Gas | N2 |
| Pan | Tzero® Aluminum |
| Heating Rate | 10 °C / min |
| Temperature Range | -50 to 320 °C |
| Sample Mass | 5 mg nominal |
Table 4. MDSC experimental parameters
| Modulation period | 60 s |
| Amplitude | ± 1 °C |
| Heating Rate | 3 °C / min |
| Sample mass | 5 mg nominal |
For both the TGA and DSC experiments, samples were cut from the gears and not subjected to any further thermal history before analysis. Care was taken in the TGA experiment to cut parts to approximately the same size. For the DSC experiment, samples were cut to maximize contact with the bottom of the pan. Samples were heated to approximately 50 °C above the equilibrium melting temperature to ensure that process thermal history was destroyed. Calibration with known standards was carried out on the DSC and TGA.
Results and Discussion
TGA
Mass loss and derivative with respect to temperature curves are shown in Figure 1. An expanded view of the derivative of mass loss with respect to time is shown in Figure 2. Both 0% pellet and gear are most stable and 100% gear and pellet least stable. Using the temperature where maximum mass loss occurs as a measure of thermal stability (Table 5 and Figure 3), there appears to be a minor correlation between added recycled material and stability with a sharp decline at 100% recycle. The function is not linear and indicates that a significant fraction of recycle can be added with minor effect on stability. Including additional recycle fractions of 60 and 75% would be better to fill in the curve.
Water content taken as initial mass loss < 200 °C is shown in Table 6. There is not an obvious correlation between absorption of water and added recycle, but this could be better determined in a sorption analysis experiment.
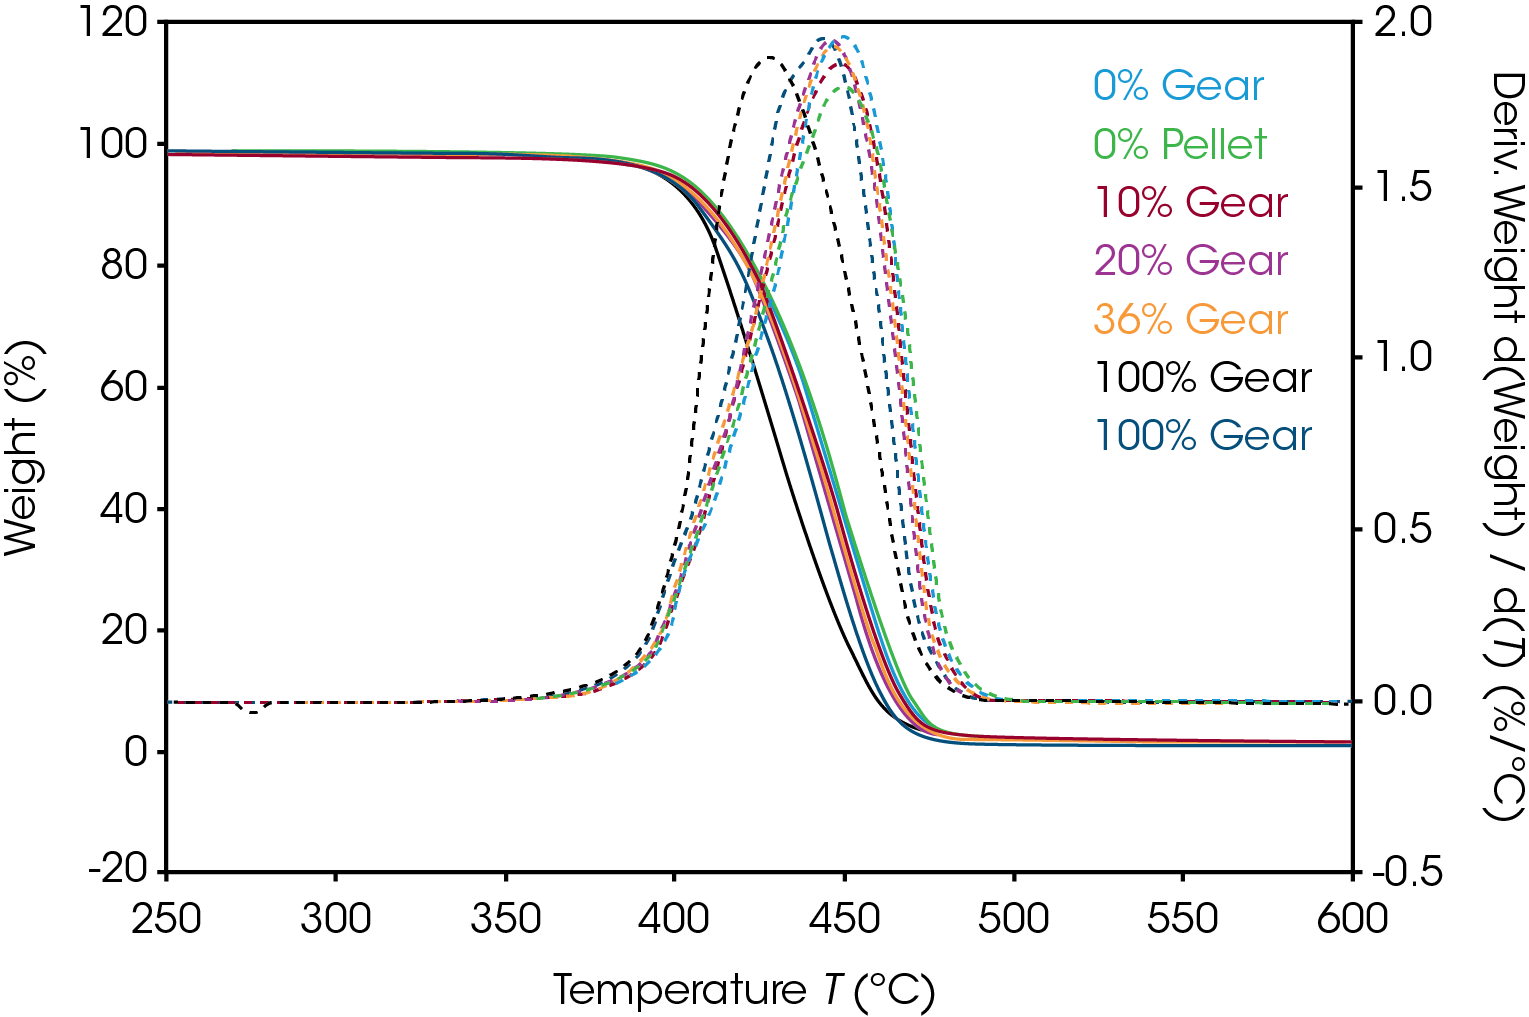
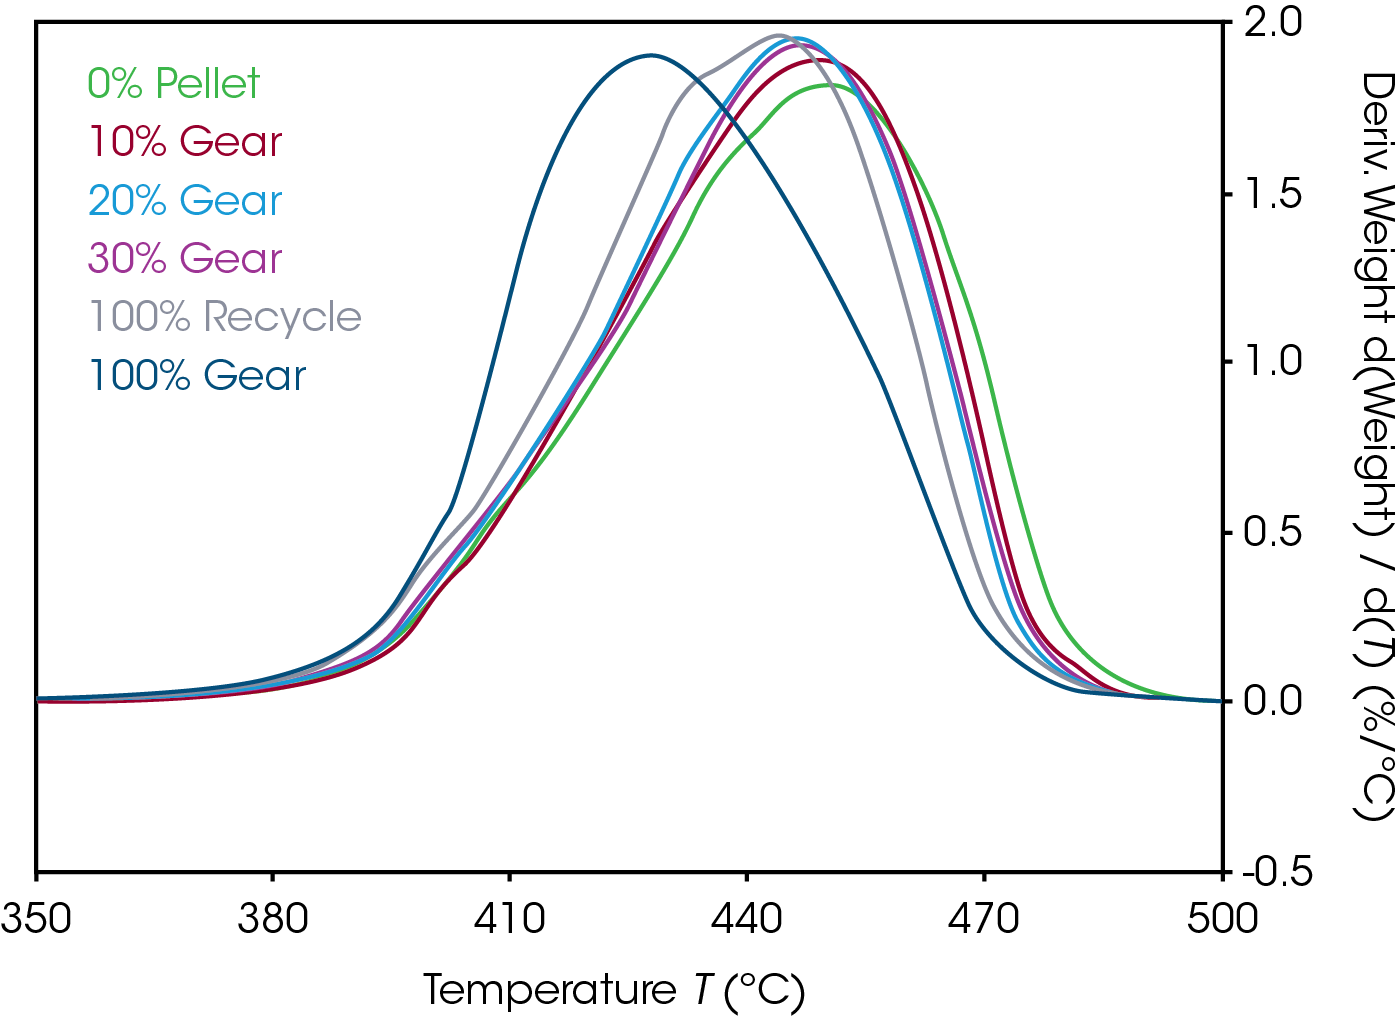
Table 5. Temperature at maximum decomposition rate
| Sample | Temperature at Maximum Decomposition Rate (°C) |
|---|---|
| 0% Gear | 449.3 |
| 0% Pellet | 449.2 |
| 10% Gear | 448.6 |
| 20% Gear | 446.2 |
| 36% Gear | 446.8 |
| 100% Gear | 427.8 |
| 100% Recycle | 434.4 / 444.1 |
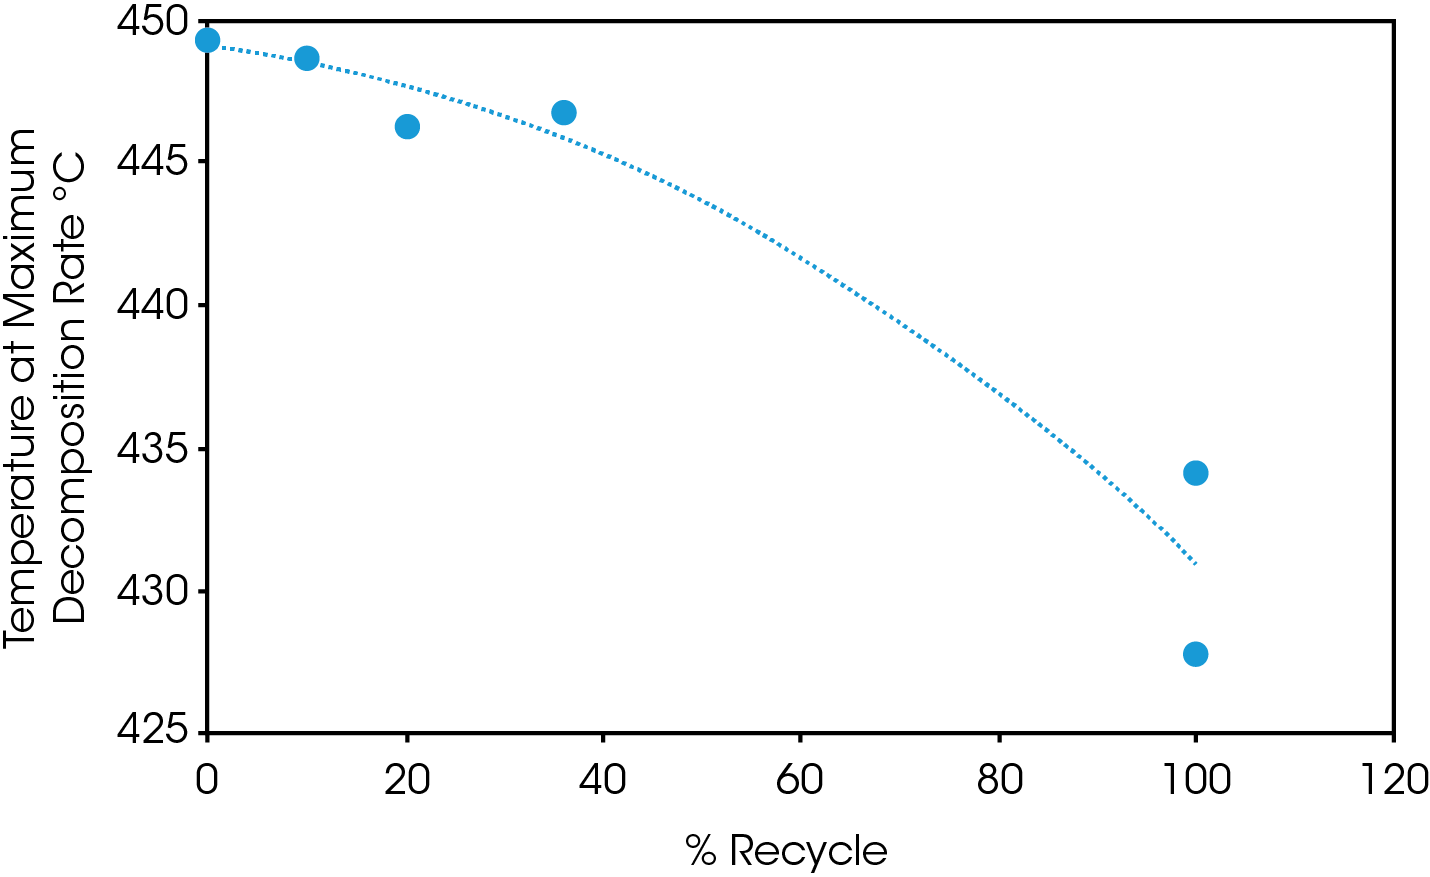
Table 6. % Mass loss of water
| Sample | % H2O |
|---|---|
| 0% Gear | 1.42 |
| 0% Pellet | 0.98 |
| 10% Gear | 1.69 |
| 20% Gear | 1.67 |
| 30% Gear | 1.55 |
| 100% Gear | 1.03 |
| 100% Recycle | 1.27 |
DSC
The 1st Heat (as received) results are shown in Figure 4 and Table 7. The lower TG’s are due to plasticizing effect of water in nylon. ΔCP at the glass transition is related to the amorphous phase content. The large relative standard deviation may be due to processing conditions as these are as received samples. Melting (TM ) temperatures and heats of fusion (ΔHF ) do not show an obvious correlation to the fraction of added recycle.
The endotherm at the TG is due to enthalpic recovery resulting from enthalpic relaxation of the amorphous phase. Enthalpic recovery appears to be significantly less in the 0% pellet and gear samples (Figure 5). This will be further evaluated using modulated DSC (MDSC).
Table 7. DSC 1st heat data of gear samples
| Sample | TG (°C) | ΔCp (J /g °C) | TM (°C) | ΔHF (J /g) |
|---|---|---|---|---|
| 0% Pellet | 31.8 | 0.272 | 259.9 | -84.29 |
| 0% Gear | 34.7 | 0.287 | 261.9 | -83.04 |
| 10% Gear | 34.3 | 0.433 | 261.7 | -66.82 |
| 20% Gear | 35.2 | 0.320 | 264.1 | -72.00 |
| 30% Gear | 37.1 | 0.129 | 261.1 | -73.24 |
| 100% Gear | 37.4 | 0.197 | 262.0 | -72.29 |
| 100% Pellet | 39.2 | 0.180 | 262.6 | -83.29 |
| RSD | 6.8% | 39.1% | 0.5% | 9.1% |
Results of the DSC cooling cycle are presented in Table 8 and Figure 6. After evolution of water in the first heat, the glass transition moves to a higher temperature. One obvious difference is the crystallization temperature of the 0% pellet. Plotting the derivative of the heat flow curve with respect to temperature (Figure 7) shows the difference in crystallization compared to the other samples. There is also an indication that the 20% gear sample shows different crystallization from the other samples. Both DSC experiments were repeated for these samples. The 0% pellet result is reproducible (Figure 8) and the 20% gear sample is not with the repeat experiment being more consistent with the other gear samples (Figure 9). Figure 10 shows a comparison of the heat flow and derivative with respect to temperature of the 0% pellet and gear. It is apparent that extrusion and the injection molding process mitigates crystallization differences that may be imparted to the pellets during pelletizing. Plotting the derivative of the heat flow curve with respect to either time or temperature is a fast way of determining the significance of differences in heat flow during crystallization and potential need for further investigation into crystallization kinetics.
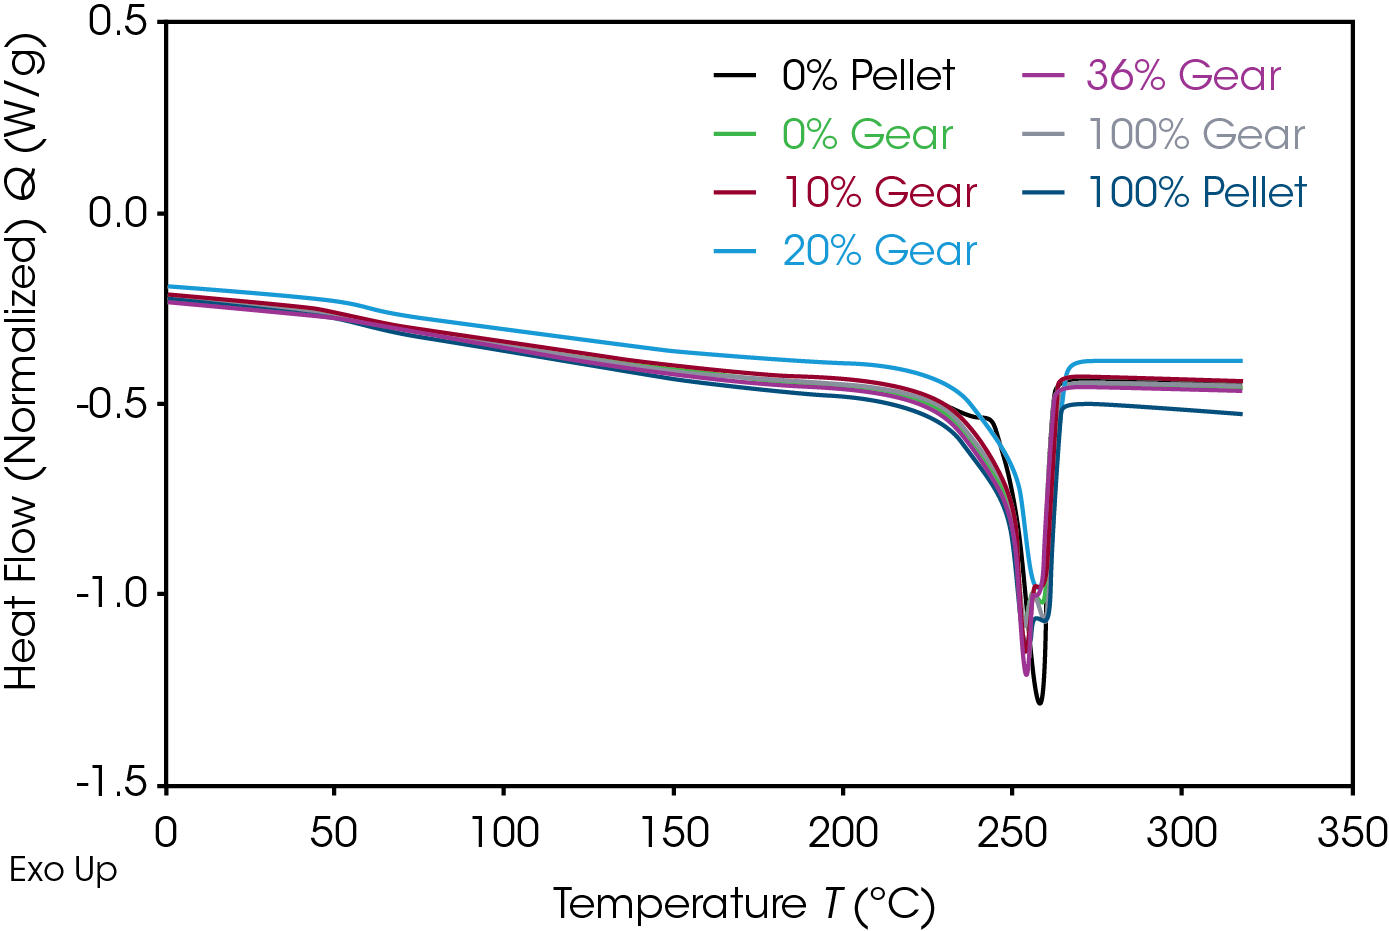
The DSC 2nd heat data is summarized in Table 9 and Figure 11. DSC data in the 2nd heat represents the inherent thermal properties of the samples. ΔCp in the 0% gear is lower than the other samples which appear to be consistent. The reduction in the RSD in the second heat indicates the amorphous phase content is consistent and the large differences in ΔCp observed in the first heat are due to processing effects. The values of TG, TM, and ΔHF , are consistent. Five of the samples show splitting of the melting transitions which is likely due to crystal perfection occurring during melting and can be confirmed by MDSC.
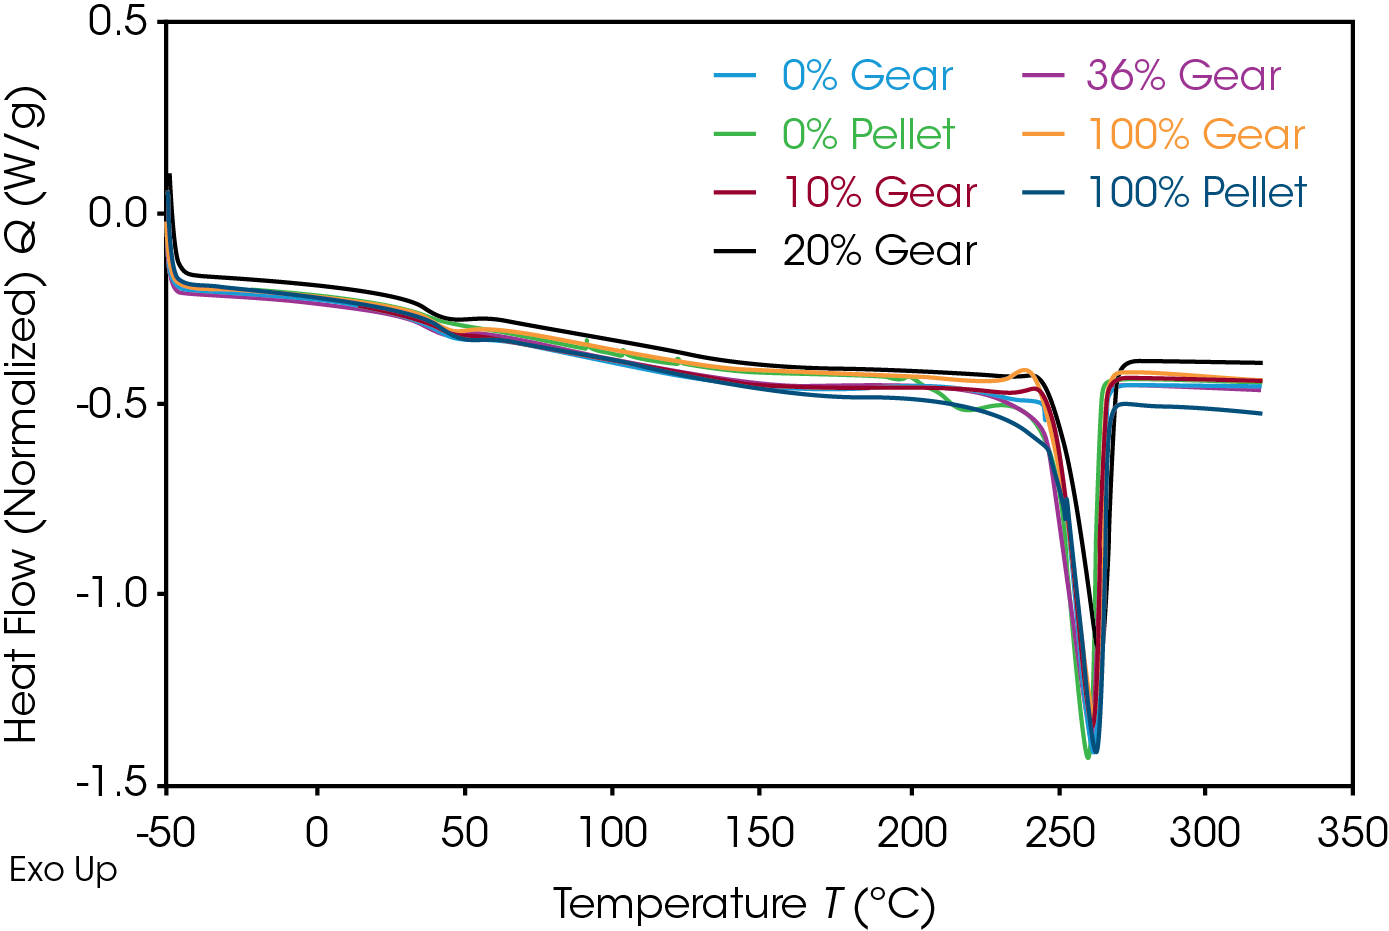
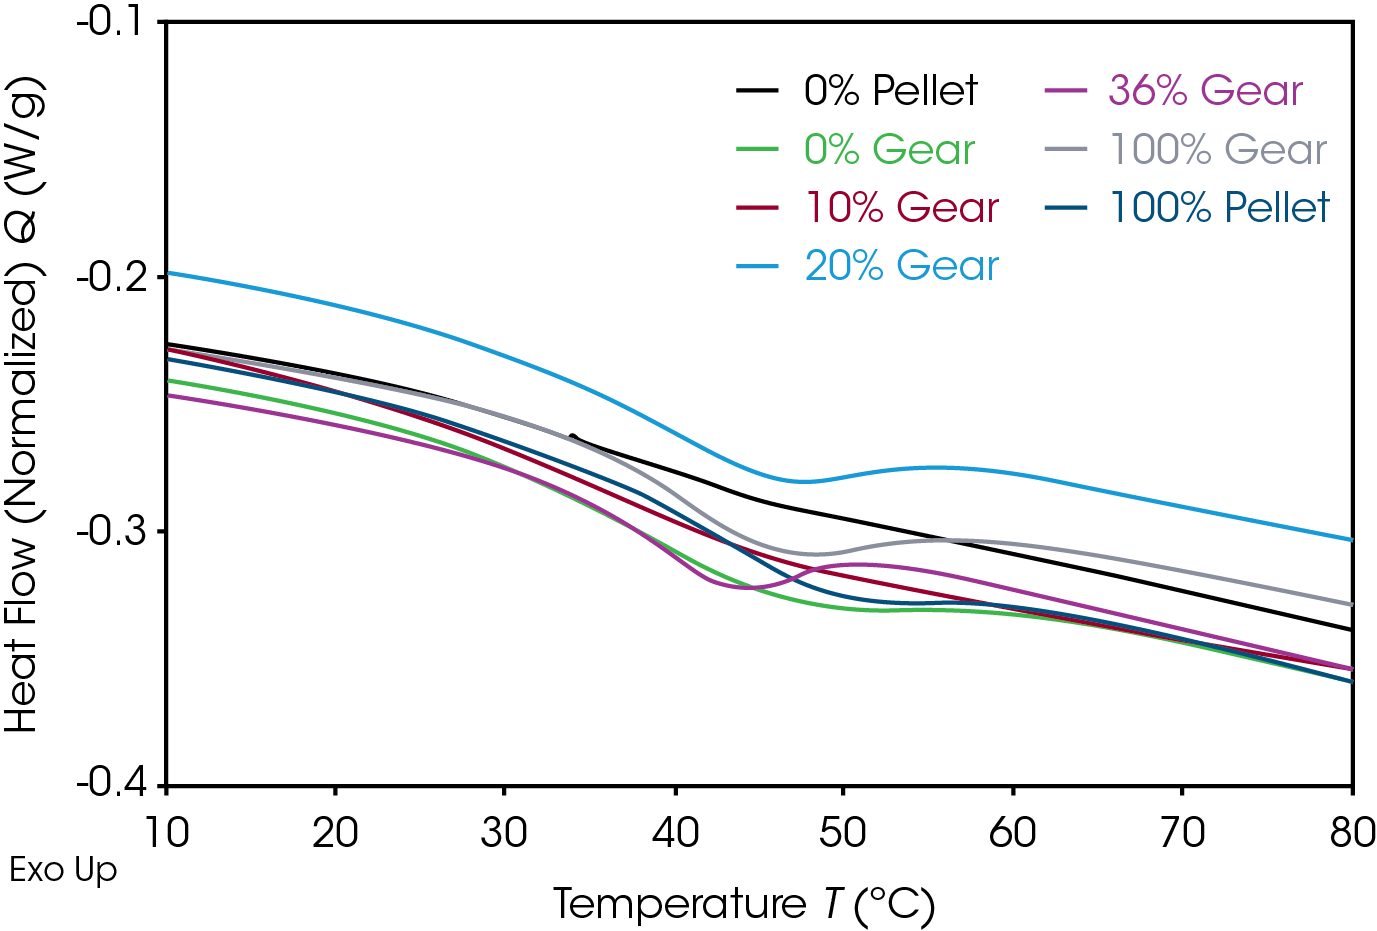
Table 8. DSC cooling data of gear samples
| Sample | TG (°C) | TC (°C) | ΔHC (J /g) |
|---|---|---|---|
| 0% Pellet | 55.1 | 206.4 | 74.93 |
| 0% Gear | 54.3 | 233.7 | 80.83 |
| 10% Gear | 54.0 | 234.0 | 81.88 |
| 20% Gear | 52.7 | 232.1 | 85.48 |
| 36% Gear | 54.1 | 233.8 | 90.28 |
| 100% Gear | 54.8 | 234.0 | 85.39 |
| 100% Recycle | 55.4 | 233.5 | 89.73 |
| RSD (%) | 1.6% | 4.5% | 6.4% |
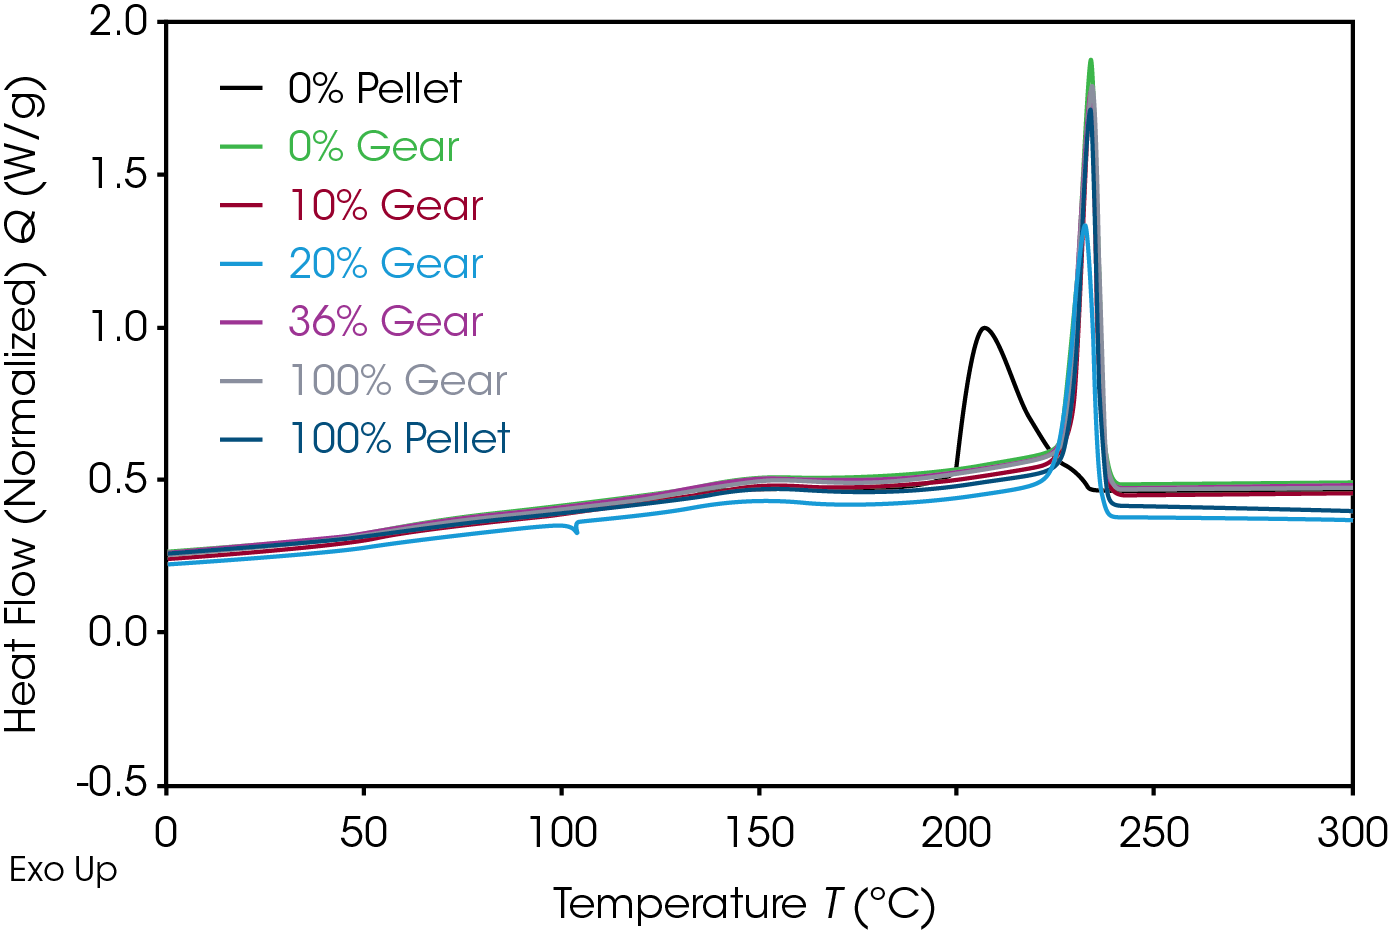
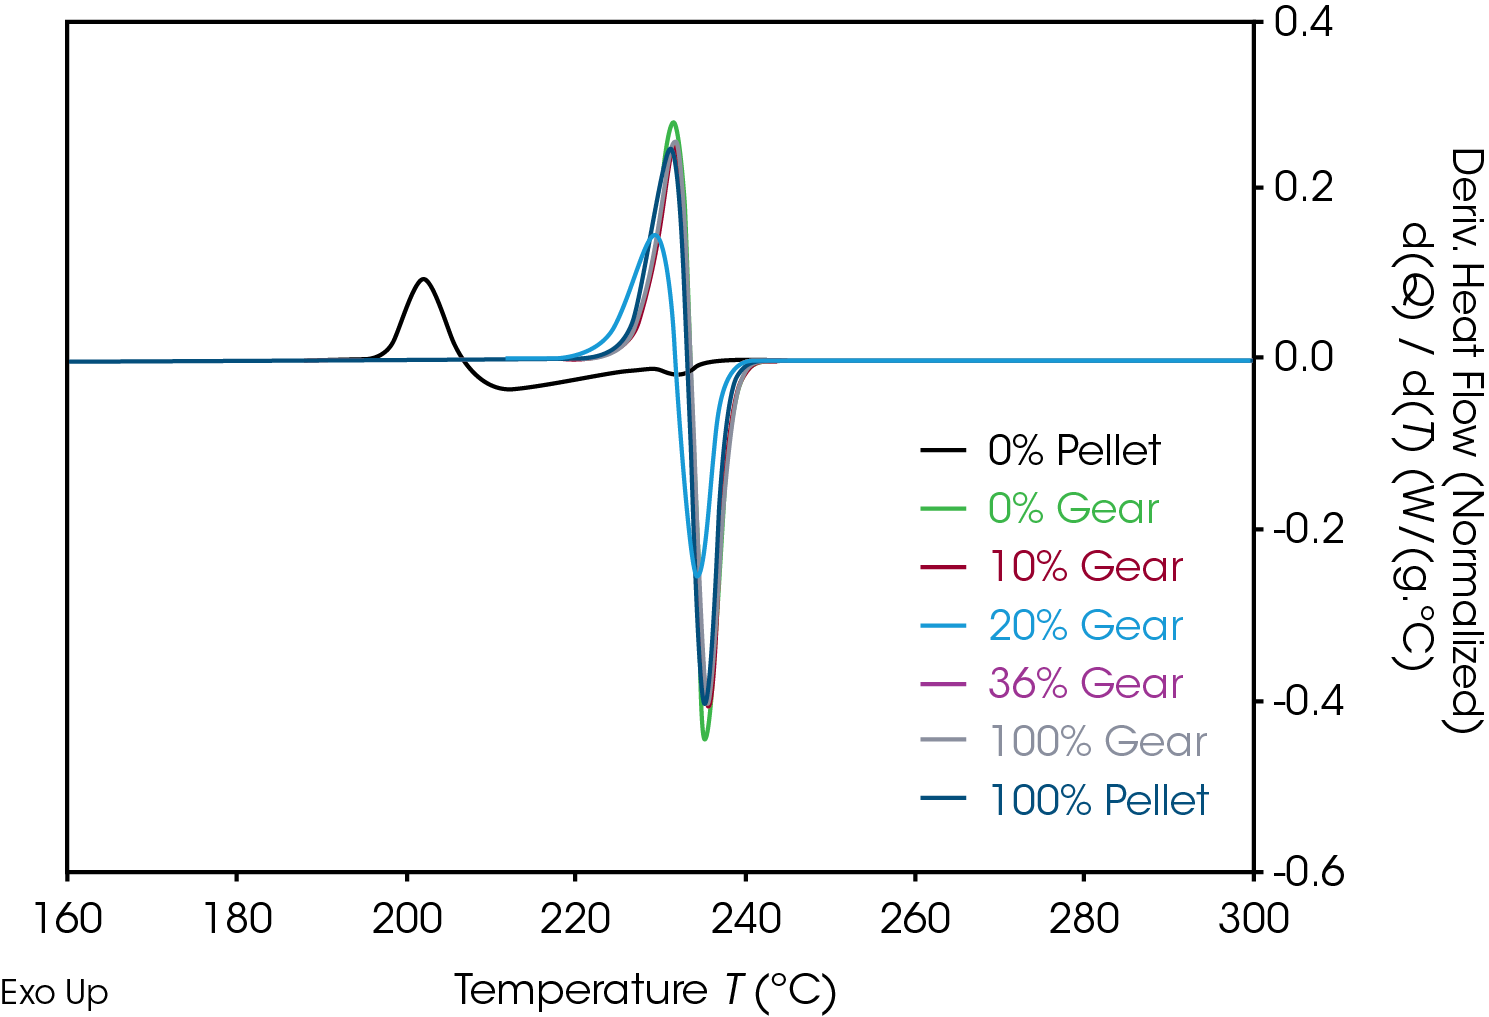
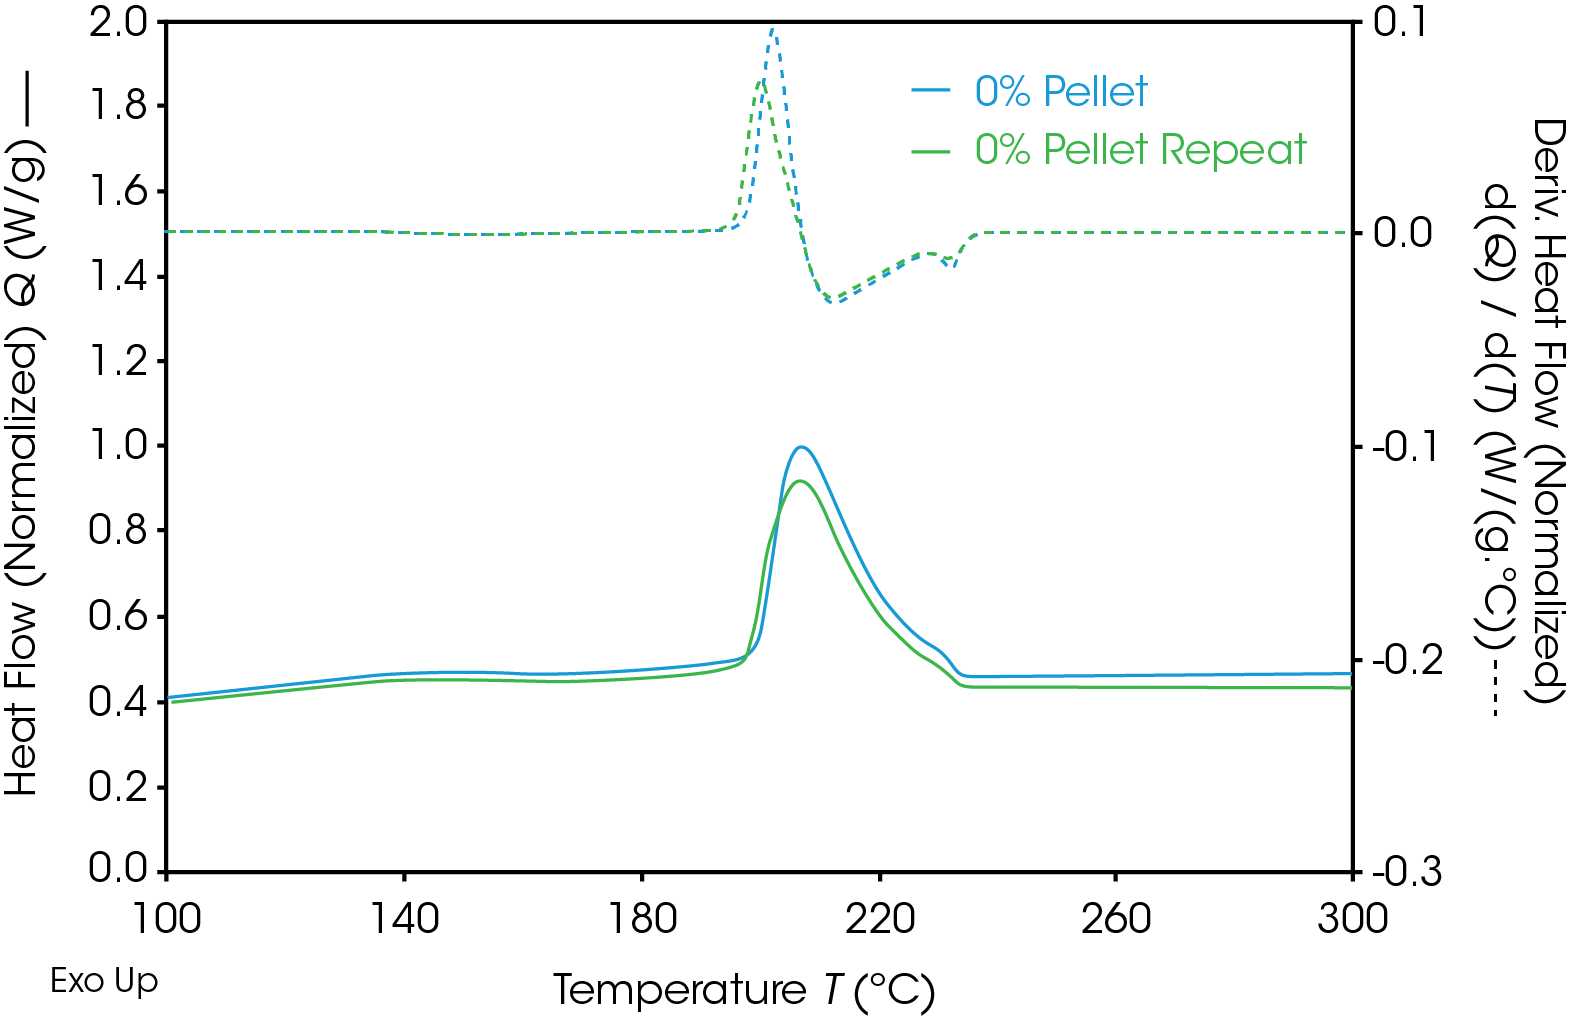
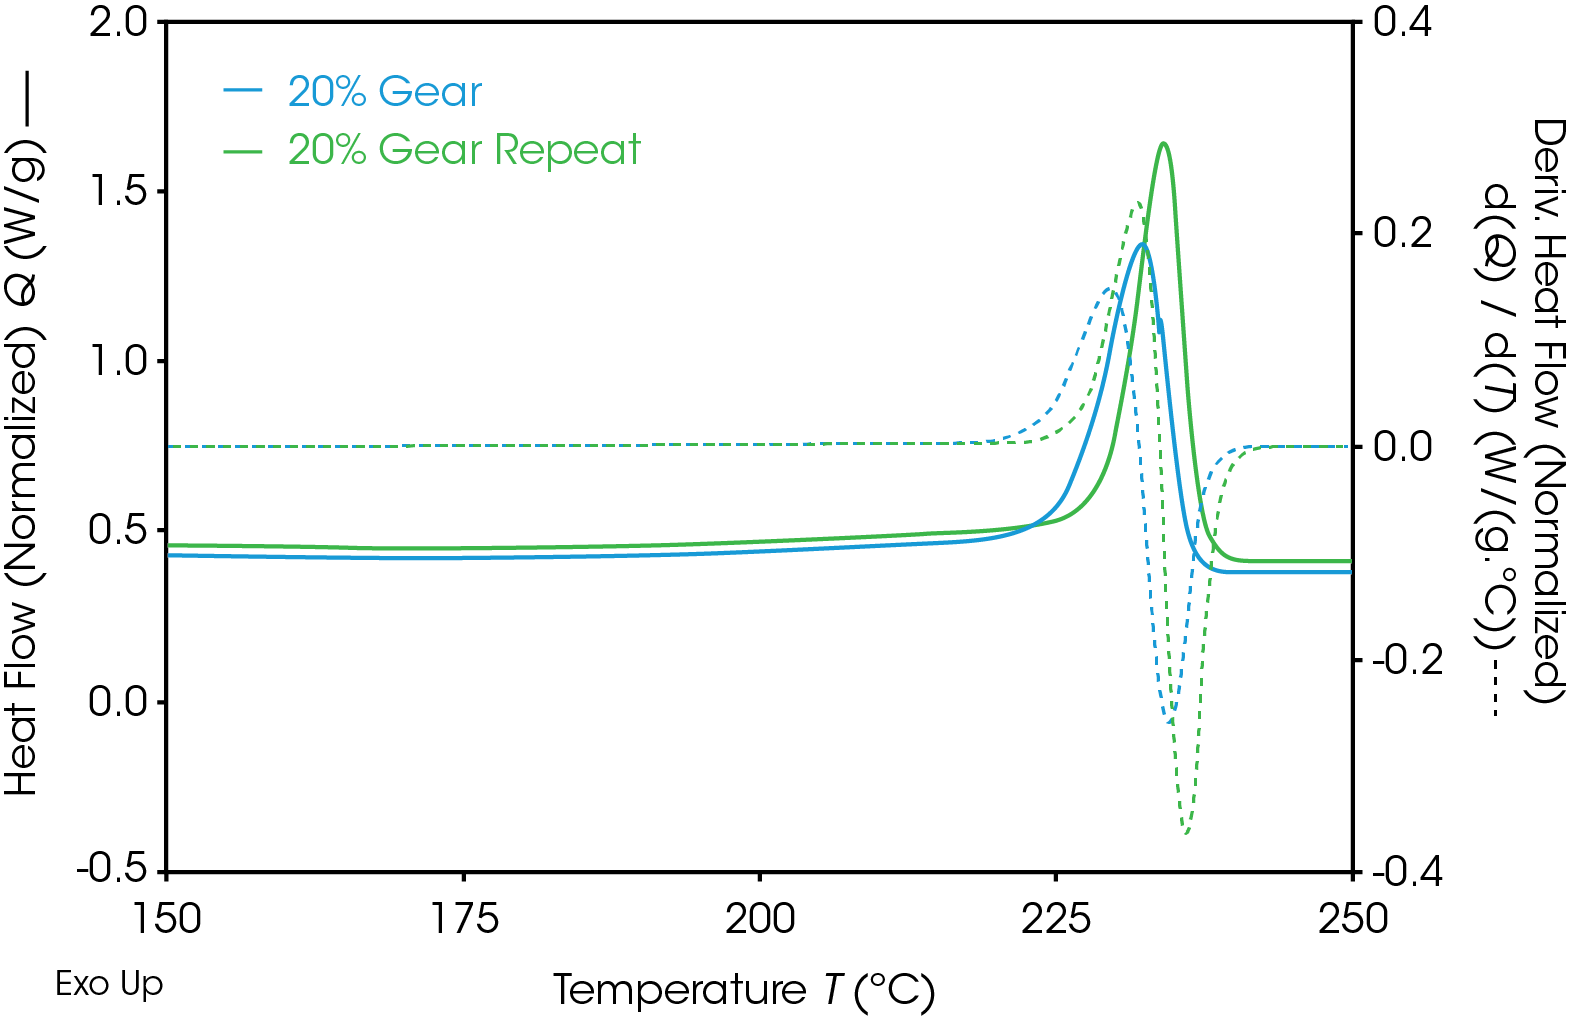
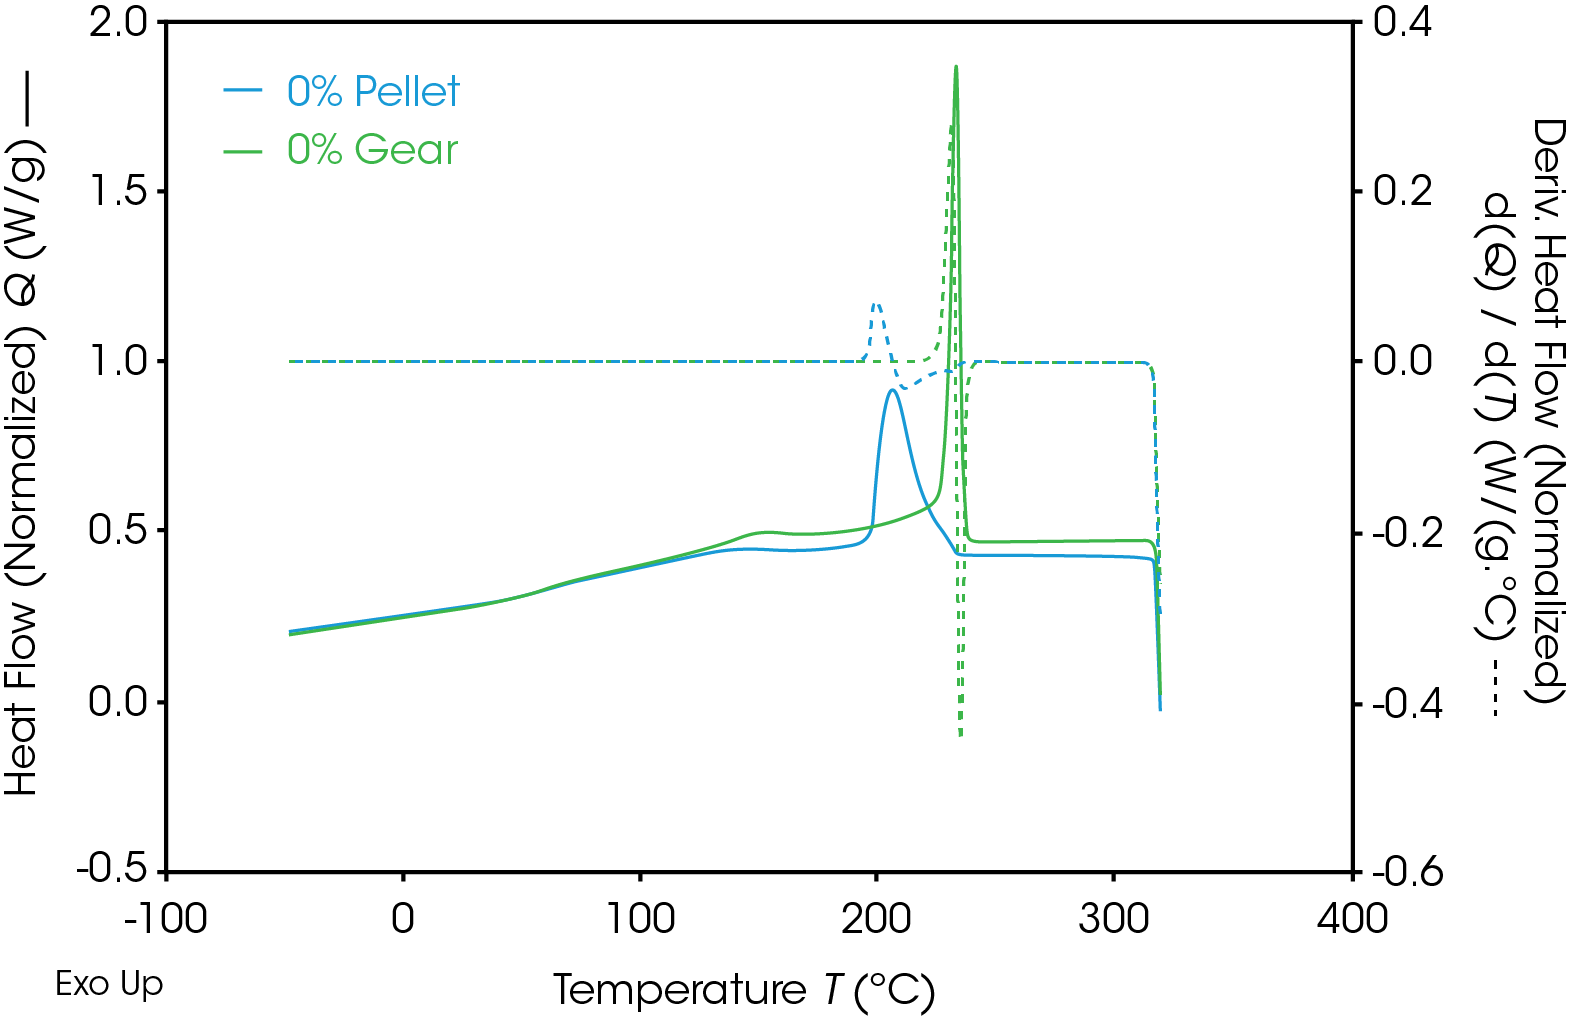
Table 9. DSC 2nd heat data for gear samples
| Sample | TG (°C) | ΔCp (J /g °C) | TM (°C) | ΔHF (J /g) |
|---|---|---|---|---|
| 0% Pellet | 59.3 | 0.263 | 258.1 | -81.40 |
| 0% Gear | 56.4 | 0.196 | 253.8 / 259.3 | -96.89 |
| 10% Gear | 58.2 | 0.264 | 251.4 / 258.7 | -91.20 |
| 20% Gear | 59.2 | 0.246 | 257.3 | -88.41 |
| 30% Gear | 58.9 | 0.277 | 254.1 / 258.04 | -86.98 |
| 100% Gear | 59.0 | 0.265 | 253.6 / 259.8 | -99.02 |
| 100% Pellet | 58.2 | 0.252 | 254.3 / 259.3 | -85.98 |
| RSD | 1.7% | 10.5% | 0.3% | 6.9% |
MDSC
Enthalpic relaxation in a polymer occurs as the amorphous phase quenched from the melt to a higher energy, non-equilibrium solid state relaxes to an equilibrium state in a process known as enthalpic relaxation or physical aging of the polymer [1]. Physical and mechanical properties change as this aging process occurs including increased brittleness, reduced elongation to break, increased yield stress, increased tensile modulus, and reduced fracture toughness [2]. In the DSC experiment, evidence of enthalpic relaxation is detected as an endotherm at the glass transition and is known as enthalpic recovery. The effect on physical and mechanical properties makes enthalpic relaxation an important phenomenon to evaluate.
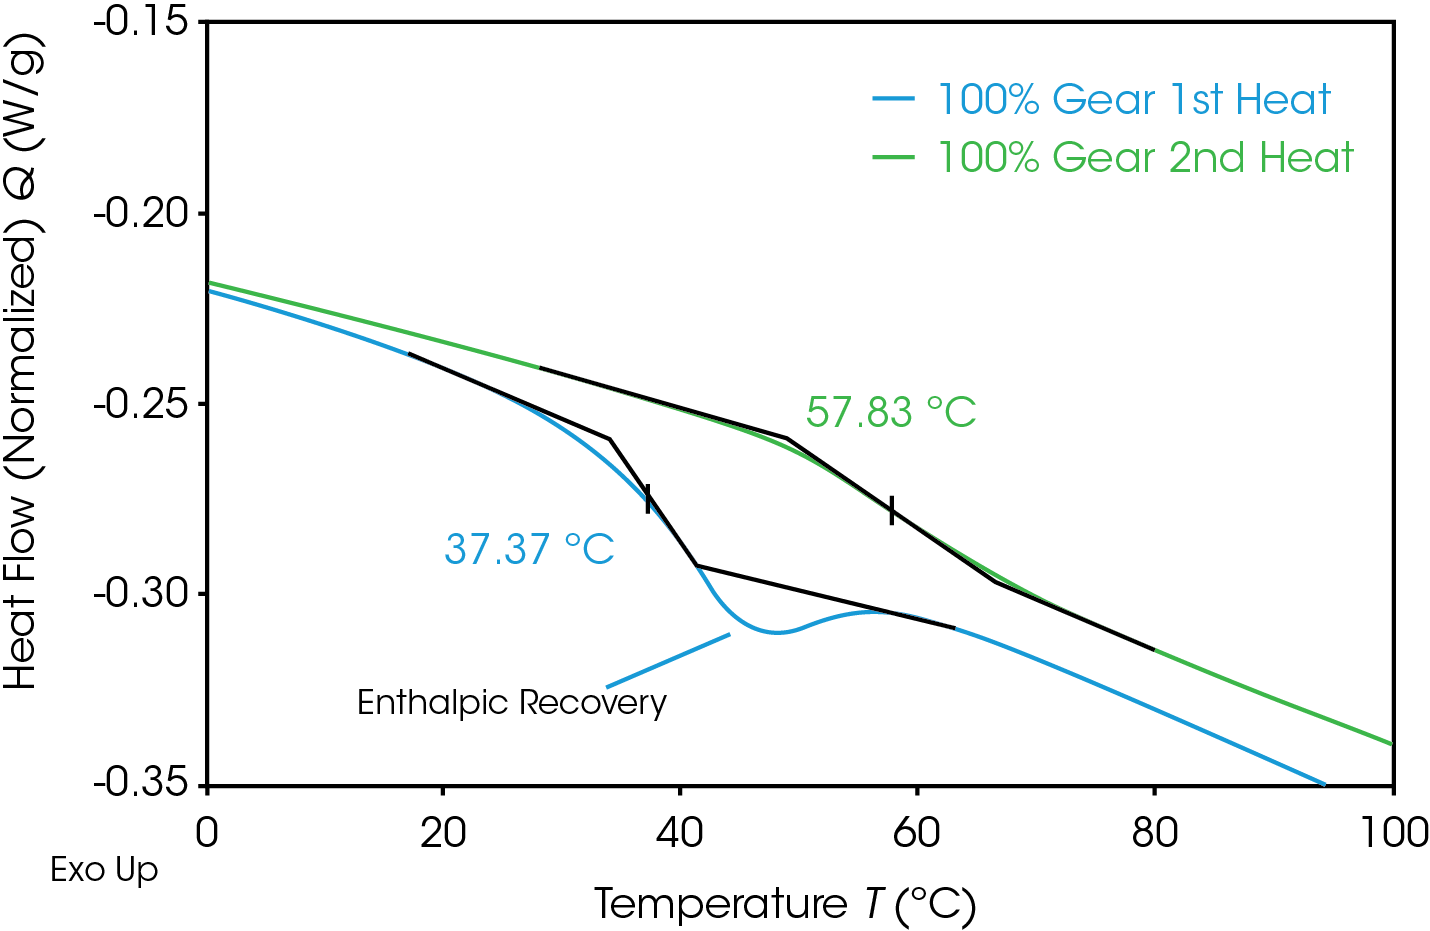
The glass transition is observed as a step-change in the heat capacity. Figure 12 compares the glass transition in the 1st and 2nd heats of the 100% gear sample. The first heat (blue) shows the step change with a significant endotherm superimposed contrasted with the second heat (green) which shows only a step change. The lower glass transition temperature in the first heat is due to the plasticizing effect of water.
Quantifying the energy associated with enthalpic relaxation can be done utilizing MDSC which effectively separates thermodynamic or heat capacity events from time and temperature dependent or kinetic events. The glass transition is found in the reversing heat flow signal, the enthalpic recovery is an endotherm in the non-reversing signal and can be integrated. Figure 13 shows the results of the MDSC experiment for the 100% pellet sample. The reversing heat flow (blue) shows the isolated glass transition, the non-reversing heat flow (red) shows the isolated enthalpic recovery endotherm. The total heat flow (green) is a summation of reversing and non-reversing heat flows.
The MDSC experiment introduces a “frequency effect” which causes the glass transition to shift to a slightly higher temperature and introduces an endothermic peak in the non-reversing heat flow signal. Correcting for the endothermic peak is done by cooling the sample down quickly to the experiment starting temperature and repeating the modulated experiment using the same conditions. The frequency effect is constant so the associated integral in the second heat can be subtracted from the integral in the first heat. The results of the MDSC 1st and 2nd heats are shown in Figure 14 for the 100% gear sample. ΔH associated with enthalpic recovery is the result of subtraction of the 2nd heat integral from the 1st heat integral shown in Table 10 for each of the samples.
A detailed procedure and explanation of the theory for calculating enthalpic recovery energy can be found in Thomas’ application note referenced below [3].
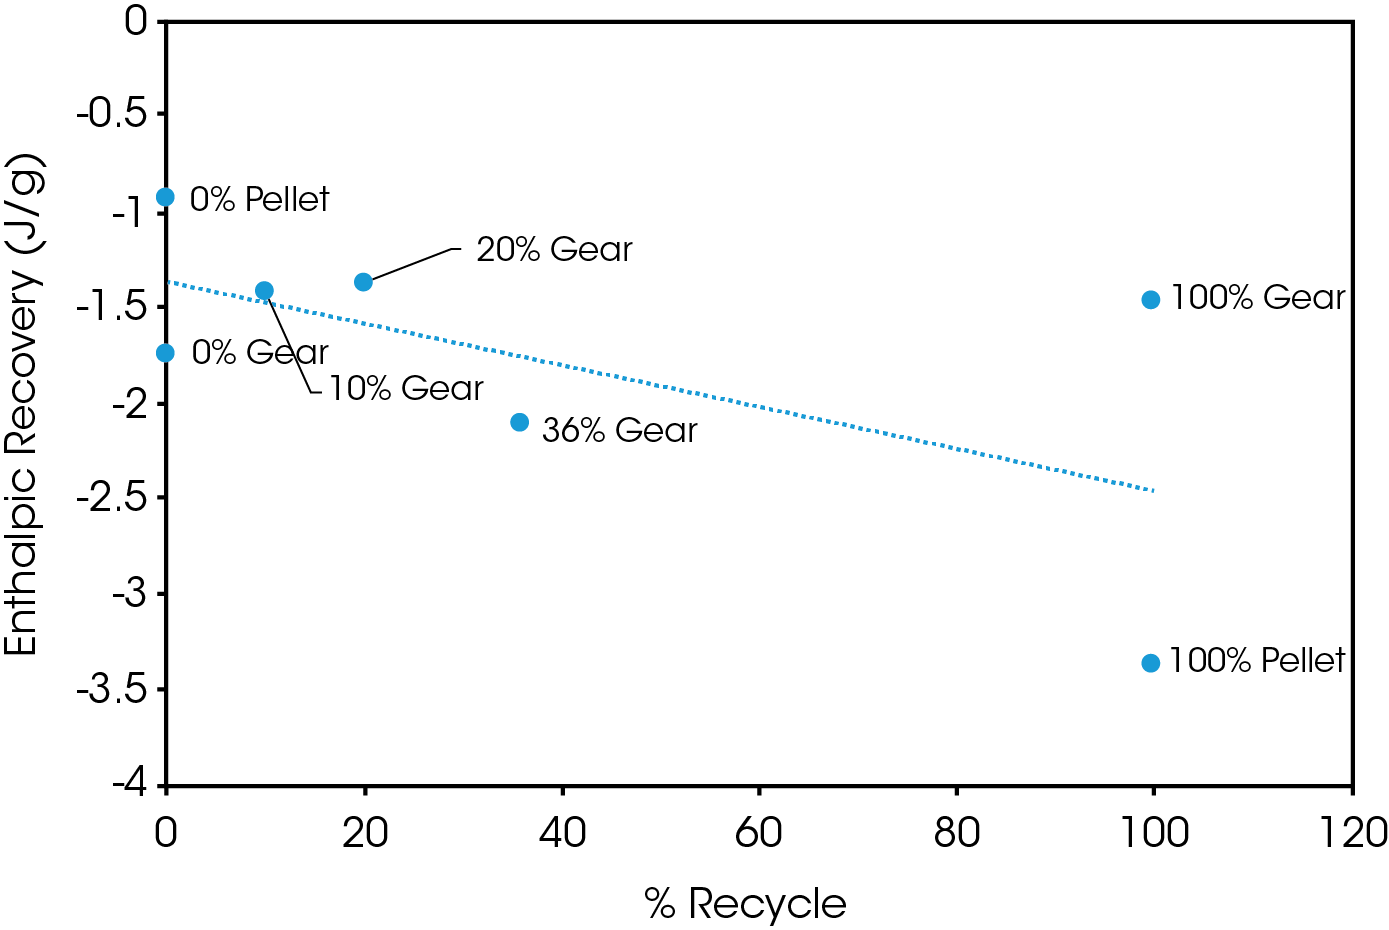
Figure 15 shows a plot of ΔH associated with enthalpic recovery as a function of percent added recycle. The general trend shows the enthalpic relaxation appears to increase with added recycled polymer. This should be thoroughly evaluated with a designed experiment that more precisely controls thermal history, aging time, and temperature. This will ensure that process history is not a contributing factor. This was not the scope of this experiment since as received molded parts were used.
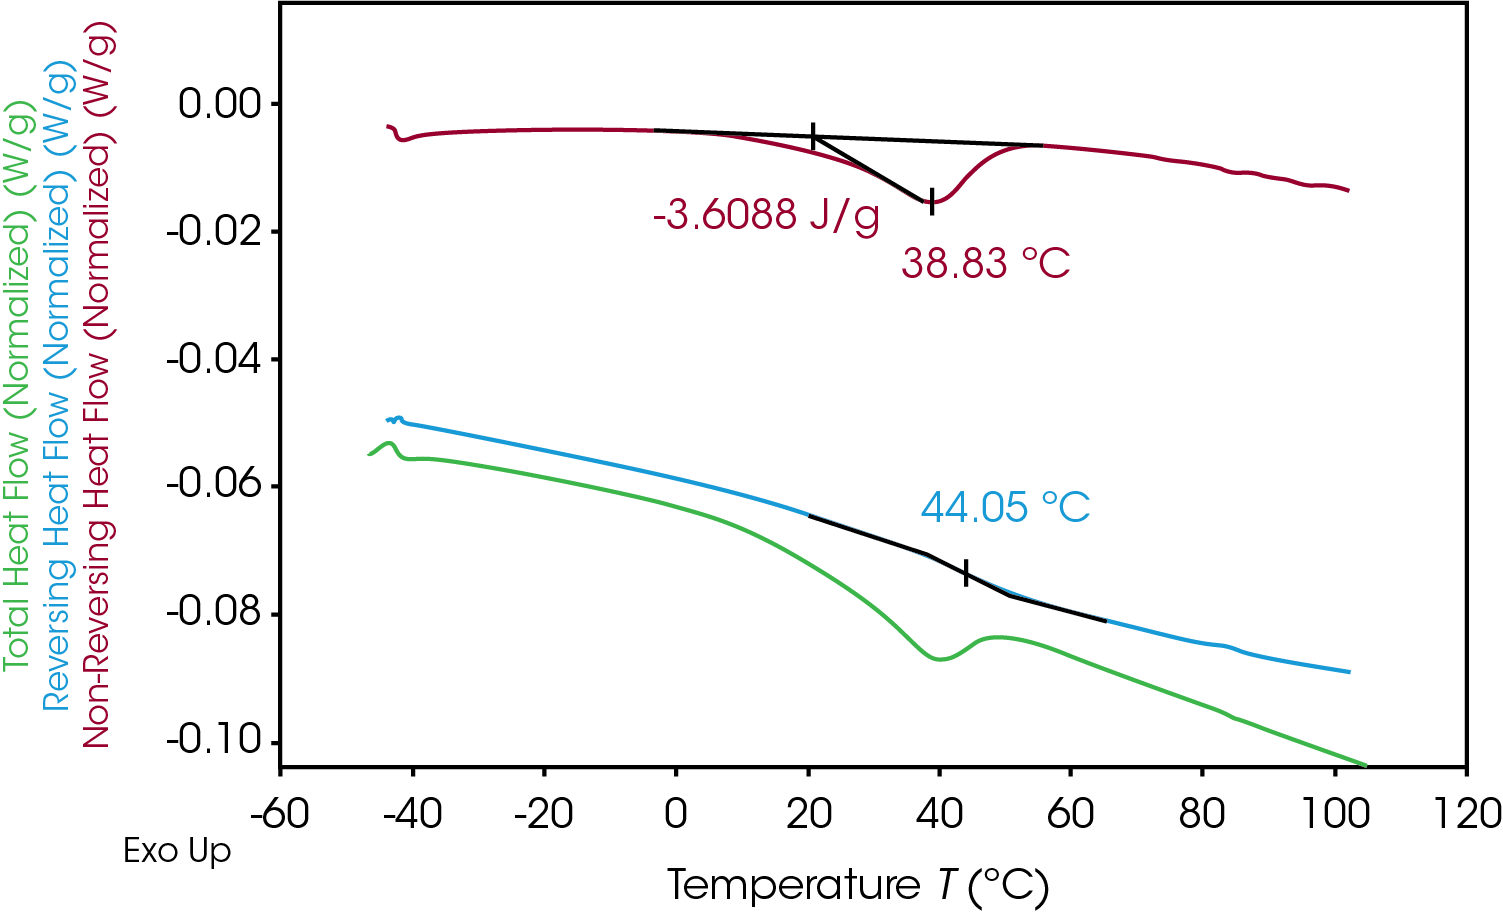
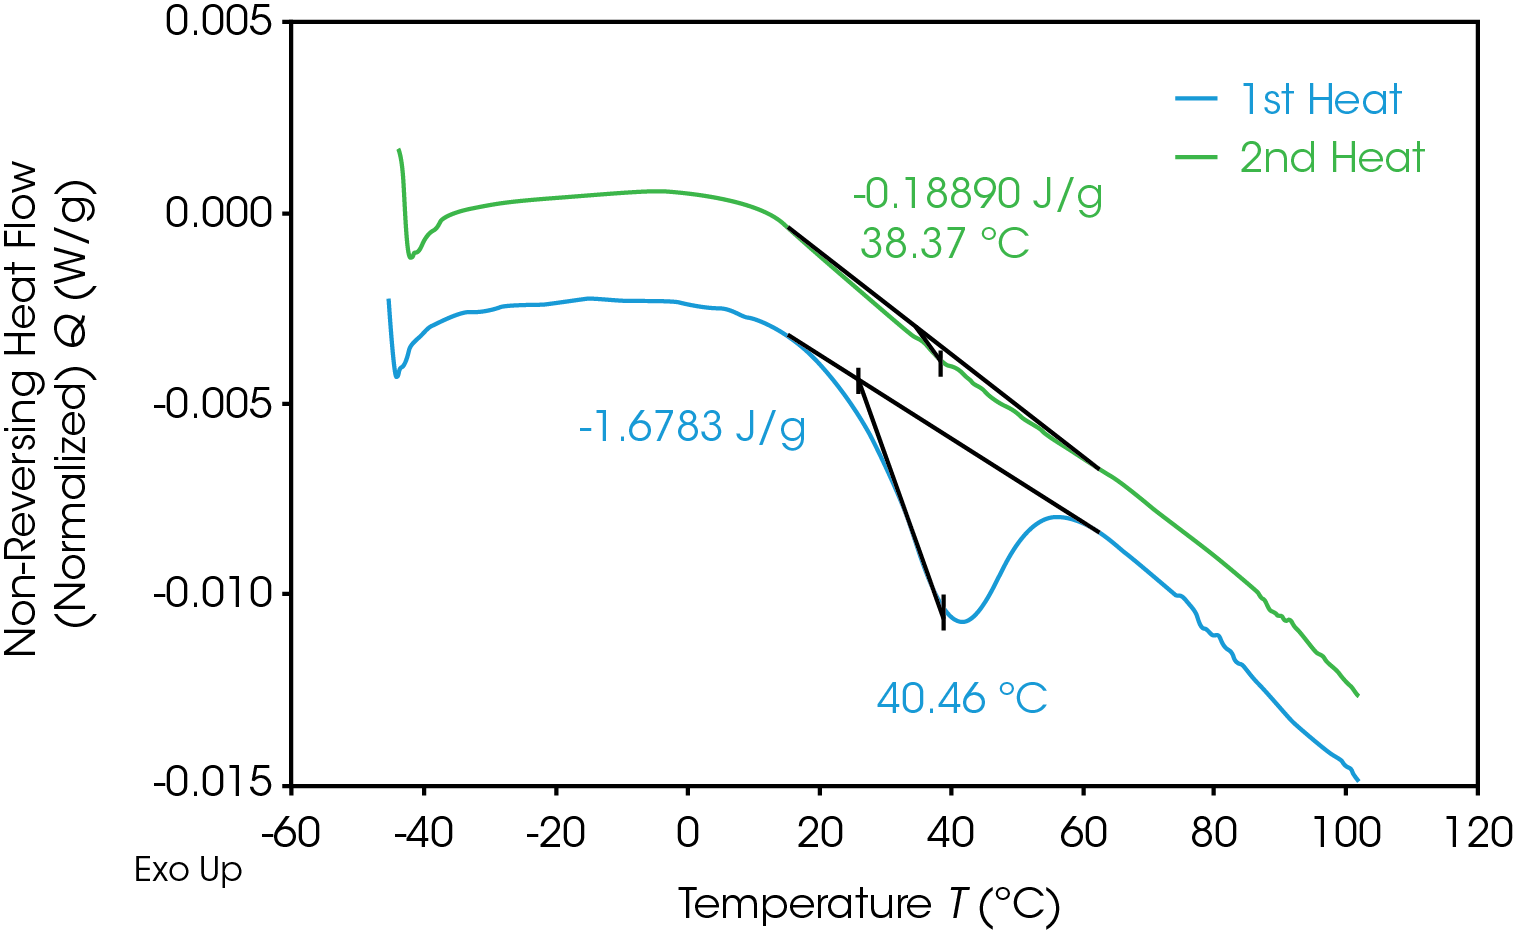
Table 10. Results of MDSC experiment for gear and pellet samples
| Sample | Integral 1st Heat (J/g) | Integral 2nd Heat (J/g) | ΔH Enthalpic Recovery (J/g) |
|---|---|---|---|
| 0% Pellet | -1.14 | -0.20 | -0.94 |
| 0% Gear | -2.49 | -0.74 | -1.75 |
| 10% Gear | -2.02 | -0.58 | -1.43 |
| 20% Gear | -1.60 | -0.21 | -1.39 |
| 36% Gear | -2.58 | -0.46 | -2.12 |
| 100% Gear | -1.68 | 0.189 | -1.49 |
| 100% Pellet | -3.61 | -0.24 | -3.37 |
Conclusions
Thermal analyses of plastics are highly effective methods of evaluating materials’ properties to assess their suitability for specific applications. DSC and TGA analysis of plastics containing recycle yield important information regarding stability and thermal properties some of which are correlated with physical properties and processing information.
Samples of gears with increasing percentages of recycled (regrind) polyamide 6,6 were evaluated using TGA and DSC. There is a slight reduction in thermal stability up to 36% recycle and significant reduction in thermal stability at 100% recycle.
Increasing levels of recycled material shows no obvious adverse effect on crystallinity or crystallization and consistent melting points and heats of fusion were observed in the second heat of the DSC experiment. The change in heat capacity at the glass transition varies significantly in the first heat but is more consistent in the second heat. ΔCP at TG is proportional to the amount of amorphous phase present and it can be concluded that the variation in ΔCP is due to processing effects. These results should be corroborated with physical properties testing including modulus, impact resistance, and toughness. The amount of enthalpic relaxation indicated by endothermic enthalpic recovery at the glass transition appears to increase with increasing levels of recycle and was quantified using MDSC.
References
- N. Bailey, “A Study of Enthalpic Relaxation of Poly(ethylene terephthalate) by Conventional and Modulated Temperature DSC,” Thermochimical Acta, Vols. 367-368, pp. 425-431, 2001.
- R. Surana, “Measurement of Enthalpic Relaxation by Differential Scanning Calorimetry,” Thermochimica Acta, vol. 433, pp. 173-182, 2005.
- Leonard Thomas, “Modulated DSC Paper #5 – Measurement of Glass Transitions and Enthalpic Recovery,” TA Instruments, New Castle.
Acknowledgement
This paper was written by James Browne, Senior Scientist at TA Instruments.
Click here to download the printable version of this application note.

