Keywords: Polypropylene, isothermal kinetics, recycle, Avrami, Malkin, DSC
TA472
Abstract
This note demonstrates the utility of differential scanning calorimeter (DSC) measurements in evaluating the effects of an antagonistic interaction of two common additives that may be found in a mechanical recycle stream of polypropylene (PP).
DSC analyses on samples of polypropylene containing the nucleator sodium benzoate (NaBz), a sample containing NaBz and calcium stearate (CaSt), and a reference PP sample were performed. CaSt is a known antagonist to the nucleation of PP containing NaBz. DSC analysis shows that for the NaBz / CaSt PP, a partial reduction in crystallization temperature (TC) is observed compared to the NaBz PP sample but is still higher than the PP reference crystallization temperature. Isothermal kinetics parameters using the Avrami and Malkin macrokinetic models showed rate constants k and C1 yielded results of PP< NaBz/CaSt PP< NaBz PP and half-times results of PP>NaBz/CaSt PP>NaBz PP. The Avrami geometric constant n and Malkin C0 were equivalent in the PP and NaBz/CaSt PP samples, and lower in the NaBz PP sample, showing that the added CaSt partially eradicates the action of the NaBz nucleator. The crystallization activation energy was equivalent in the PP and NaBz/CaSt PP samples and approximately 50 kJ / mol lower in the NaBz PP sample.
Introduction
The growing industry of recycled plastics and inherent heterogeneity of recycle streams will increase the need for analytical testing to ensure consistency and quality. Most plastics are designed for longevity and performance rather than recyclability and degradability, leading to a large accumulation of waste in landfills and oceans. Polypropylene (PP) accounts for a large share of manufactured plastics used in packaging, films, automotive parts, electrical parts, containers, and a variety of other products. In 2021, approximately 75 million metric tons of PP was produced [1] and approximately 1% was recycled [2]. Recycling is needed for mitigation of environmental impact as well as conservation of resources but mechanical recycling of PP has inherent challenges due to the variety of PP grades and additive formulations that are found in the recycle stream.
PP properties are achieved by catalytic control of molecular weight, molecular weight distribution, tacticity during polymerization, and copolymerization, as well as physical blending of impact modifiers, adding fillers, and specialty additives. This leads to numerous types and grades of PP with many different additive formulations that can include additives such as antioxidants, process aids, anti-acids, UV stabilizers, and nucleators. [3] An example is PP made using Ziegler-Natta polymerization, which produces hydrochloric acid (HCl) that must be neutralized to protect the polymer, additives, and processing equipment [3]. This neutralization is often done with a salt of a weaker acid, often calcium stearate (CaSt). Sodium benzoate (NaBz) is a common nucleating agent which causes formation of smaller and more numerous spherulites, resulting in increased modulus, higher crystallization temperature and faster cycle times [3]. CaSt is known to antagonistically react with NaBz diminishing the nucleating effect. For PP formulations using NaBz, a synthetic hydrotalcite is typically used as an acid scavenger. The interaction of these materials may impact processing temperature and DSC is a useful tool to identify these interactions by relating it to crystallization temperature. This application note uses DSC to compare the crystallization of PP, PP containing NaBz, and PP containing NaBz and CaSt to model what may be found in a PP recycle stream and potential effects on processing.
Experimental
Samples
The samples used in this study are shown in Table 1. All samples also contain an antioxidant formulation. Samples were made in ten pound lots using a single screw Killion 1.25” extruder. The extrusion temperature was 232 °C.
Table 1: PP sample
| Sample Name | Materials |
|---|---|
| PP | Reference PP containing CaSt |
| NaBz PP | PP containing NaBz with DHT4A anti-acid |
| NaBz/CaSt PP | PP containing NaBz and antagonist CaSt |
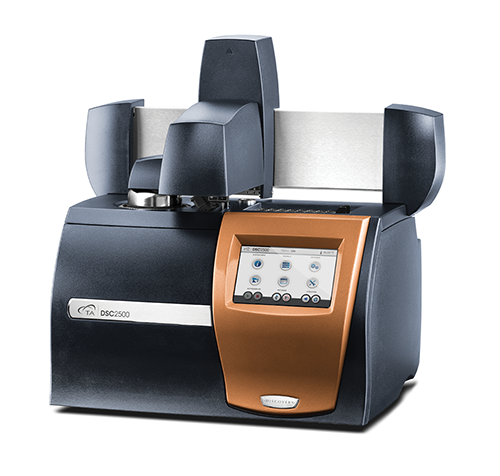
Differential scanning calorimetry experiments were carried out on TA Instruments™ Discovery™ DSC 2500 (Figure 1) using Tzero aluminum sample pans under nitrogen purge. Sample mass was 2 mg nominal, and a new sample was prepared for each run.
Samples were heated to 235 °C and held isothermally for five minutes to destroy the thermal history. To quickly understand the differences between samples, a simple heat-cool DSC experiment was run first. For this, the samples were cooled at 10 °C / min after being heated and held at 235 °C.
Isothermal kinetic experiments were done by cooling the samples to five different temperatures to obtain the crystallization exotherms. The Avrami microkinetic model (Equation 1) was used as the basis of analysis for the isothermal data. The data was reduced using the linear form of the Avrami equation (Equation 3) using X(t) ∈ [0.2, 0.8] and using the Avrami (Equation 1) and Malkin (Equation 2) macrokinetic models by fitting the data using X(t) ∈ [0.001, 0.999] [4] .
The Avrami macrokinetic model is most used to describe isothermal crystallization kinetics of semi-crystalline polymers.

Where:
- X(t) = fraction crystallized as a function of time
- k = Avrami Rate Constant (function of nucleation and crystal growth rate)
- n = Avrami Exponent (function of growth geometry)
- t = time
Rearrangement yields the linear form of the Avrami equation:

A plot of the log (-ln(1-X(t)) versus log t is linear and yields the Avrami parameters k and n. The linearized form generally fits the data well between the limits of X(t) = 0.2 to X(t) = 0.8. These limits can be modified as needed.
Malkin et. al. proposed a macrokinetic equation based on the principal that the overall crystallization rate is a summation of the variation in crystallinity due to the emergence of primary nuclei and the rate of variation in crystallinity due to crystal growth [5] [6] .

Where:
- X(t) = fraction crystallized as function of time.
- C0 = is proportional to the ratio of secondary nucleation (linear growth) rate to the primary nucleation rate or specifically C0 ∝G/I in Lauritzen and Hoffman terms.
- t = is directly related to the overall crystallization rate or C1 = aI + bG where a and b are constants [6] .
Calculations with The Avrami Equation
Crystallization half time (t1/2) can be calculated using Equation 4

Where t½ is the crystallization half time, n and k are the Avrami parameters.
Avrami parameters n and k can be calculated from the Malkin parameters C0 and C1 using Equations 5 and 6.

The crystallization activation energy (DE) can be determined by using the obtained rate data in the generalized Arrhenius equation (Equation 7):
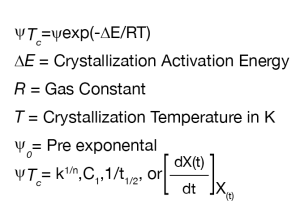
Where:
- k 1/n = Avrami rate constant,
- n = Avrami exponent
- C1 = Malkin Rate Constant
- t1/2 = crystallization half-time
- [dX(t)/dt]X(t) = instantaneous crystallization rate from the DSC data based on Friedman’s method [7]
Results and Discussion
DSC
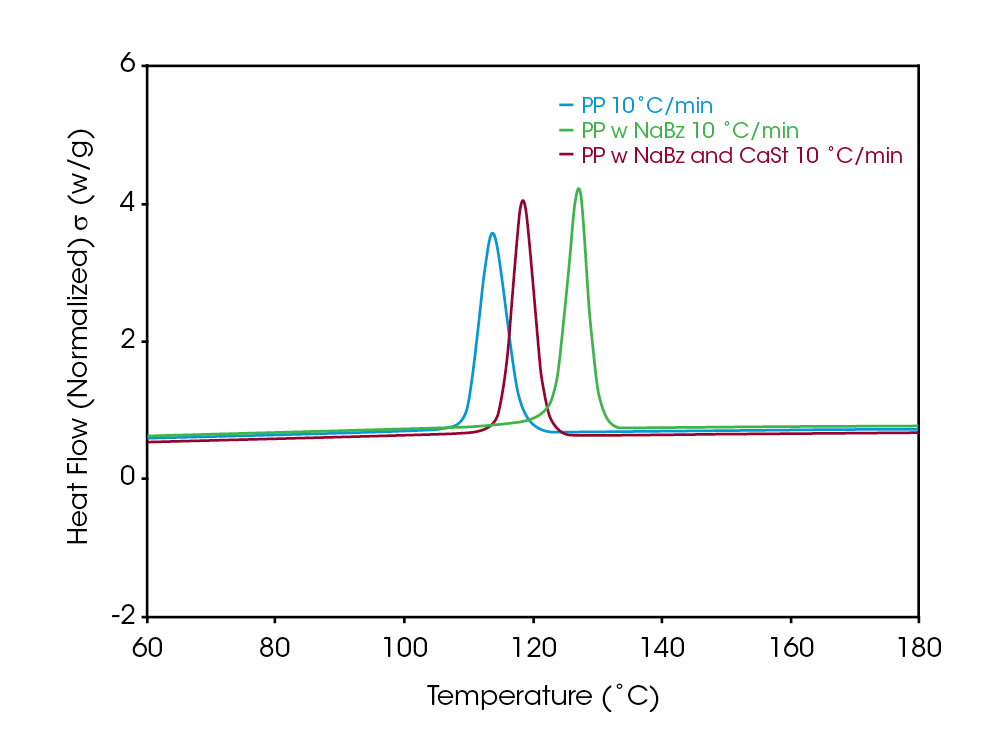
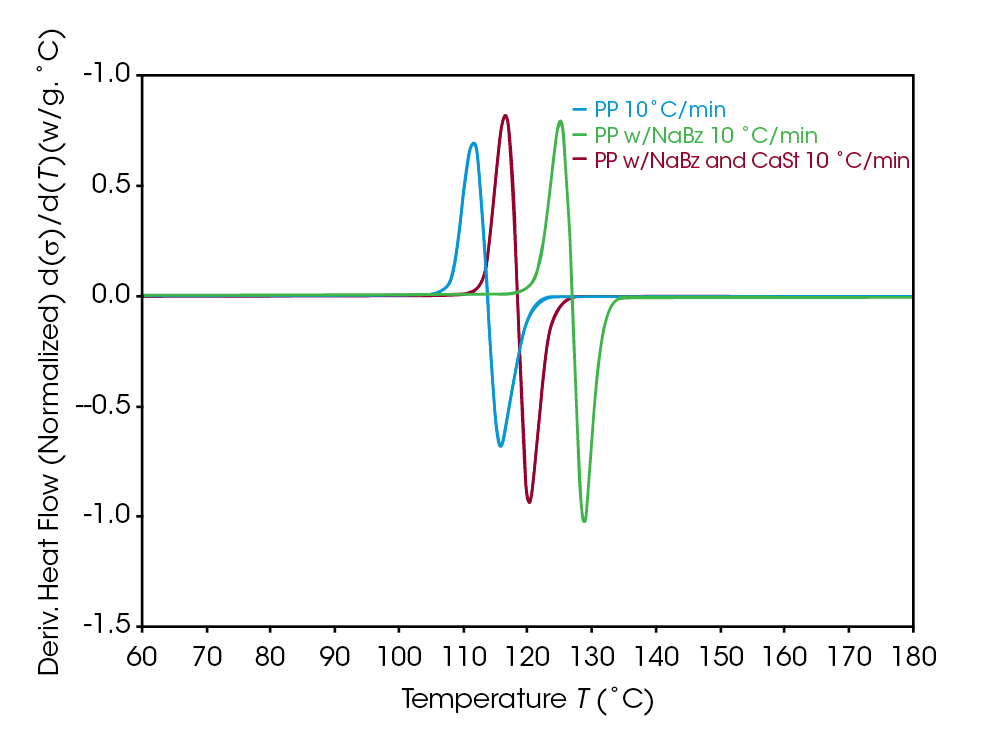
A simple DSC experiment is the first step in assessing differences in the samples. Figure 2 shows a comparison of the crystallization of the samples. The higher crystallization temperature is observed in sample NaBz PP (green), a reference PP (blue) crystallizes at a significantly lower temperature, while the sample NaBz/CaSt PP (red) crystallizes at an intermediate temperature. Plotting the derivative with respect to temperature shows the magnitude of the differences in heat flow rate between the samples (Figure 3). This simple experiment is often the only one needed to compare samples for potential differences that may correlate with potential processing issues.
Isothermal crystallization kinetics
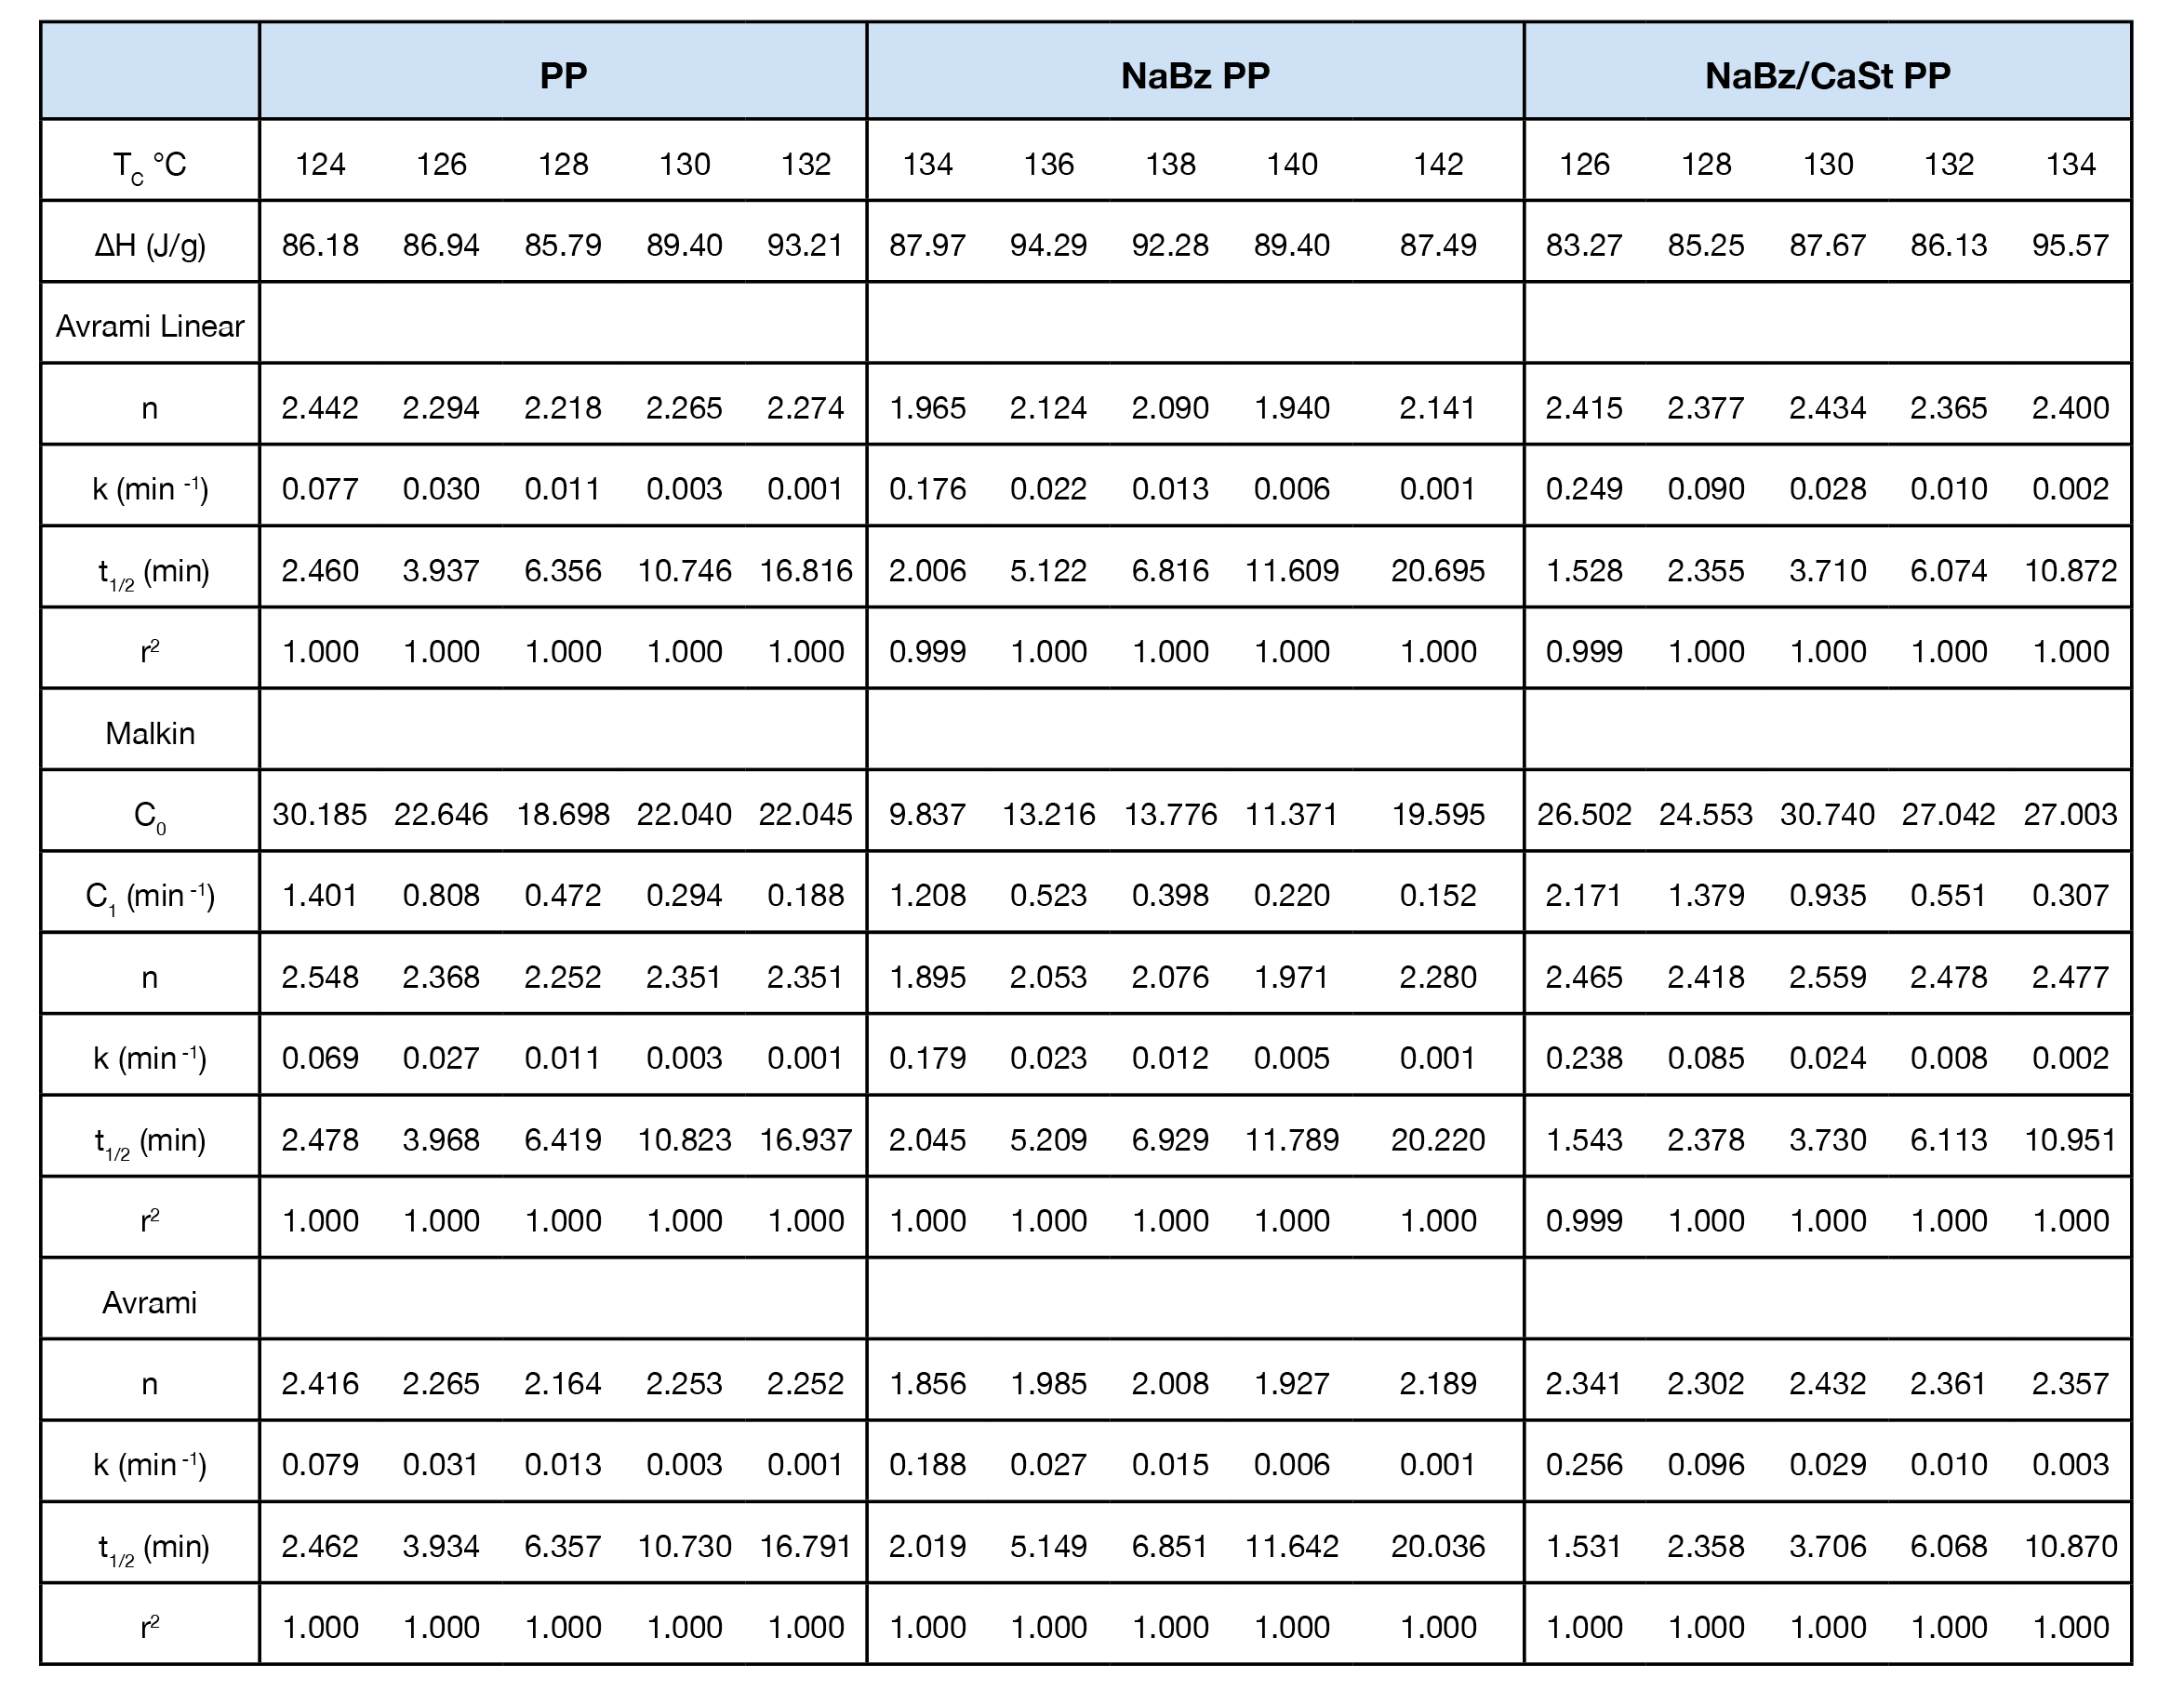
Isothermal kinetics data were fitted using the Avrami and Malkin equation as well as the linear form of the Avrami equation. The data is summarized in Table 2.
Crystallization exotherms for the samples are shown in Figures 4, 5, and 6. It is important to mention that half-times should be calculated using Equation 4 or using the instrument software to determine X(t) = 0.5. The exotherms are seldom symmetric, so that the peak time is unreliable and generally gives poor kinetics results.
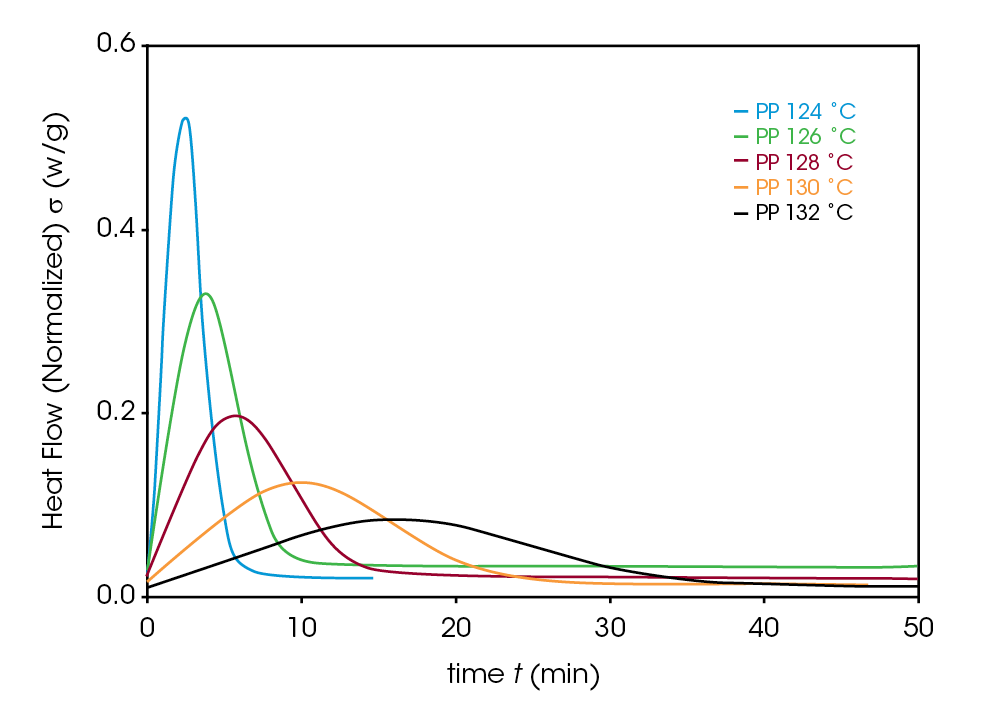
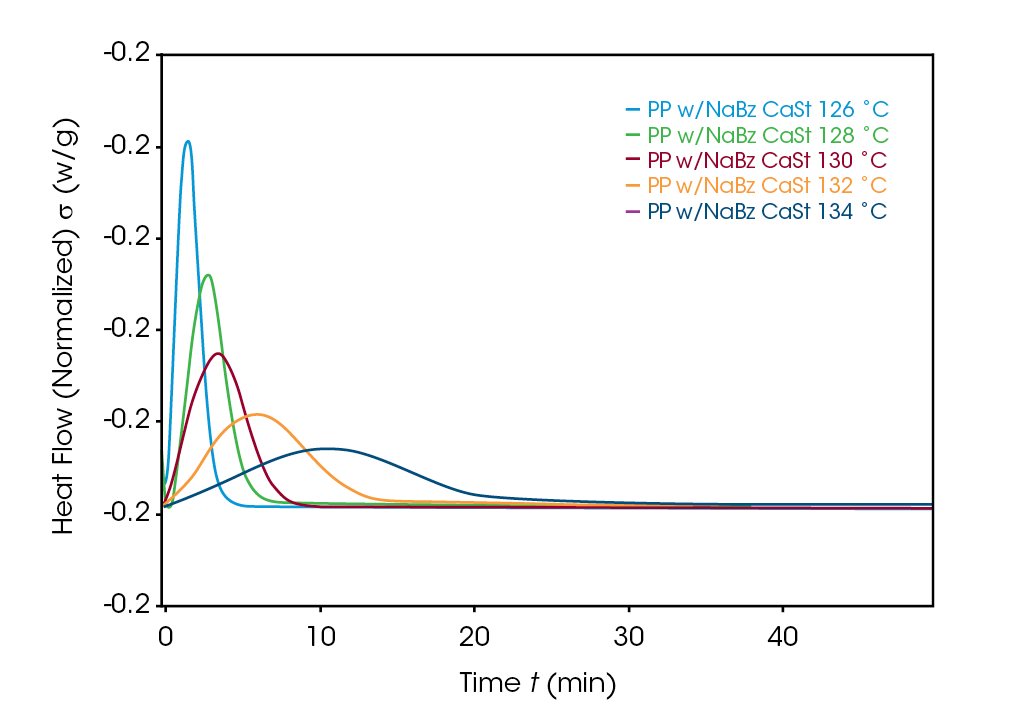
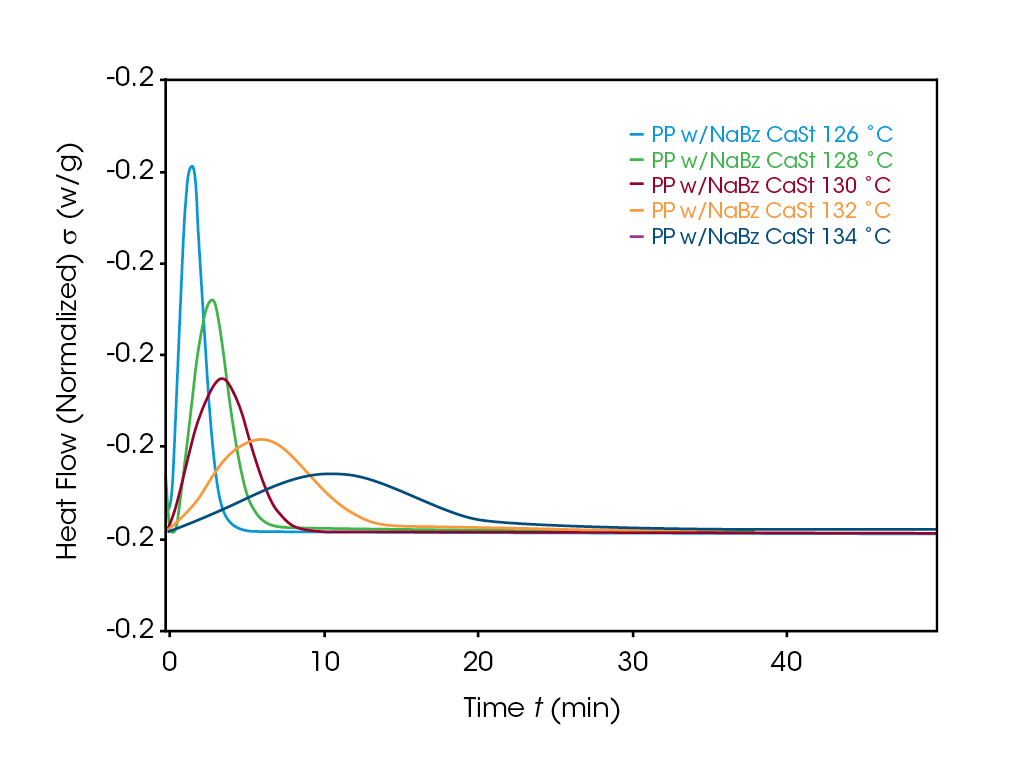
The Avrami exponent n was found to vary between 2.2 and 2.4 for both the PP and NaBz/CaSt PP samples and between 1.9 and 2.1 for the NaBz PP sample. The values of n from the Avrami fit are shown in Figure 7. Decreasing values of n appear to correlate with the degree of undercooling in sample NaBz PP. They appear to increase in sample PP with the degree of undercooling and are approximately constant in sample NaBz/CaSt. Good agreement was observed with the linear form of the Avrami equation (Equation 3) as well as calculating both n and k from the Malkin data fit using the relations in Equations 5 and 6.
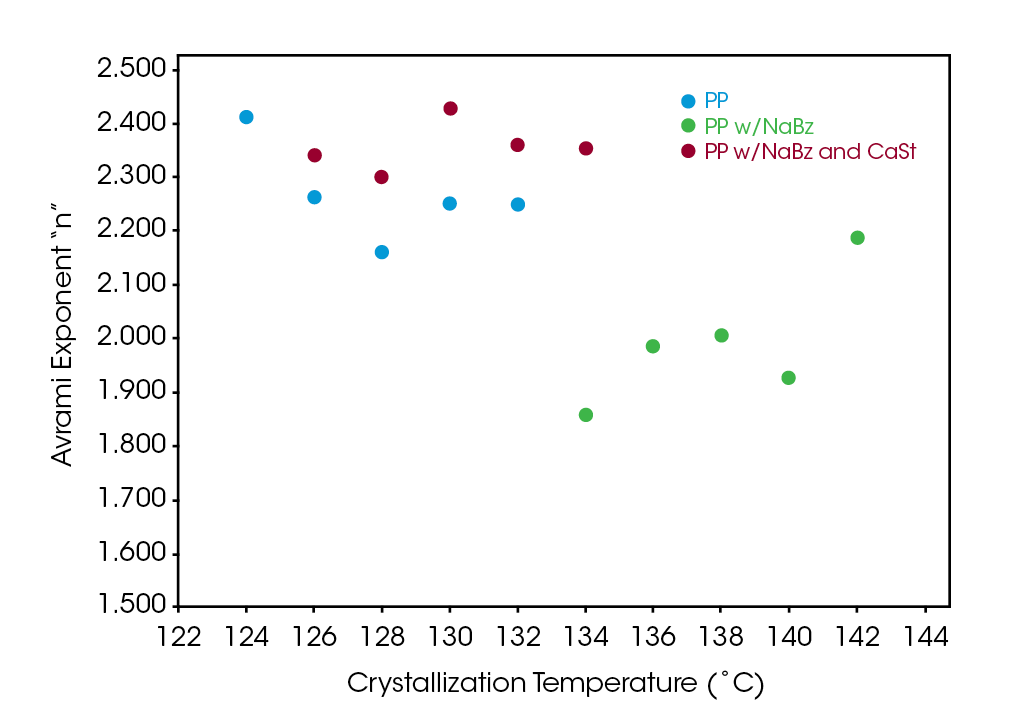
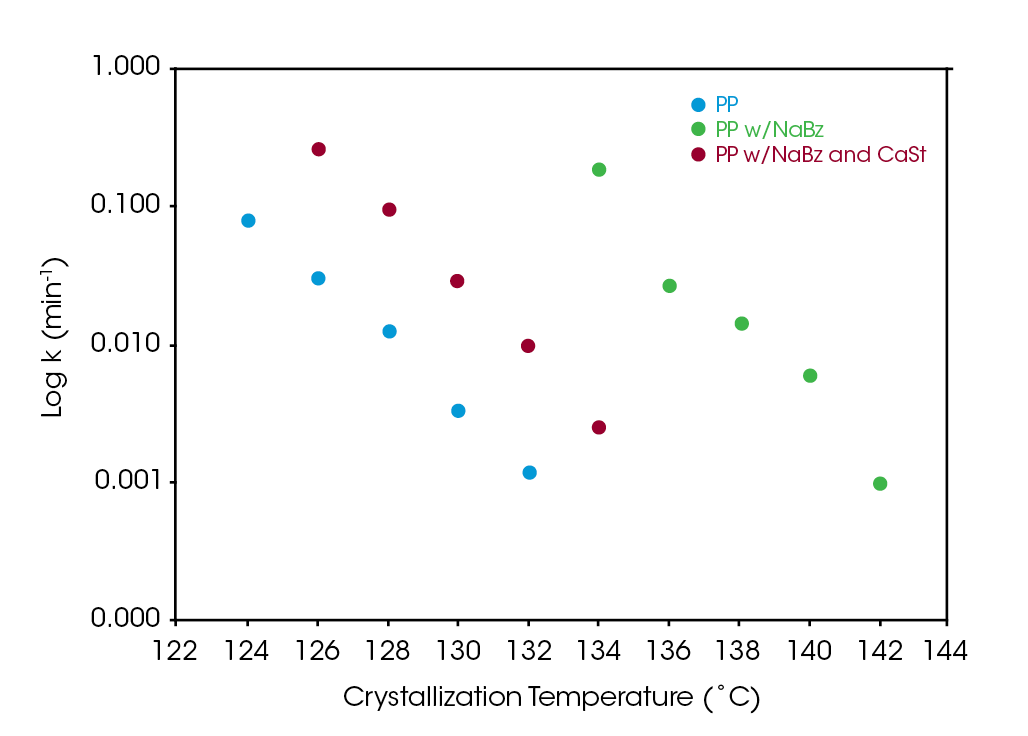
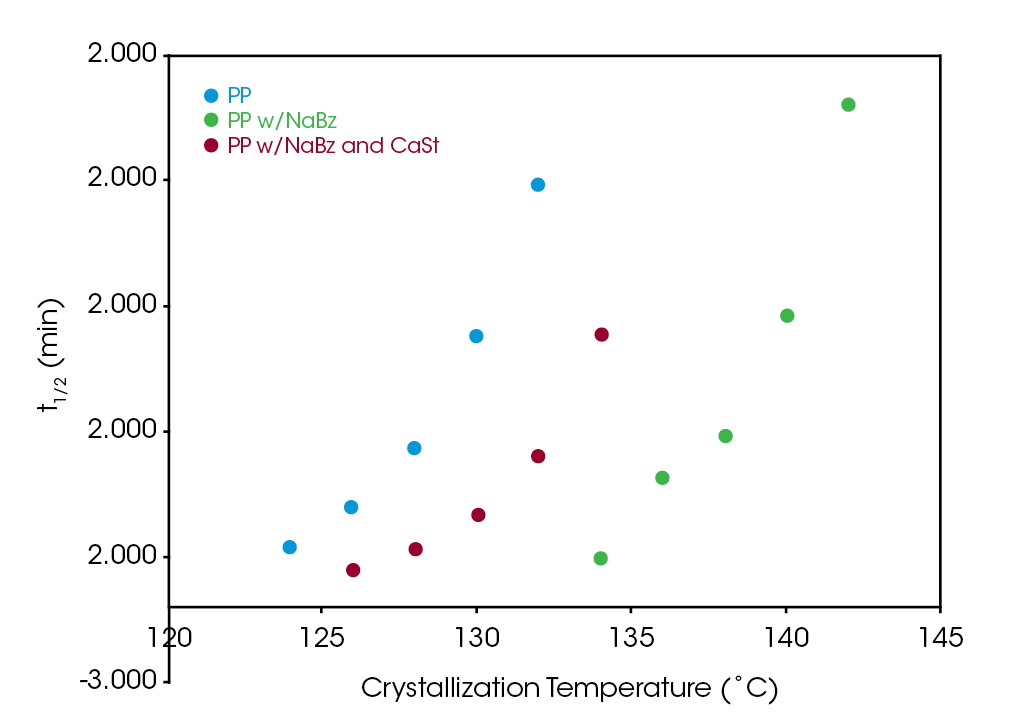
Figure 8 compares the log of the rate constant ‘k’ for the three samples. The antagonistic effect of CaSt is evident but does not appear to completely counteract the nucleating effect of NaBz. All three samples show a strong correlation to the degree of undercooling. Using Equation 4 to calculate the crystallization half-time shows a significant reduction in half-time in sample NaBz/CaSt PP relative to sample PP shown in Figure 9. Rate constant k is plotted on a log scale for clarity in Figure 8 .
Malkin Parameters
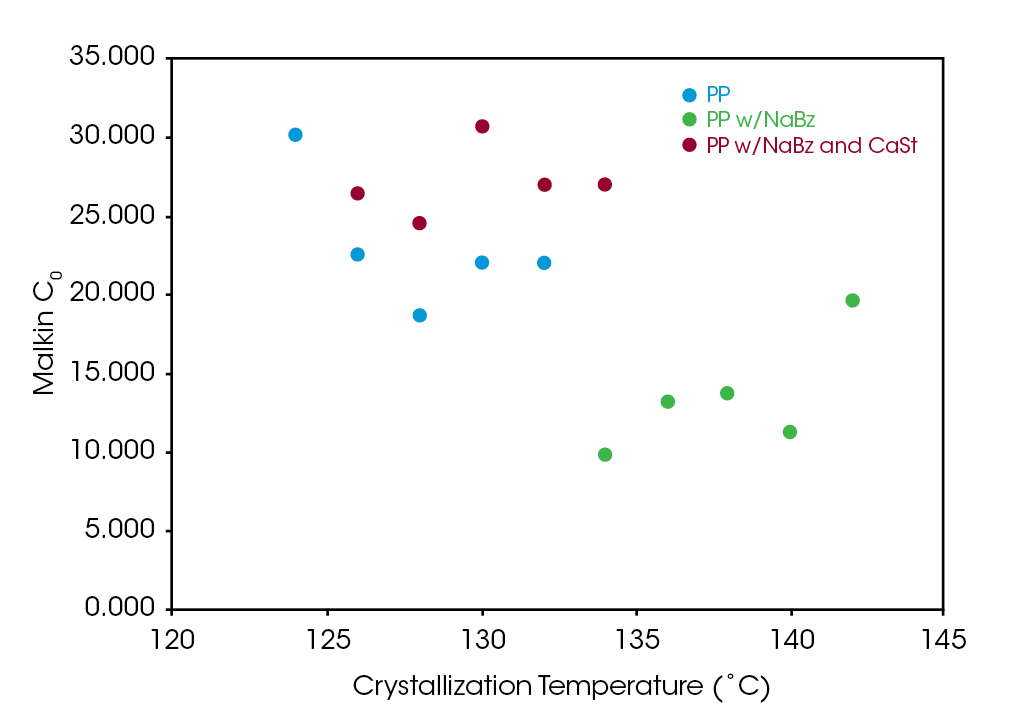
Figure 10 shows a comparison of the Malkin constant C0 for the samples. C0 is the ratio of the secondary to the primary nucleation rates. As expected, this is significantly lower in sample PP NaBz with the values varying from 9 to 19 compared to 19 to 30 for sample PP and 25 to 31 for sample NaBz/CaSt PP.
Like the Avrami constant n, the decreasing values of C0 appear to correlate degree with of undercooling in sample NaBz PP, appear to increase in sample PP and appear approximately constant in sample NaBz/CaSt. As both Avrami n and Malkin C0 rate constants relate to the nucleation process, understanding the correlation between these parameters and physical properties show the potential for DSC to be a diagnostic tool in assessing processing and properties of PP recycle streams.
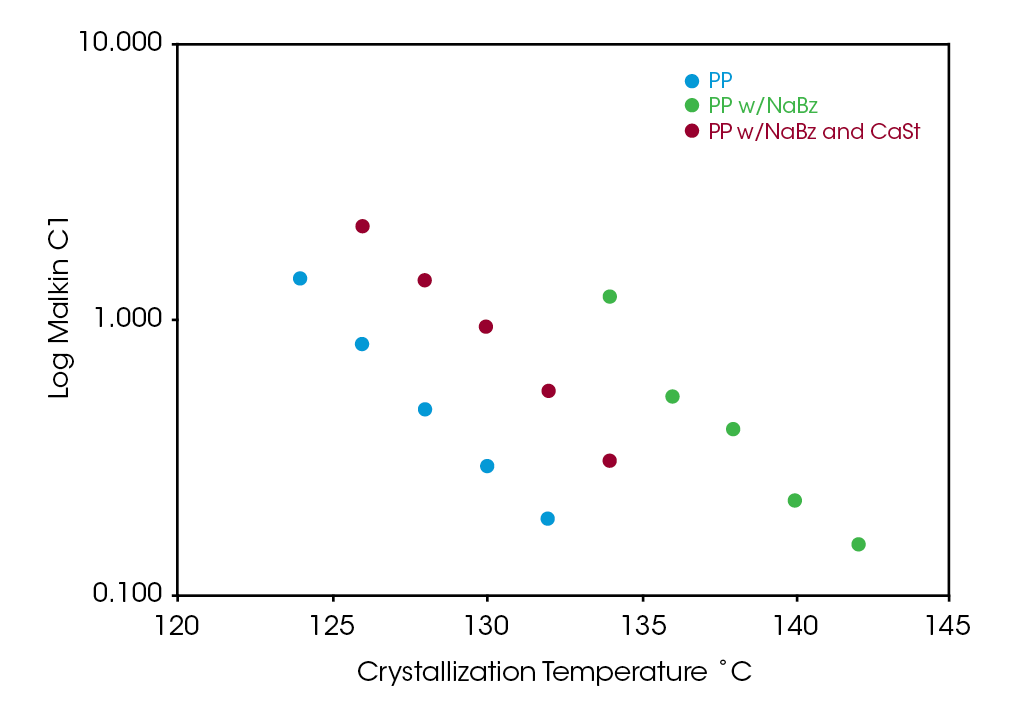
Figure 11 shows a comparison of the log of the Malkin rate constant C1 which is related to the overall crystallization rate. All samples show a strong correlation of C1 with the degree of undercooling. As observed in the Avrami rate constant and calculated t1/2, sample NaBz / CaSt PP shows the antagonistic effect of the CaSt, but C1 is significantly higher than sample PP. C1 is plotted on a log scale for clarity.
Activation Energy
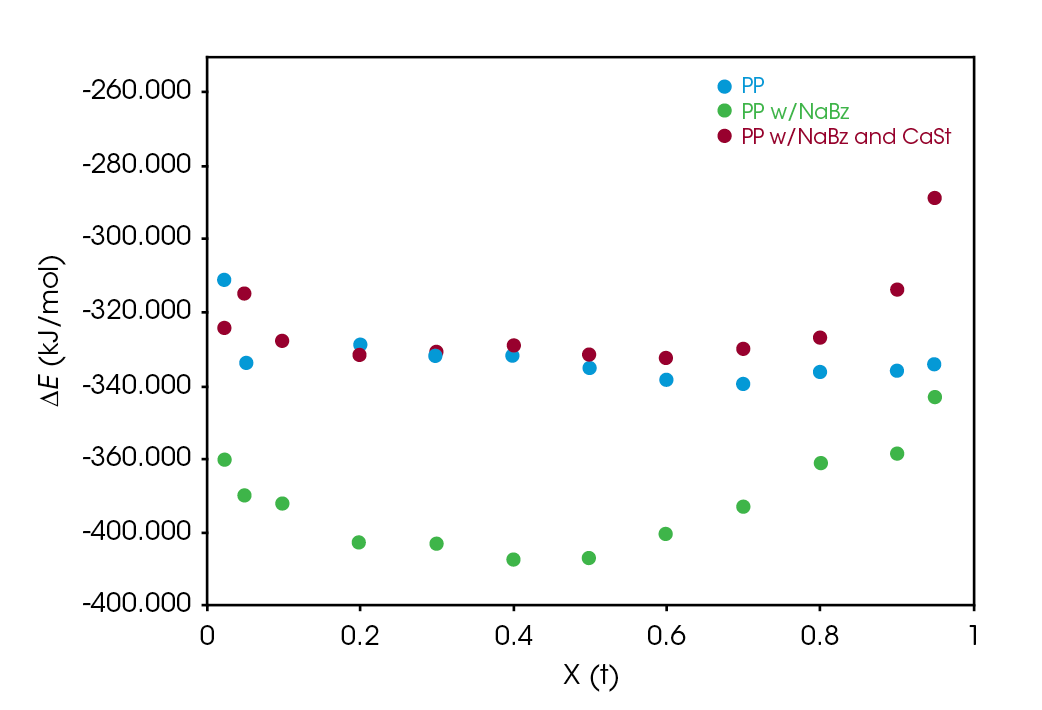
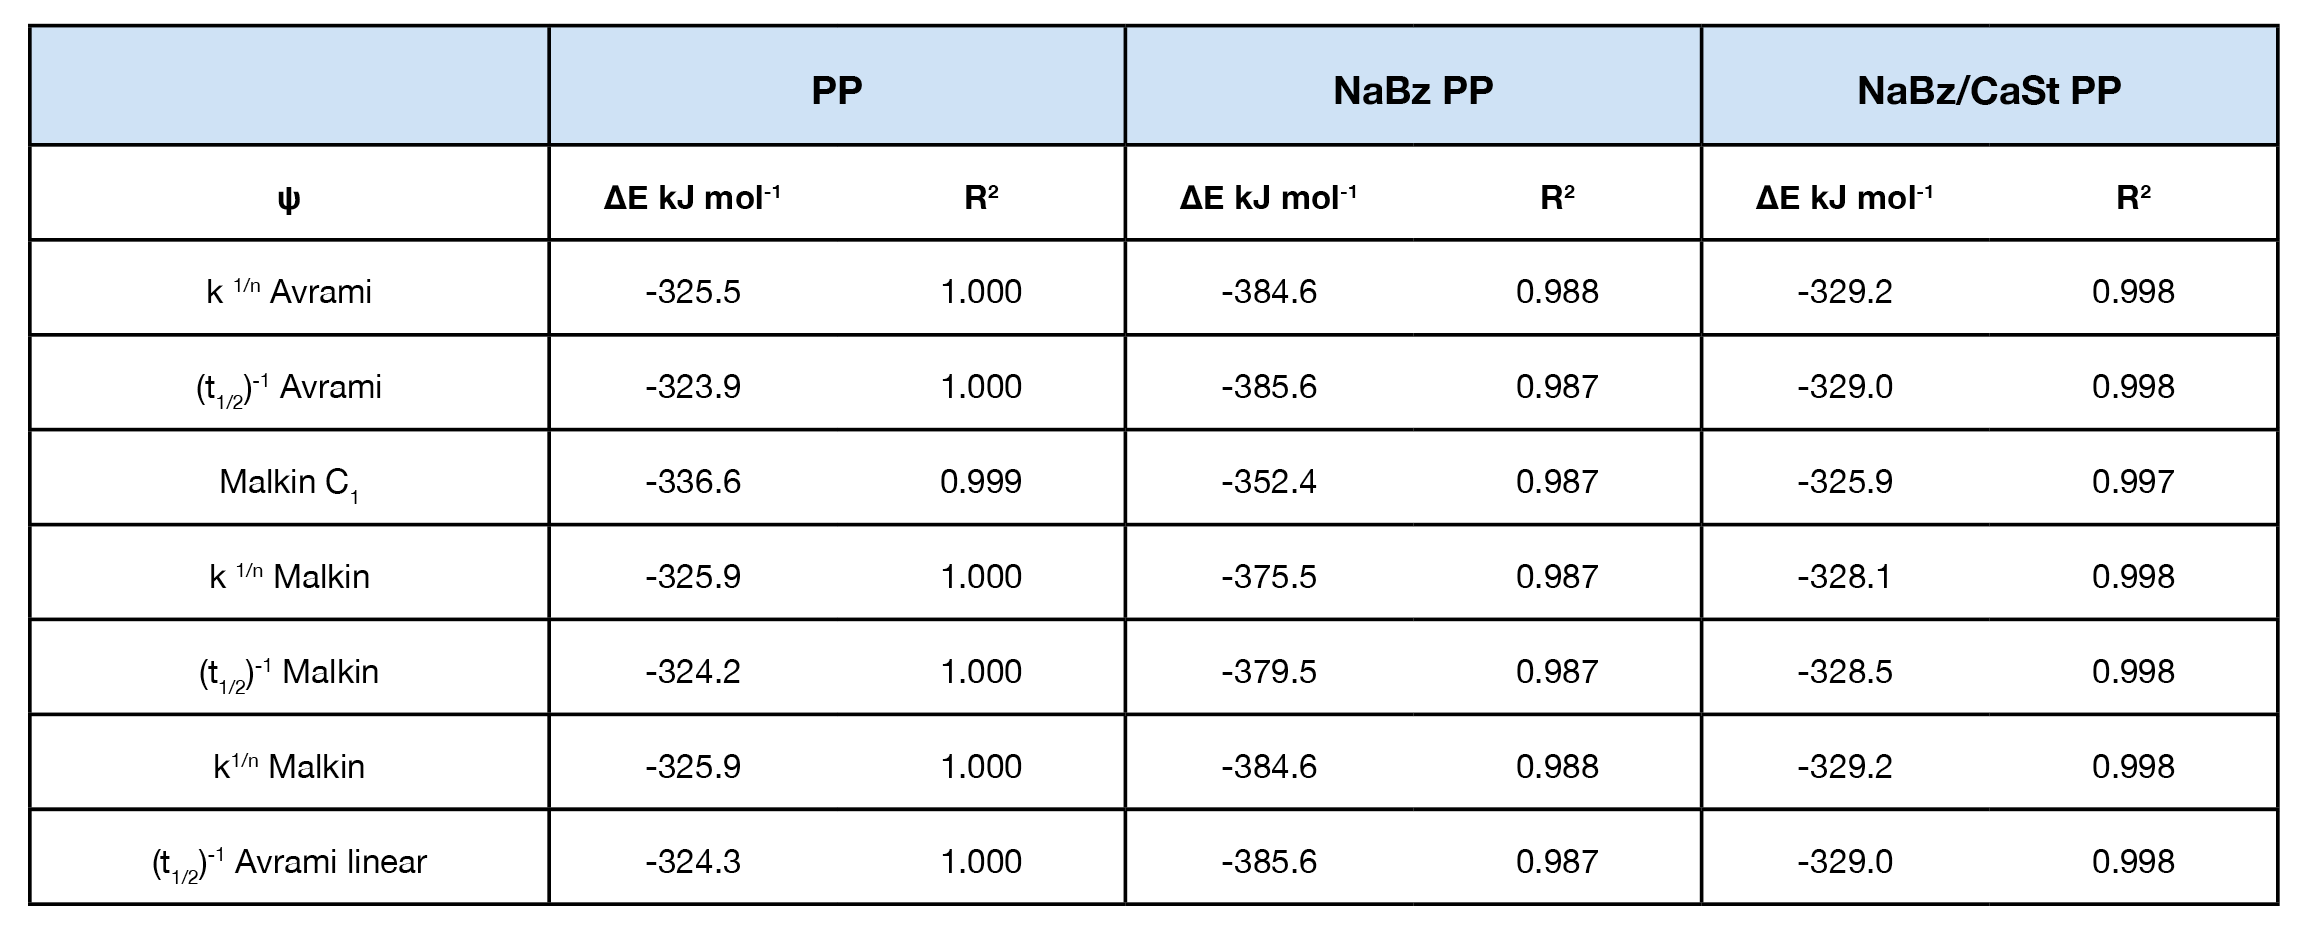
Crystallization activation energy was calculated using Equation 7, the general form of the Arrhenius equation. PP and NaBz/CaSt PP average -326. 7 and -328.4 kJ / mol respectively. Sample NaBz PP has an average activation energy of -378.2 kJ / mol. Activation energy values are summarized in Table 3. Activation energy as a function of conversion was calculated using Freidman’s method and shows good agreement with the other methods and is summarized in Figure 12. Note that there is not an ‘intermediate’ DE trend for sample NaBz/CaSt PP as observed in the rate constants k and C1 in the Avrami and Malkin analyses in the Friedman method. There is an upward trend in both NaBz PP and NaBz/CaSt samples at ~ X(t) = 0.6. This is likely due to heat flow impingement from the emerging nuclei.
Conclusions
The antagonistic effect of calcium stearate on the crystallization of polypropylene containing the nucleator sodium benzoate was investigated. Using a simple DSC experiment run at 10 °C/min, a sample of PP containing both CaSt and NaBz was found to have a crystallization temperature that occurs between that of samples containing NaBz and a reference PP containing no nucleator. This suggests that the CaSt partially eradicates the nucleation mechanism. This straightforward experiment may be an excellent diagnostic for quality control of recycle streams of PP.
An isothermal kinetics study was also performed using the Avrami and Malkin macrokinetic models to determine kinetic parameters.
The Avrami rate constant n, the Malkin rate constant C1, and the calculated t1/2 show that calcium stearate does not completely eradicate the nucleation of the sodium benzoate in our sample but yields an intermediate result between the reference PP and the sample with sodium benzoate only as observed in the DSC cooling experiment.
The Avrami exponent n and Malkin constant C0 both increase in the sample containing calcium stearate and sodium benzoate like the PP reference sample. A simplistic interpretation of n relates to the geometry of the spherulites, a value of 2 is more planar and a value of 2.5 is approaching more spherical. The constant C0 is related to the rate of secondary to primary nucleation rates. The nucleation mechanism and resulting spherulitic structure is related to the physical and processing properties of PP.
The crystallization activation energy did not distinguish the sample NaBz/CaSt PP from reference PP, but did show -50 kJ / mol reduction in sample NaBz PP.
The results demonstrate that DSC is a valuable analytical tool in evaluating recycle streams yielding useful information in a simple DSC ramp experiment and more in-depth correlated properties information from a kinetics experiment that can be used for effective troubleshooting.
References
- “Statista,” 2021. [Online]. Available: https://www.statista. com/aboutus/our-research-commitment.
- Purvis King, “Recycling Polypropylene: How To Recycle PP & The Benefits,” [Online]. Available: https://www.palmetto-industries.com/.
- D. Dieckmann, “Effect of Various Acid Neutralizers on Crystallization Temperature of Polypropylene,” Journal of Vinyl and Additive Technology, vol. 7, no. 1, pp. 51-55, March 2001.
- J Browne, “Applying the Avrami and Malkin Macrokinetic Models for Evaluating Isothermal Crystallization Kinetics of Polypropylene with and without a Chemical Nucleator,” TA Instruments, New Castle, 2020.
- Y. Malkin and V. Beghishev, “General Treatment of Polymer Crystallization Kinetics – Part 1. A New Macrokinetic Equation and its Experimental Validation,” Polymer Engineering and Science, vol. 24, no. 18, pp. 1396-1401, 1984.
- P. Supaphol and J. Spruiell, “Isothermal melt- and cold-crystallization kinetics and subsequent melting behavior in syndiotactic polypropylene: a differential scanning calorimetry study,” Polymer, vol. 42, pp. 699-712, 2001.
- H. Friedman, “Kinetics of thermal degradation of char-forming plastics from thermogravimetry. Application to a phenolic plastic,” Journal of Polymer Science, vol. 6, no. 1, pp. 183-195, 1964.
- J Browne, “Comparison of the Crystallization Behavior of Different Colored Parts Made from Polypropylene using a Single DSC Experiment,” Application Note TA393.
- AAA Polymer, [Online]. Available: https://www.aaapolymer. com/a-simple-guide-to-polypropylene-recycling-for-businesses.
Acknowledgement
Thank you to Jeff Abata of LyondellBasell Industries for providing the samples and his expertise on additives.
Thank you to Ron Becker of SI Group for the discussion on stabilizing recycled plastics.
This paper was written by James Browne, Senior Scientist at TA Instruments.
Click here to download the printable version of this application note.

