Keywords: Rheometer, outwaxing temperature, yield stress, modulus, crude oil, flow assurance
RH099
Abstract
Crude oil is typically extracted in the liquid phase from the reservoir. During transportation, a drop in the temperature can cause the higher molecular weight paraffins or waxes to crystallize into the solid phase and result in the formation of waxy networks. If the temperature decreases below a critical temperature, the crude oil undergoes complete solidification and stops flowing. Subsequent breakdown of this network to restart and maintain the flow often requires energy- and cost-intensive approaches.
This paper will focus on thermo-rheological characterization of crude oil and related fuels in the context of flow assurance. The paper will specifically focus on experimental practices for accurate and precise measurements of the solidification temperature termed as the outwaxing temperature. It will also focus on the rheological characterization of waxy networks formed after the solidification and discuss the potential applications of these measurements in flow assurance studies.
Introduction
Crude oil is one of the most important sources of energy and a key player in today’s global economy. It is typically extracted in the liquid phase from the reservoir and transported using pipelines over long distances for downstream processing. However, a major challenge in transportation is avoiding wax deposition due to the solidification of the higher molecular weight paraffins. A critical parameter that can trigger waxation in crude oil is a decrease in temperature which can cause the waxes to crystallize from the solution. The temperature at which the first wax crystals appear during cooling is commonly known as the wax appearance temperature (WAT). As the temperature continues to decrease, the wax can continue to crystallize and eventually stop the flow of crude oil through the pipelines. This temperature is termed as the outwaxing temperature. In the context of flow assurance studies, it is valuable to determine the outwaxing temperature to ensure efficient and uninterrupted transportation of crude oil. Note that WAT and outwaxing temperature are different parameters with each having its own distinct physical significance. The WAT is typically higher than the outwaxing temperature. However, both the WAT and the outwaxing temperature are critical parameters in flow assurance studies.
A rheometer is a precision instrument that contains the material of interest in a geometric configuration, controls the environment around it, applies and measures wide ranges of stress (σ), strain (γ), and shear rate (γ̇). As a result, the rheometer is widely used to characterize viscosity (η) of the material as a function of temperature/pressure. Since a change in phase from liquid to solid would result in a significant increase in the viscosity of the sample, the outwaxing temperature of crude oil can be measured using viscosity measurements on a rheometer.
It is also important to note that the crystallized waxes can form a strong gel-like structure. Breaking down this structure to restart the flow and maintain the flow rate requires a larger-than-usual pressure differential which is energy intensive. Quite often, pipes need to be insulated to prevent this or heated externally to restart the flow. In addition, gas hydrate, scale formation, wax deposition may cause clogging in pipelines, which can also significantly increase the cost of transportation. A detailed understanding of the rheological properties of the waxes in crude oils is therefore critical for developing flow assurance strategies, especially under adverse conditions of transportation. This application note also provides details on comparing the rheological properties of waxes such as yield stress (σy), storage modulus (G’) loss modulus (G”) and complex viscosity (η*) for four different light crude oils.
Materials and Methods
One heavy crude oil sample was used for outwaxing studies. In addition to the heavy crude oil, four types of light crude oil were also studied in this work. These are labeled as below based on the geographical source of the crude oil.
A: Pennsylvania (PA) crude oil
B: North Dakota (ND) crude oil
C: Prudhoe Alaska (AK) crude oil
D: Texas (TX) crude oil
All samples were tested on a TA Instruments Discovery Hybrid Rheometer (DHR-3). All TA Instruments Discovery line of rheometers are equipped with the following features:
- Magnetic thrust bearing that reduces friction from the air-flow in conventional air-bearing rheometers. Allows for accurate and precise viscosity measurements for the most sensitive samples.
- Advanced drag cup motor design that allows for accurate and precise torque control
Outwaxing temperature was determined by starting from a temperature above the WAT and cooling them at a rate of 1-2 °C/min. These tests can be performed using a constant shear rate (termed as “flow temperature ramp”) to obtain viscosity (η) as a function of temperature or using an oscillatory deformation with a constant frequency (ω) and amplitude (termed as “oscillation temperature ramp”) to obtain complex viscosity (η*) as a function of temperature. The physical significance of η and η* are similar from a rheological standpoint.
The flow properties of the samples were studied using “flow sweep” experiments, ensuring that every data point was collected under steady-state conditions. The steady state was defined when 3 consecutive data points (averaged over 10 seconds) are within 5% of each other. Yield stress measurements were performed similarly using stress sweep experiments at different temperatures.
Additional oscillation experiments were performed to determine the viscoelastic properties of the crude oil waxes such as storage modulus (G’), loss modulus (G”) and complex viscosity (η*) especially below the WAT. These experiments specifically comprised of changing the oscillation frequency at a fixed strain and temperature to gain additional insights into the differences in microstructure of the waxy networks and its implication on flow assurance.
Note that all oscillation experiments were performed using an oscillatory strain small enough to characterize the material properties “at rest” without perturbing the structure within the linear viscoelastic region (LVR).
Data analysis and processing was performed using TA Instruments TRIOS software which can be downloaded from the TA Instruments website.
Results and Discussion
Determination of outwaxing temperature
The WAT for all samples was determined using DSC and the data are summarized in table 1 below.
Table 1. WAT for the crude oil samples.
| Sample | WAT (ºC) |
|---|---|
| Heavy Crude | 45.67 |
| A (PA) | 13.87 |
| B (ND) | 2.92 |
| C (AK) | -11.59 |
| D (TX) | 26.47 |
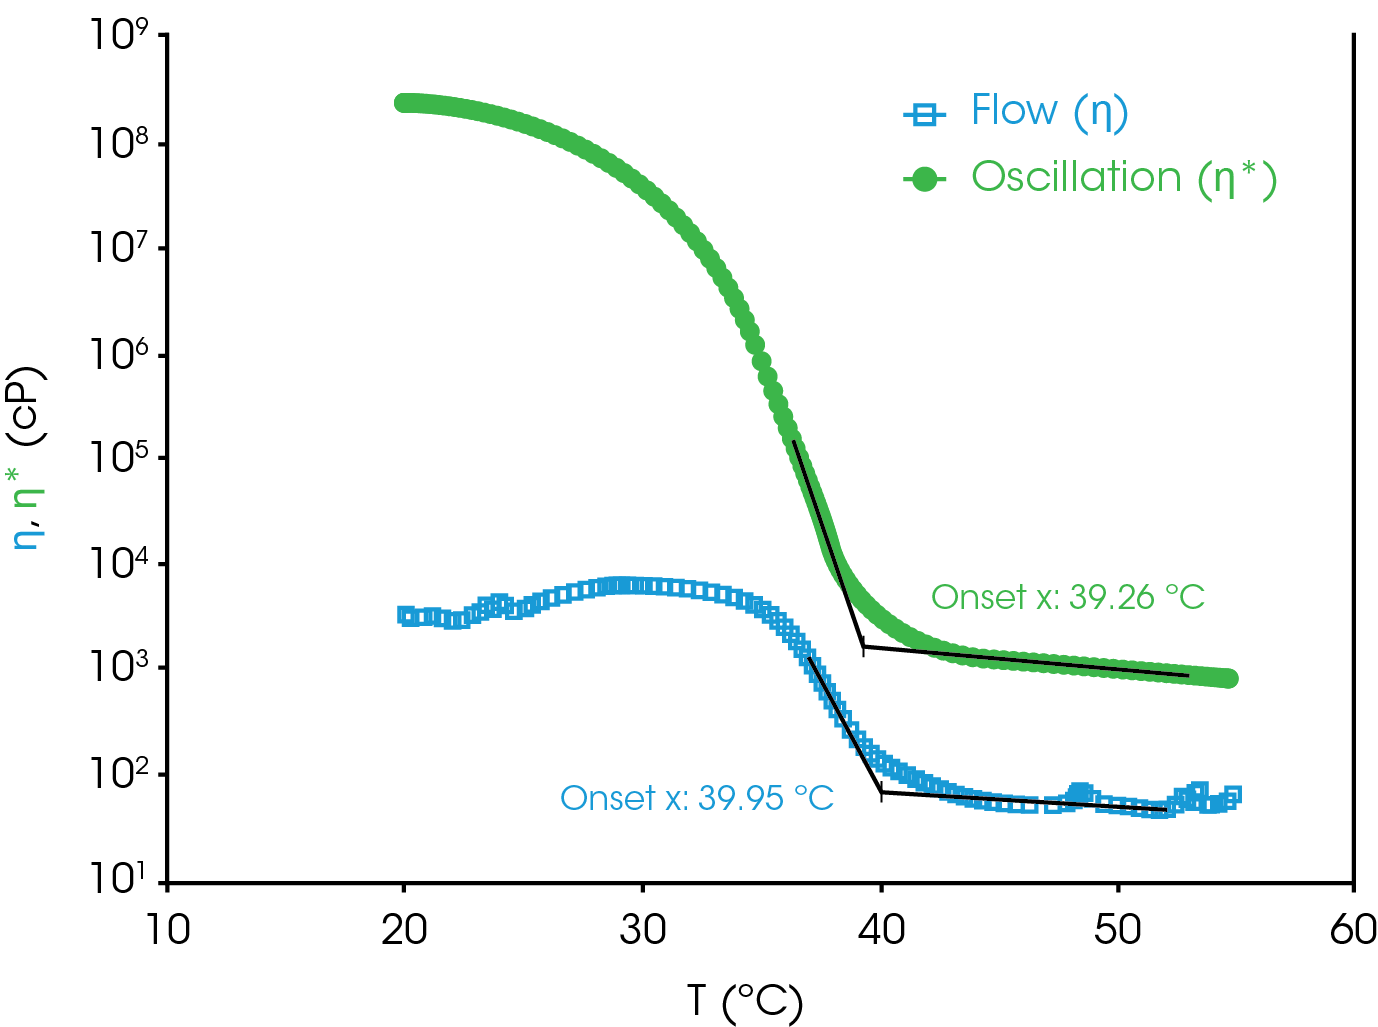
The outwaxing temperature was determined using “flow temperature ramp” and “oscillation temperature ramp” experiments starting from temperatures above the WAT. The data for the heavy crude oil is shown in Figure 1 below.
It can be observed that at a certain temperature, there is a significant increase in both η and η* ranging over orders of magnitude likely indicating a phase change in the sample. One of the ways to measure the temperature of the phase change is using the “onset point” analysis (available directly in TRIOS). This analysis allows a user to construct two tangents; one along the data prior to transition and other along the slope of the transition. The projected intersection of these tangents on the x-axis (temperature in this case) is denoted as the onset temperature. In this example, the onset point represents the outwaxing temperature. It is interesting to note that the overall change in the η* is much higher than η since the lower deformation imposed on the sample in an oscillation temperature ramp allows the formation of a stronger wax network compared to a flow temperature ramp. This is likely due to differences in the size of the wax crystals formed under shear being lower than that formed under quiescent conditions.
While the outwaxing temperatures determined using η (flow) or η* (oscillation) are comparable in the above sample, it may not be the case for all materials. Both experimental methods simulate outwaxing under different scenarios. An oscillation temperature ramp simulates waxation under quiescent, no-flow, conditions in the pipeline, whereas flow temperature ramp simulates waxation under non-quiescent, pumping flow, conditions. The results from these two approaches can be comparable as observed in the case of the heavy crude sample studied here or can be quite different depending on the chemistry of the sample.
An additional approach to determine liquid-solid transition points like the outwaxing temperature via rheological measurements is by monitoring the storage modulus (G’) and loss modulus (G”). G’ is a measure of the energy stored in the elastic structure of the sample. G” represents the amount of energy dissipated by the sample upon deformation. If G’ > G”, the material response to the applied deformation is dominated by storage of energy typical in elastic solids. If G” > G’ viscous energy dissipation dominates the material which is typical in liquids. The data for a light crude oil, sample D (TX), is shown in Figure 2 below.
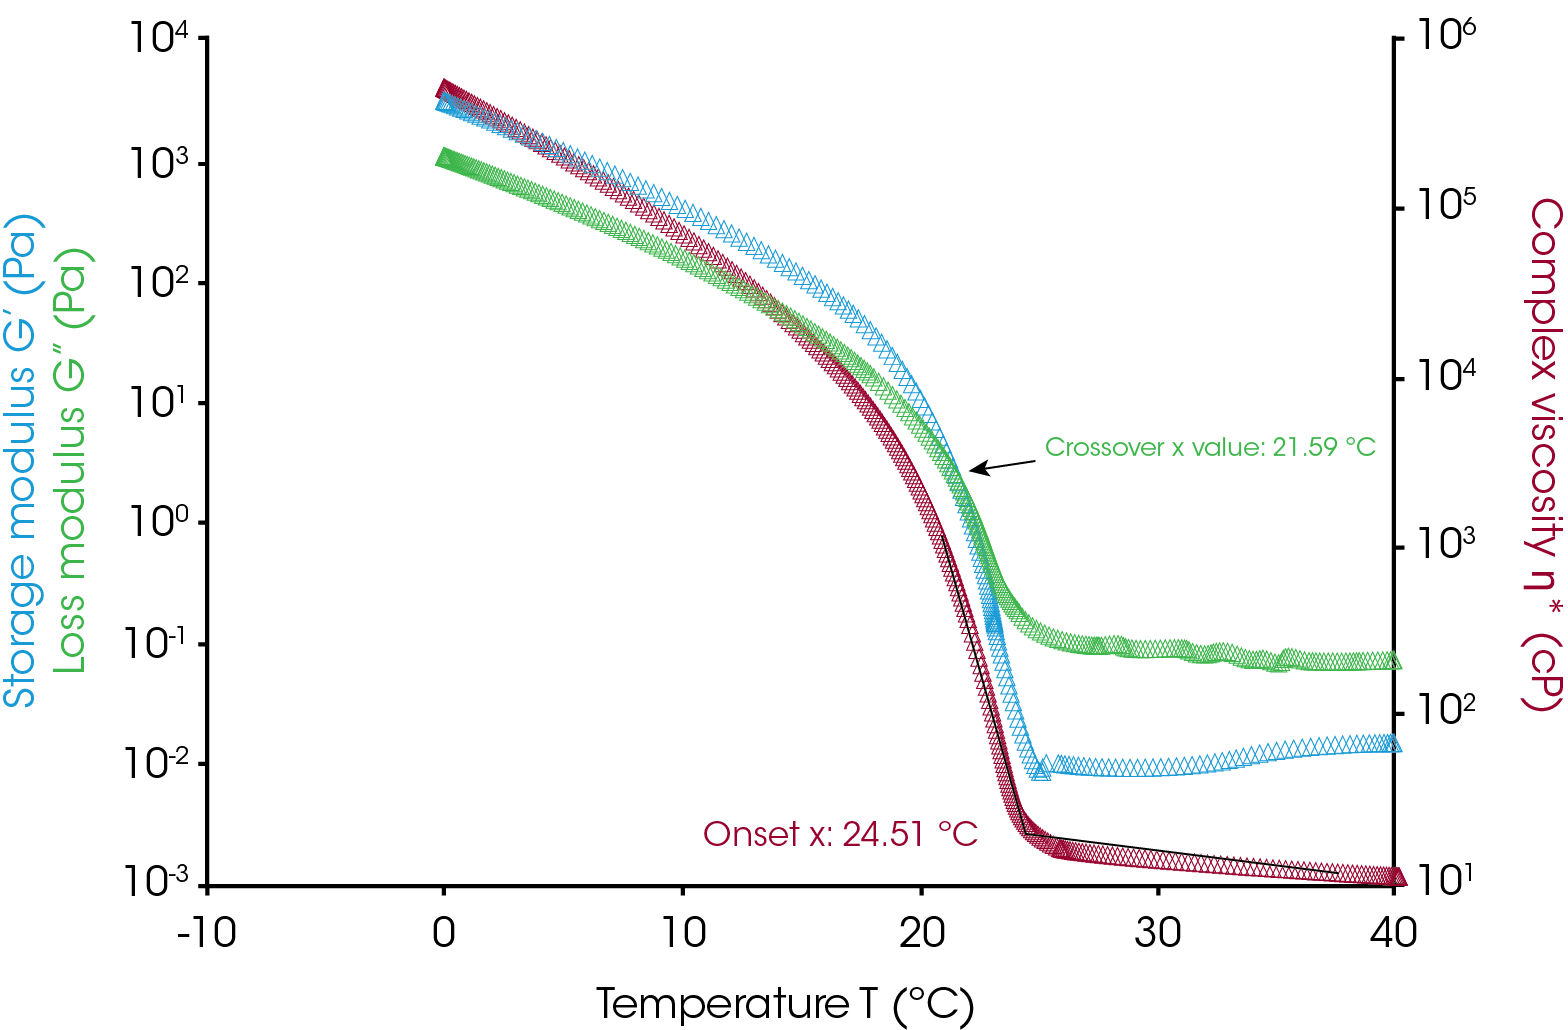
The trends in the rheology data can be directly connected with the crude oil’s microstructure. Initially, the waxes are dissolved in the liquid phase and there is no elasticity or structure to the sample. Any energy imposed by the deformation is dissipated and the loss modulus, G”, dominates. As the sample is cooled, the waxes begin to crystallize which results in an increase in both G’ and G”, but G’ increases much more rapidly than G”. At the outwaxing temperature, the wax begins to form a sample-spanning network structure resulting in a cross-over point in the G’-G” curves when plotted on the same y-axis scale. The cross-over temperature is denoted as the outwaxing temperature.
Note that the outwaxing temperature calculated from this approach will be lower than that obtained from onset point analysis of η or η*. This is clearly observed in Figure 2. The benefit of the cross-over modulus approach is that eliminates the user-to-user subjectivity in an onset point analysis depending on the limits chosen during the analysis. On the other hand, a challenge of this approach is that it is done under quiescent conditions. Simulating flow conditions and obtaining oscillation data simultaneously requires complex experimental techniques such as parallel superposition and/or orthogonal superposition. Both options are available on TA Instruments rheometers but are beyond the scope of this application note.
In any case, if the experimental technique and analysis method are kept consistent, outwaxing temperatures can be precisely determined and compared for any crude oil samples.
Yield Stress Measurements
The yield stress of any material is the minimum stress required to initiate flow from rest. The waxes formed during outwaxing in a crude oil can impose a yield stress to the entire system, in that a critical stress needs to be applied to the system to initiate or restart flow in a gelled pipeline. As such, the measurement and comparison of yield stress is extremely important in the context of flow assurance.
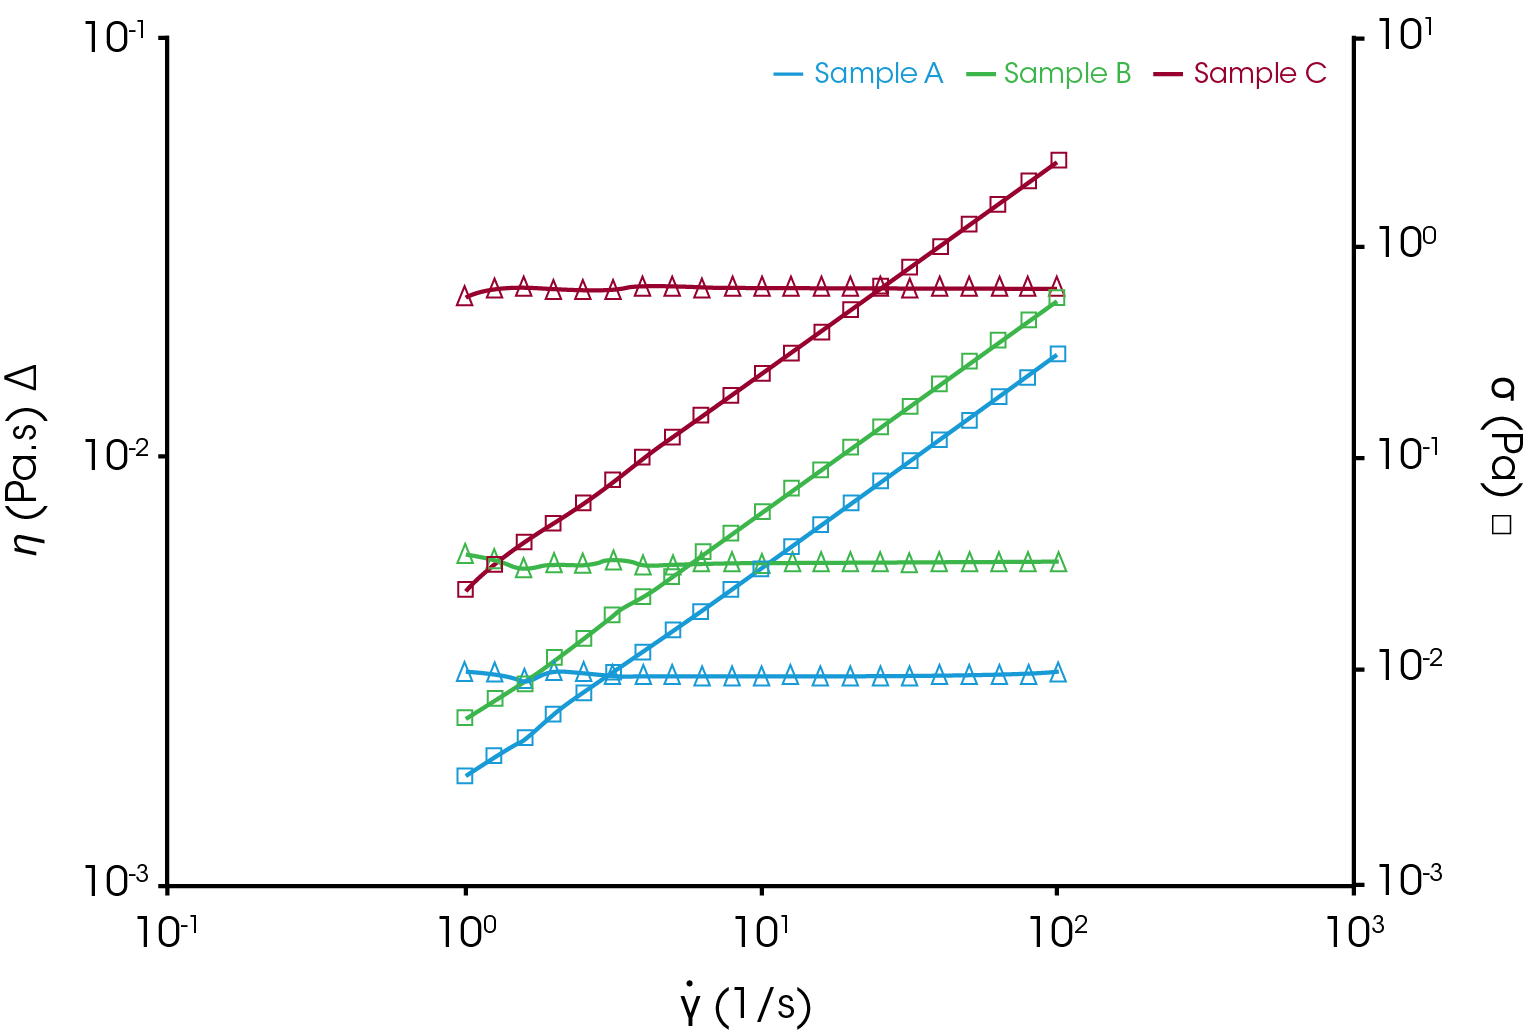
The flow properties of the light crude oil samples (η vs γ̇) were first tested at 25 °C using flow sweep experiments using a Couette setup comprising of recessed end aluminum rotor and an aluminum cup. As shown in Figure 3, crude oils A-C were found to be Newtonian and η was independent of γ̇. This would be expected as the WAT for these samples are significantly below the test temperature.
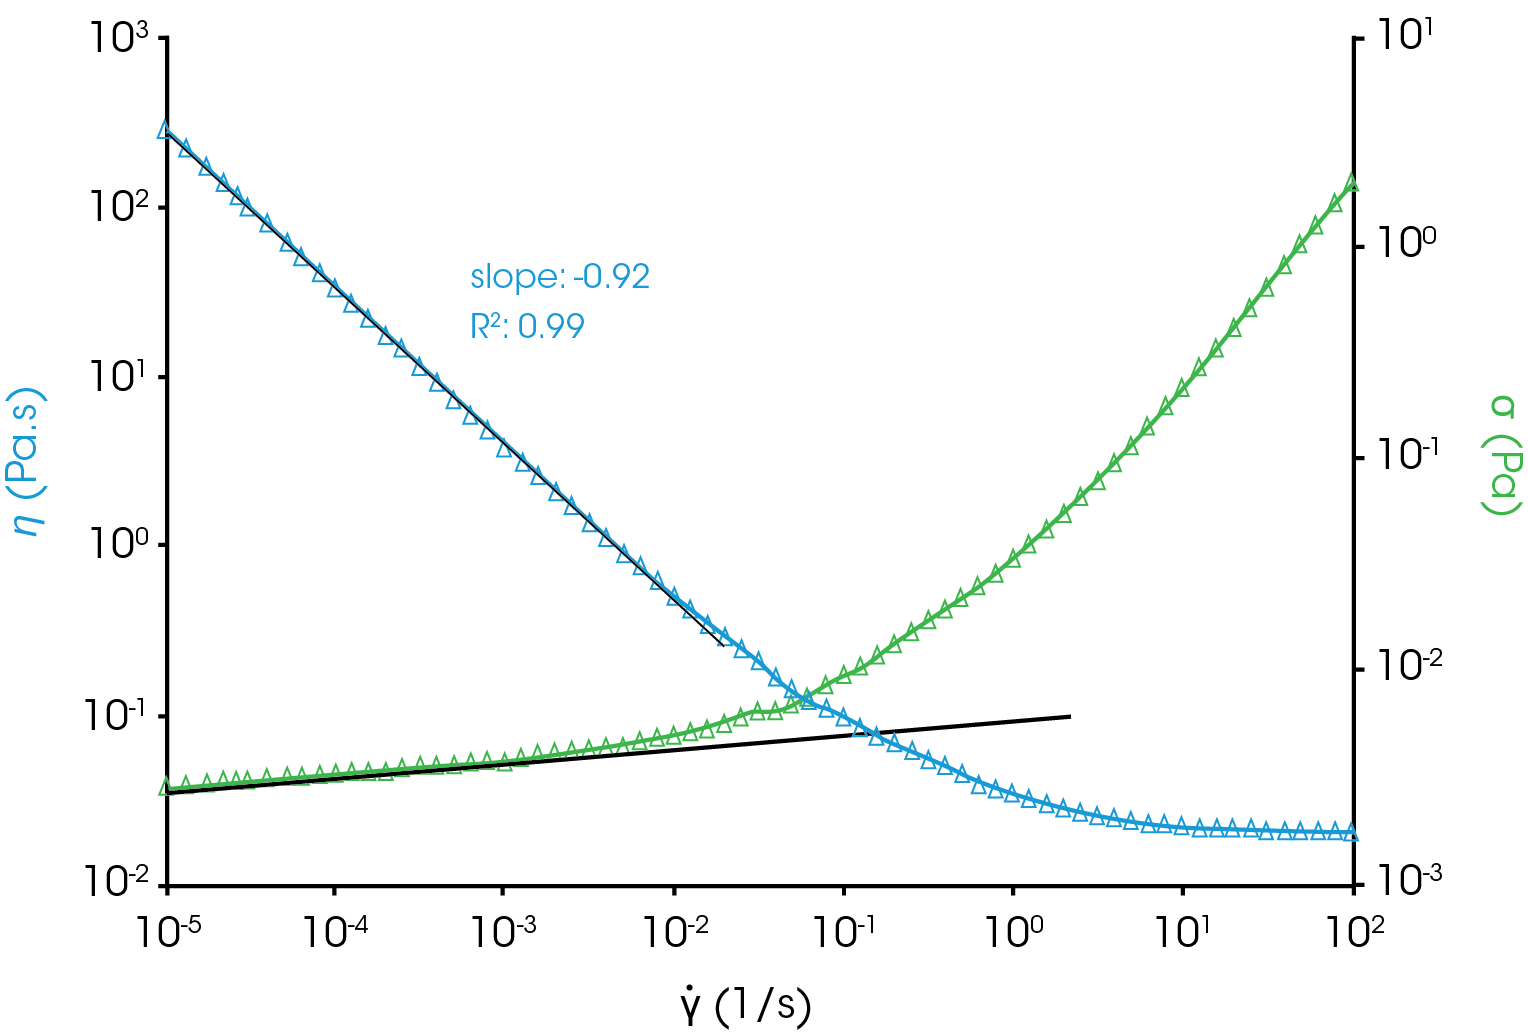
On the other hand, while sample D (TX) exhibited Newtonian behavior at high γ̇, the viscosity increased by orders of magnitude as the γ̇ was lowered. At the lowest shear rates, the viscosity curved displayed a characteristic slope close to -1 (see Figure 4), a behavior that is typically observed in yield-stress fluids.
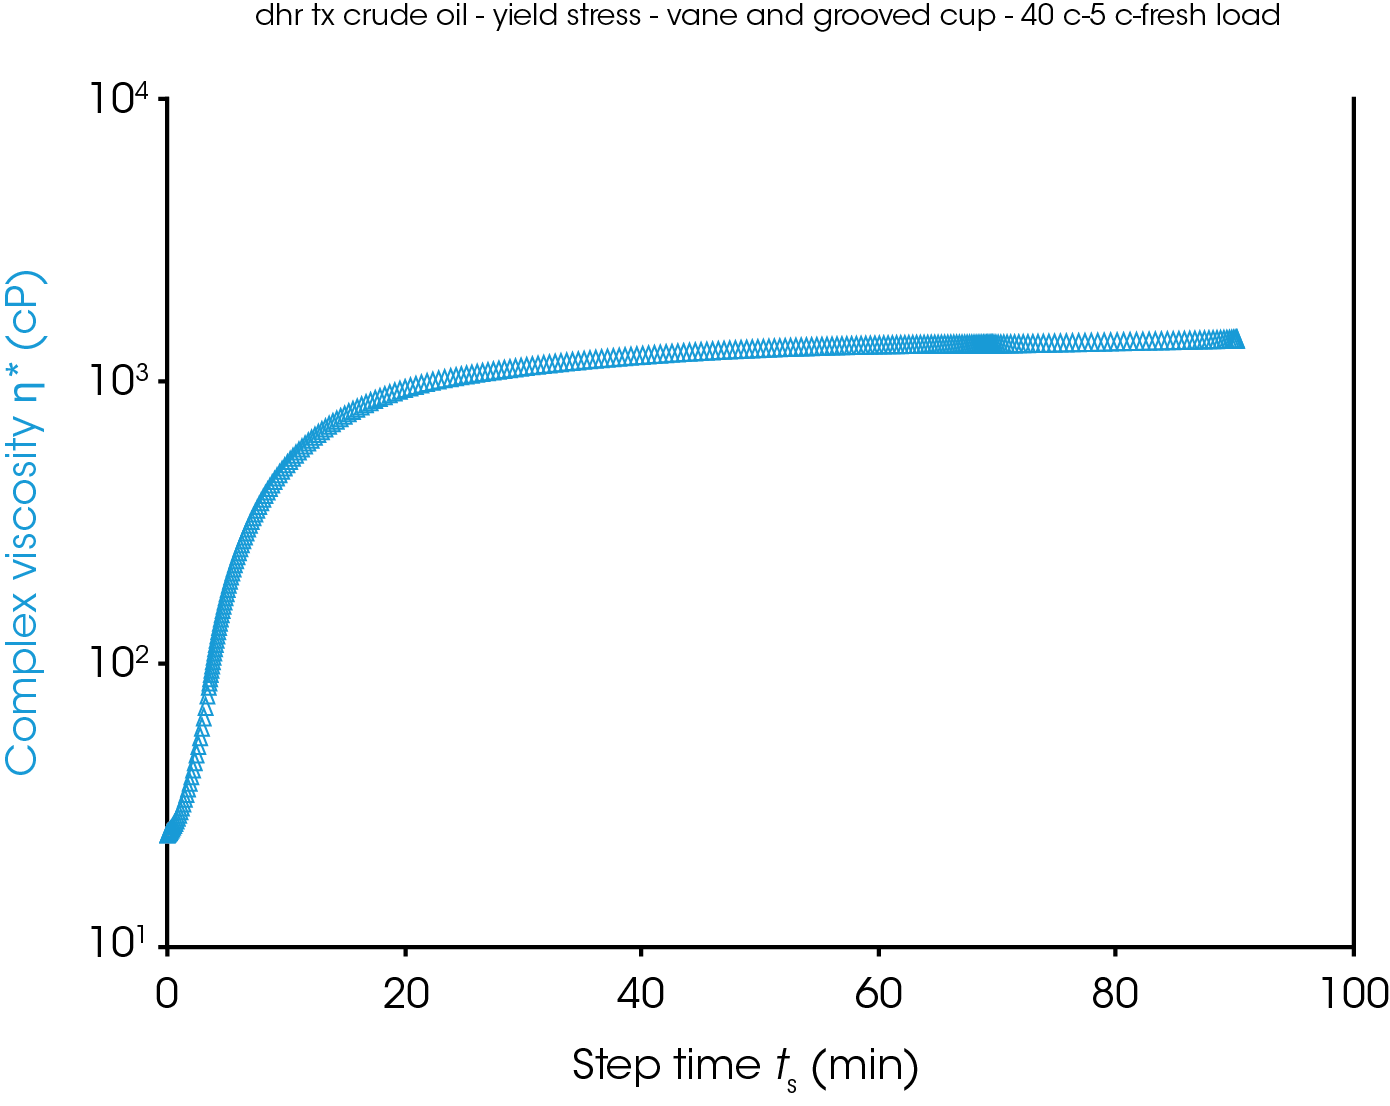
To investigate this behavior further, sample D (TX) was studied at different temperatures. The setup was changed to a Couette stainless-steel vane rotor in a grooved aluminum cup to minimize slippage. At each test temperature, the sample was allowed to equilibrate at that temperature by performing an oscillation time sweep experiment until η* reached a steady state plateau. A representative plot at 20 °C is shown in Figure 5 below.
Post-equilibration, the sample was subjected to a flow experiment where the stress was increased in a controlled fashion. At temperatures of 30 °C and above, sample D (TX) exhibited Newtonian behavior where the viscosity is a constant value and independent of the applied stress. This type of response is comparable to that of samples A-C. However, at temperatures of 25 °C and below, the η is significantly higher than the values recorded at 30 °C. Further, it is observed that η drops by orders of magnitude over a narrow stress range, a characteristic rheological signature of yield-stress fluids.
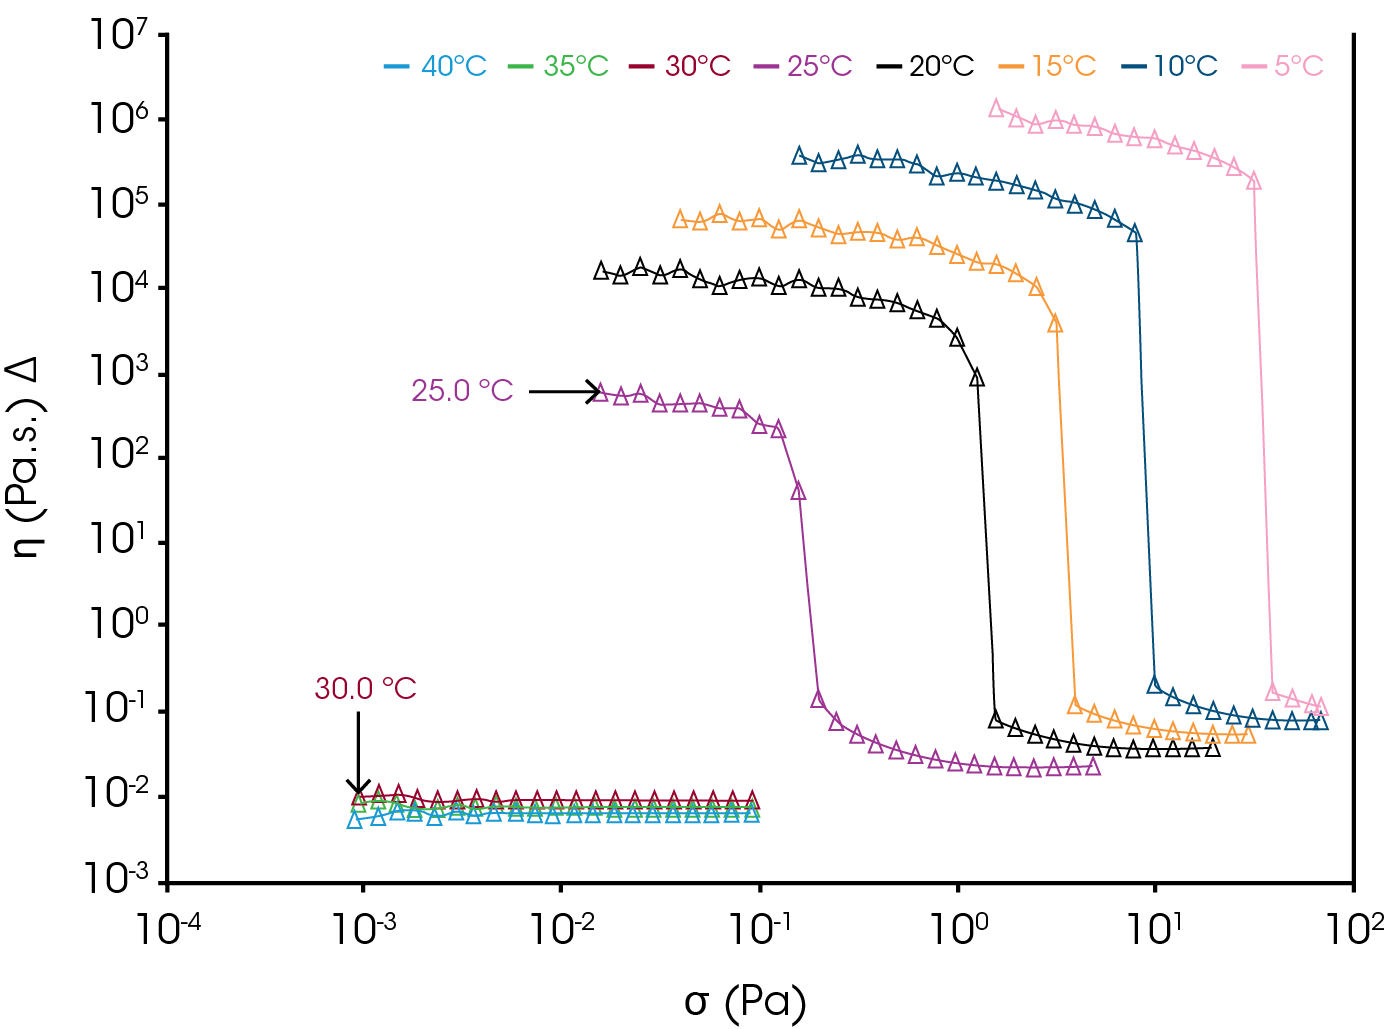
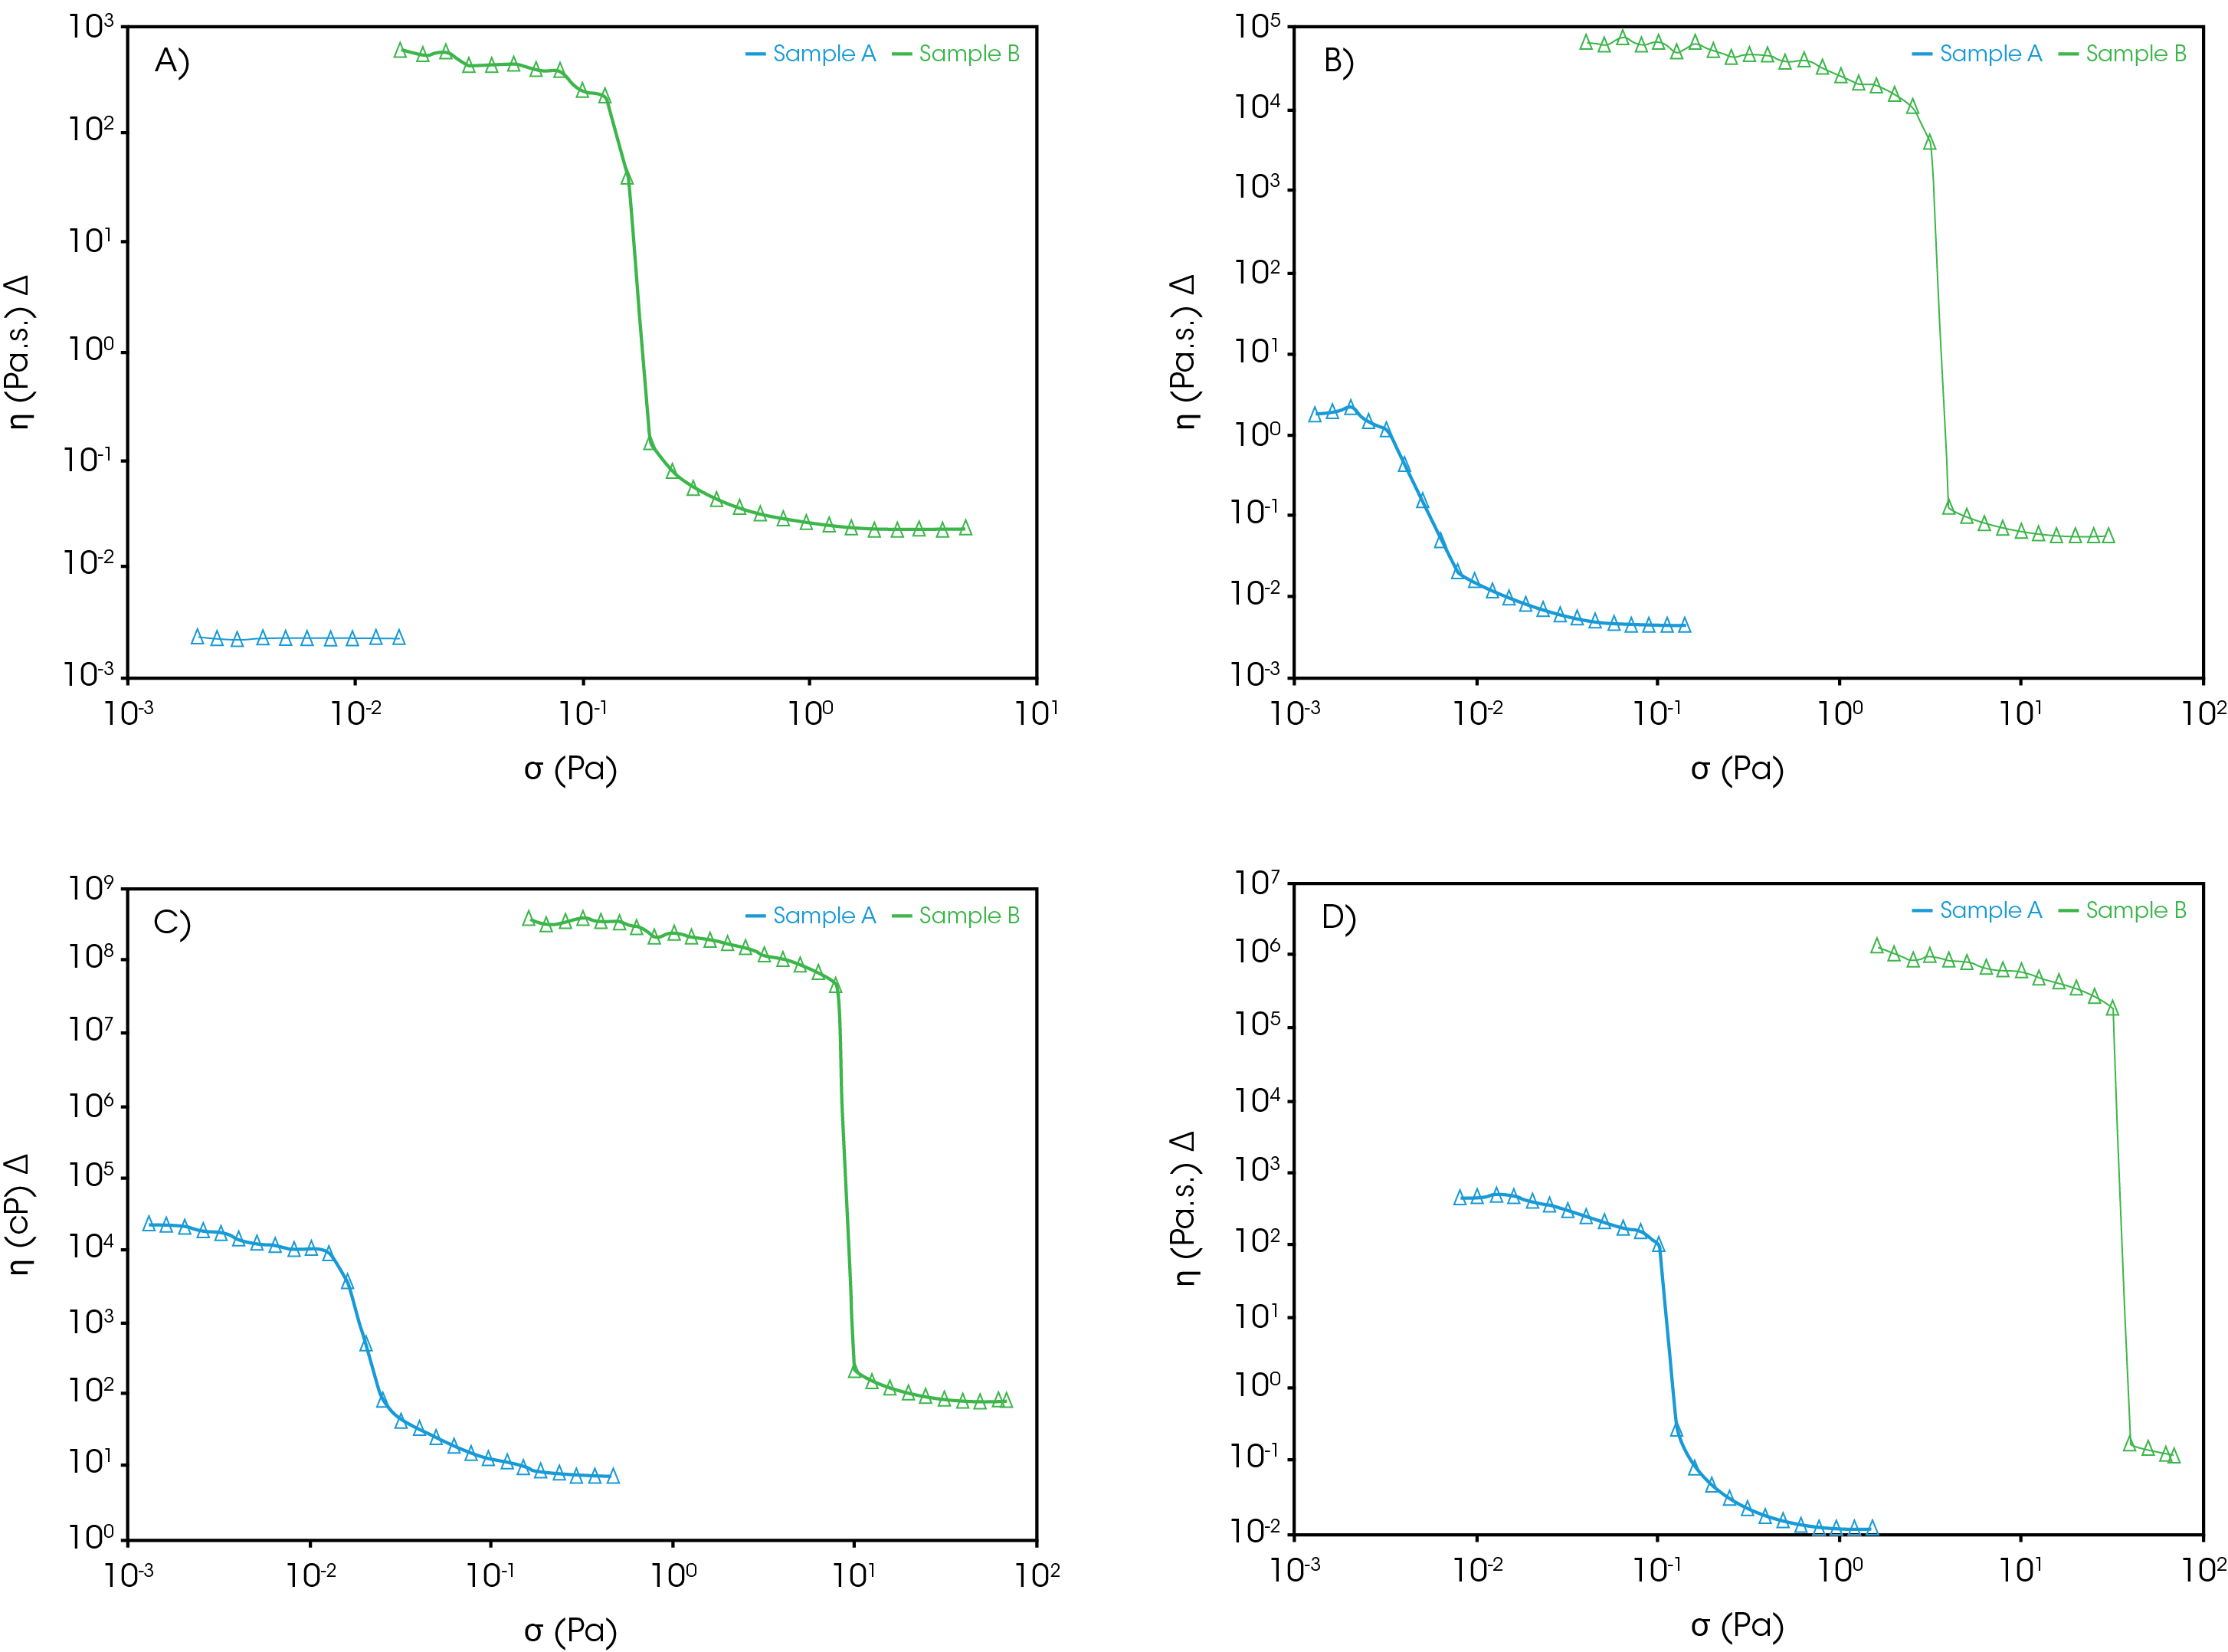
The value of stress at which the dramatic drop in η is observed is termed as the “yield stress” or σy. Below σy, there is practically no flow occurring in the sample. A comparison of samples A (PA) and D (TX) at four different temperatures is shown in Figure 7. It can be observed that at 25 °C, sample A (PA) exhibits a Newtonian behavior while sample D (TX) exhibits a finite, well-defined σy. This is likely due to the high WAT of sample D (TX) compared to sample
A (PA) which results in the formation of a network of waxy structure in sample D (TX) at 25 °C. As the test temperature is lowered, both sample A (PA) and D (TX) exhibit a well-defined σy. However, the measured σy and the change in η at yield of sample D (TX) is much higher than that of sample A (PA) at all temperatures. These observations indicate that the network structure formed by sample D (TX) might be stronger than that formed by sample A (PA) under identical conditions. These measurements are extremely useful in flow assurance studies as they also provide relative comparisons of the magnitude of pressure drop that might be required for restart of a gelled pipeline. Additionally, the pipelines transporting crude oil D (TX) will need to be maintained at higher temperature for efficient, uninterrupted transportation.
It is important to note that the measured σy will be highly dependent on the experimental setup, testing conditions and the method of analysis. All the experimental parameters need to be kept consistent in order to perform relative comparisons of yield properties of materials as shown above.
Characterization of Viscoelastic Properties
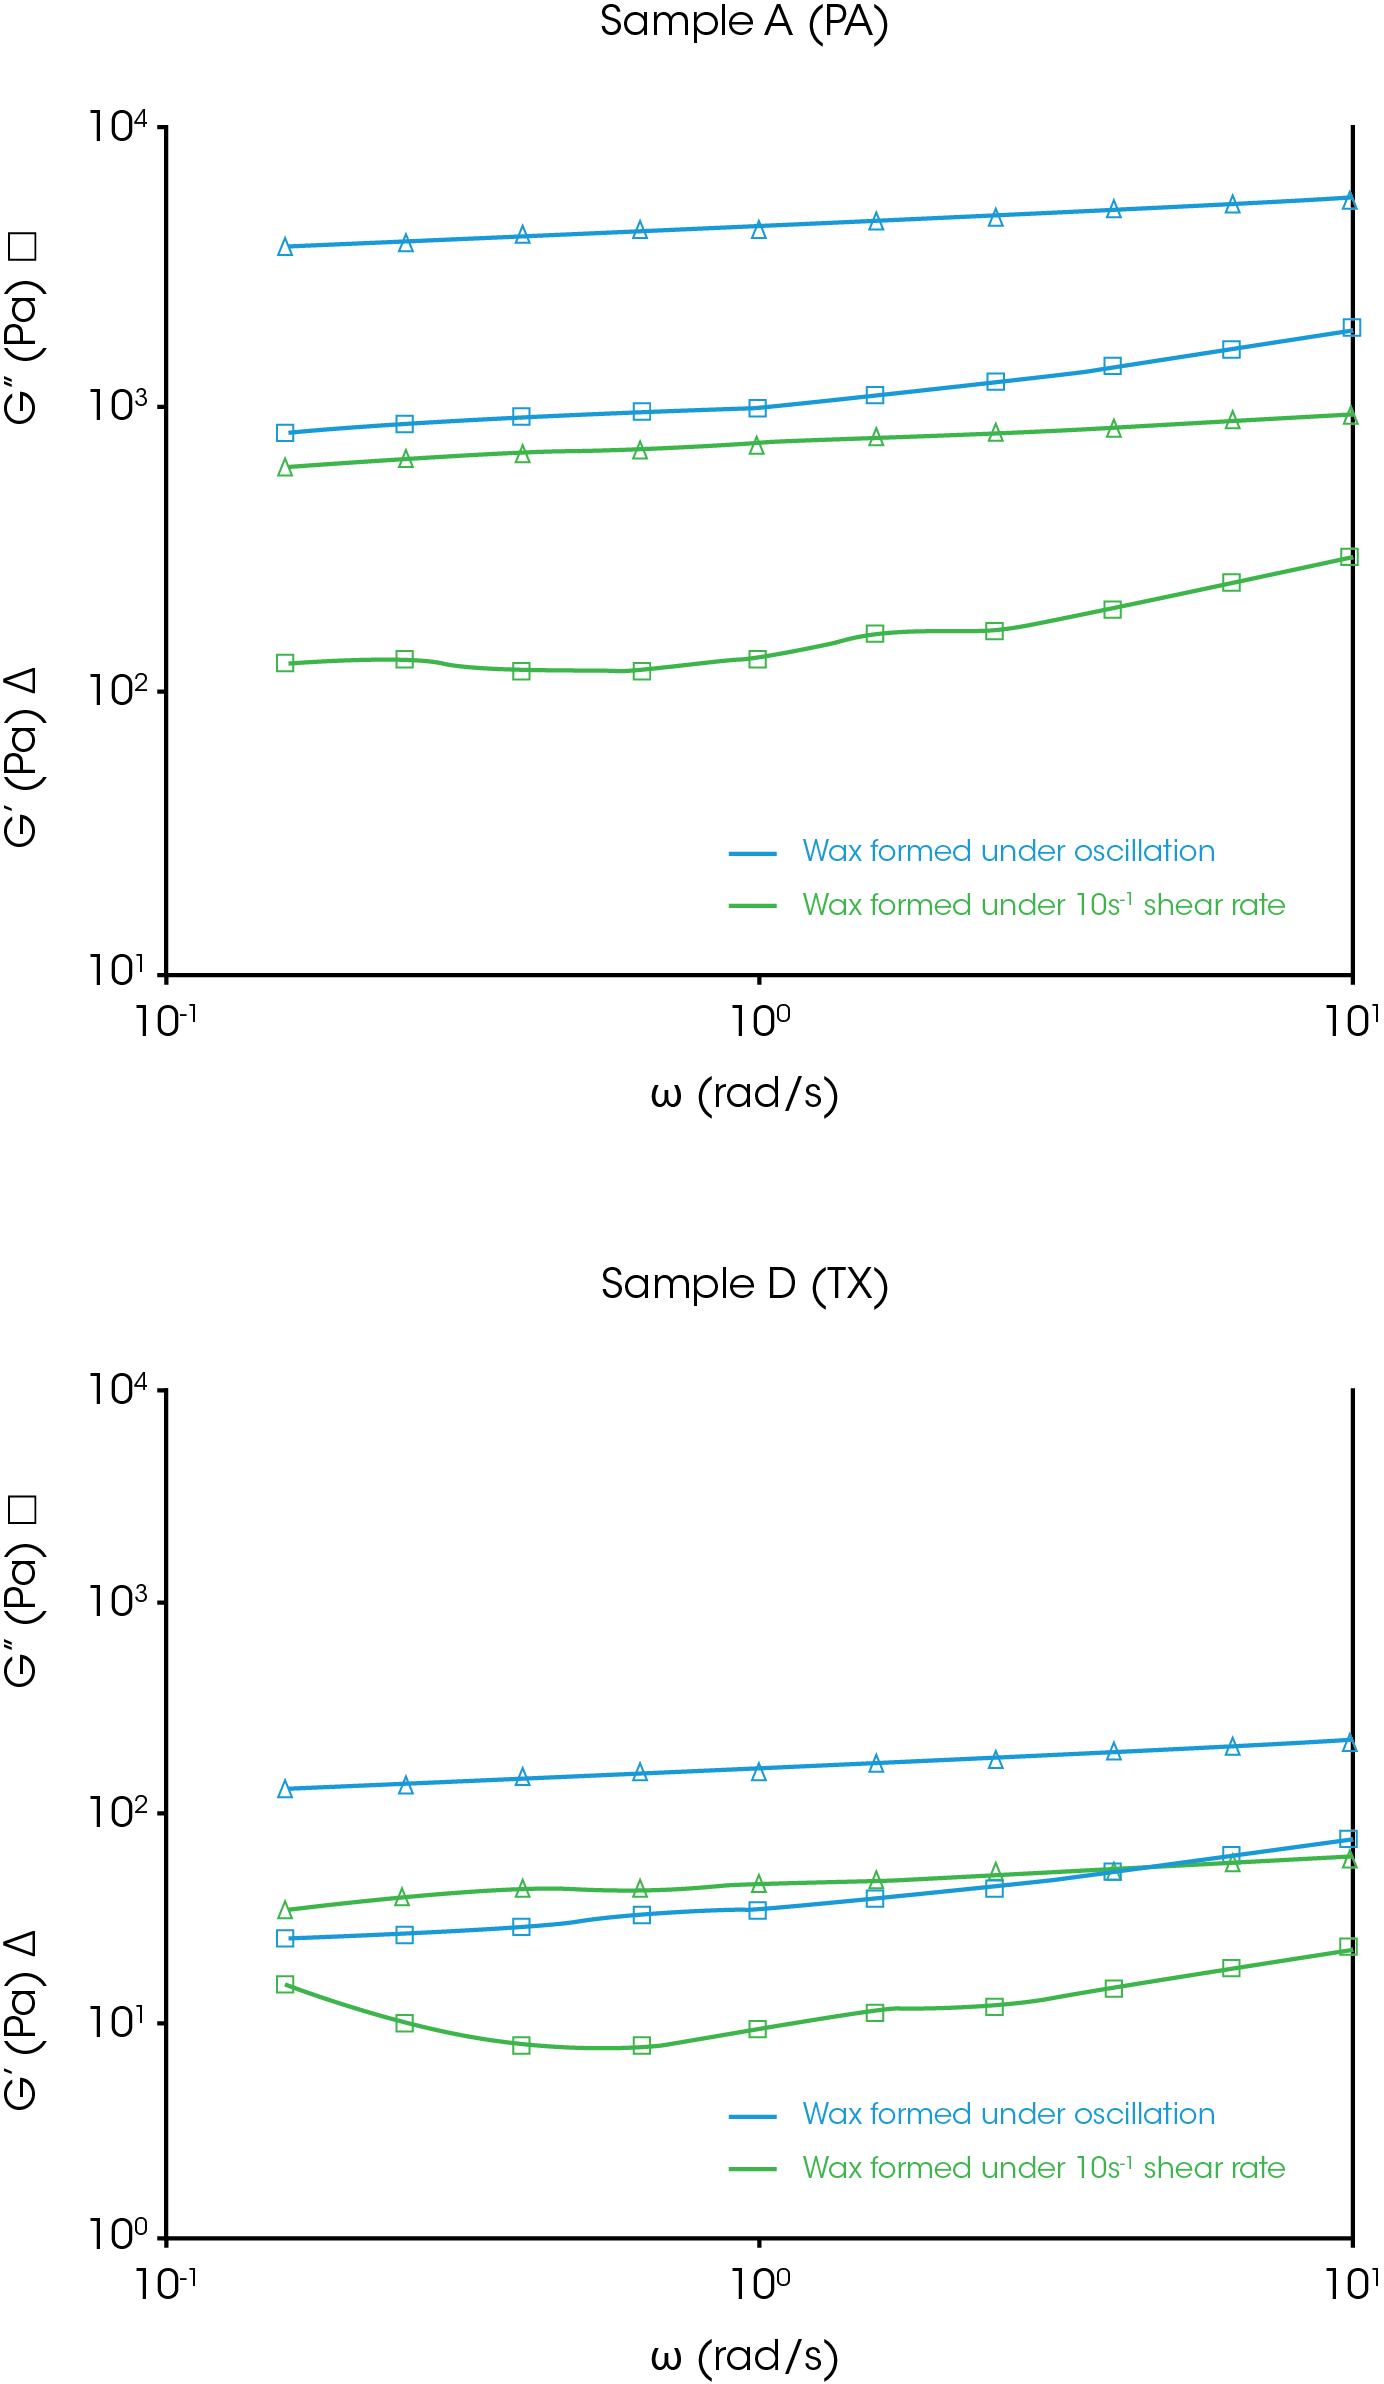
In order to further investigate the differences observed in Figure 7, samples A (PA) and D (TX) were cooled to 0 °C under different conditions. In one case, the samples were cooled at 1 °C/min while subjected to a low-strain or small-amplitude oscillation to simulate waxation under quiescent conditions. In the second case, the samples were cooled using the same thermal profile while being subjected to a γ̇ of 10 s-1 to simulate wax formation under conditions of flow. In both cases, the formed waxes were equilibrated at 0 °C after cooling and subsequently subjected to a frequency sweep. The data are shown in Figures 8 below.
It can be observed that for both samples, G’ is higher than the corresponding G” with a slope of G’ vs ω ~ 0.1 indicating that the waxes may have a gel-like network structure. It is interesting to note that the G’ and G” of the waxes formed under quiescent conditions is about an order of magnitude higher than the corresponding G’ and G” of waxes formed under flow conditions. This underscores the importance of consistent thermal and mechanical history when performing comparative studies, especially when studying sensitive changes in waxation of crude oil. Further comparison shows that under identical thermal and mechanical history, G’ of sample D (TX) is higher than that of sample A (PA) indicating that the waxy gels are much stronger for sample D (TX). This is coherent with the trends observed in the yield stress measurements.
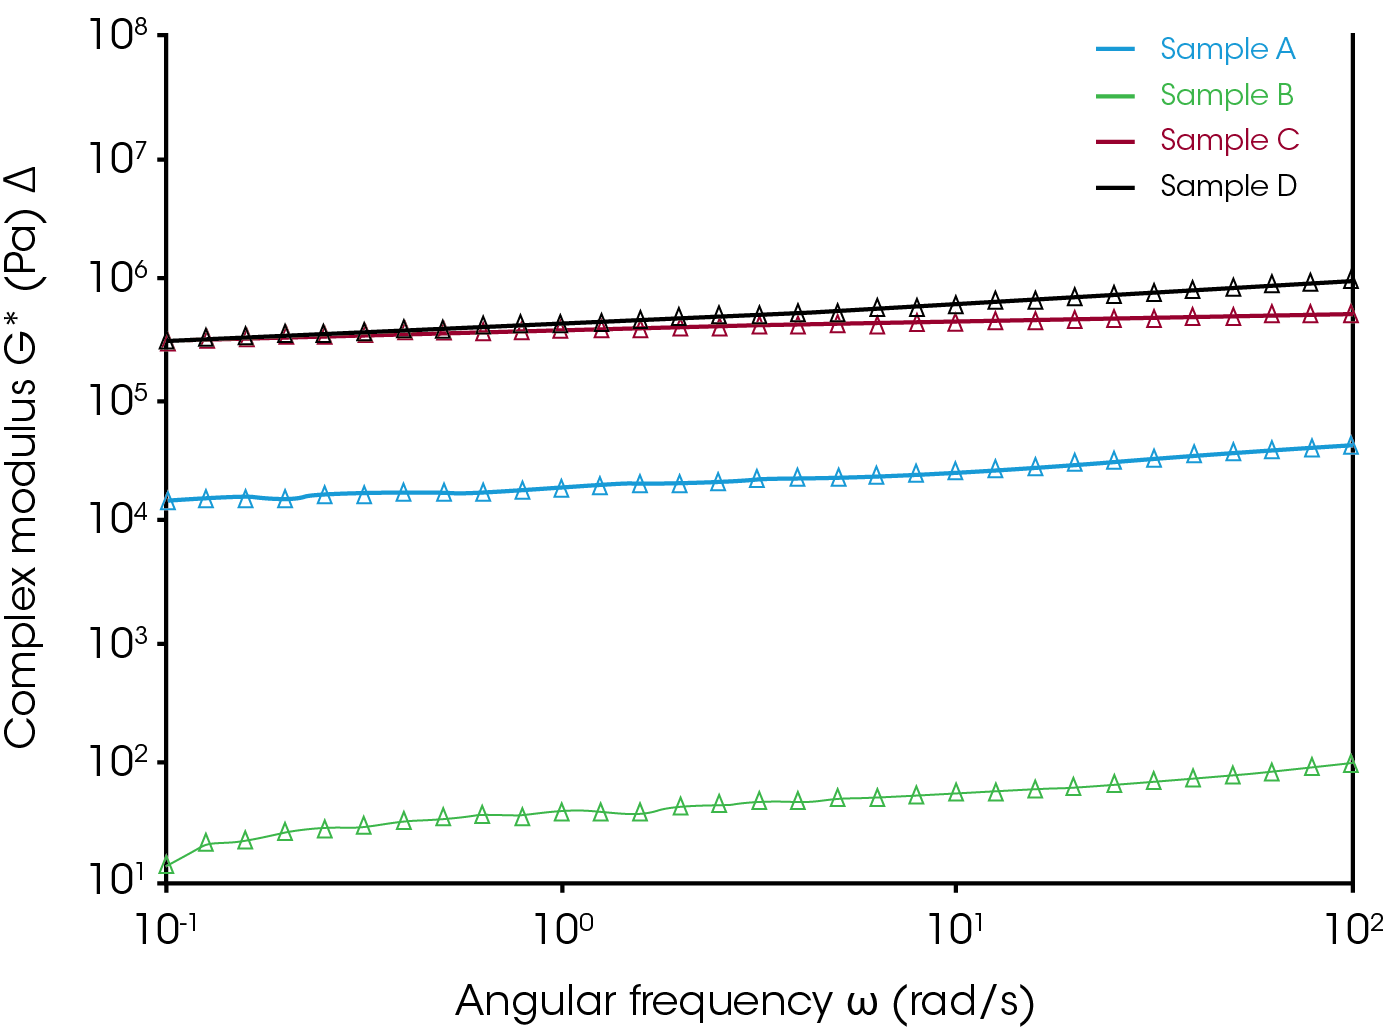
Similar comparisons were performed for samples A-D. The test temperature was chosen as -40 °C so that it is sufficiently below the WAT for all the samples. A dual-stage peltier plate equipped with an insulated solvent trap and heat-break parallel plate geometries ensured that the uniformity and accuracy of temperature. The complex modulus (G*) which is a measure of the total strength of the material, including both elastic (G’) and viscous (G”) contributions is used for comparison. The data is presented in Figure 9.
The G* of the waxes formed from samples C (AK) and D (TX) is significantly higher than sample A (PA) and B (ND) indicating that the network microstructure for the waxes are different. A similar trend was observed for G’ and G”. Fundamentally, the above differences in G* motivate further investigations into the microstructure of the sample using additional analytical techniques and relate it to differences in chemistry. From an application standpoint, the modulus data provides a measure of the strength of the waxy network formed under different conditions which can be used for further flow assurance studies.
Conclusion
The crystallization of the waxy components in crude oil is an important transition that needs to be well-characterized and understood to ensure the smooth transportation of crude oil across the globe. Thermo-rheological measurements are critical to understand the changes in the flow properties of the crude oil with respect to temperature. Rheological measurements performed using a sensitive, state-of-the-art rheometer such as the ones offered by TA Instruments allow these measurements to performed precisely and accurately in a convenient manner. It allows for a facile comparison of outwaxing temperature of different crude oil formulations as well as determine the mechanical properties of the waxes formed in a complex chemical environment. These studies can also be applied to other products of the oil and gas industry such as fuels and distillates.
References
- R. F. G. Visintin, R. Lapasin, E. Vignati, P. D’Antona, and T. P. Lockhart. “Rheological behavior and structural interpretation of waxy crude oil gels”. Langmuir (2005), 21(14), 6240-6249.
- Dimitriou C. PhD Thesis Massachusetts Institute of Technology “The rheological complexity of waxy crude oils: Yielding, thixotropy and shear heterogeneities” June 2013.
- Sousa, A.L., Matos, H.A. & Guerreiro, L.P. J Petrol Explor Prod Technol (2019), 9, 2091
- Adhia Y. “Use of Thermal Analysis and Rheometry to Study the Properties of Crude Oil” presented at American Institute of Chemical Engineers conference in November 2019
Acknowledgement
This note was written by Yash Adhia, Senior Applications Support Engineer at TA Instruments.
Click here to download the printable version of this application note.

