Keywords: MTMA, Modulated Thermal Analysis, Deconvolution, Reversing and Nonreversing Components, Thermal Analysis
TA311
Abstract
In modulated thermal analysis, a sinusoidally varying temperature program is added to an underlying linearly changing or static temperature program. Fourier transformation of the oscillatory temperature “forcing function” and the result dependent variable provides the deconvolution of these signals into reversing and nonreversing components. The reversing signal is associated with properties dependent upon the temperature rate of change while the nonreversing signal defines kinetic events (that is, those associated with both time and temperature). Thus for modulated thermomechanical analysis (MTMA™), coefficient of thermal expansion is observed in the reversing signal and stress relaxation, softening and heat shrinking are observed in the nonreversing signal. The ability of MTMA to measure both expansion and contraction simultaneously is demonstrated on samples including thermoset composite printed circuit boards and heat-shrink packaging film.
Introduction
Reading introduced modulated temperature thermal analysis in 1993 (1) with what has become known as modulated differential scanning calorimetry (Modulated DSC®, MDSC®). This was followed a few years later by Blaine who reported on modulated thermogravimetry (MTGA™) (2) and by Price with modulated thermomechanical analysis (MTMA) (3). All of these approaches are commercially available from TA Instruments (New Castle, DE).
The impact of modulated temperature measurements on thermal analysis can hardly be underestimated. One leading observer has called modulated DSC “the greatest advance in DSC since its inception” (4). And nearly half of the articles published in thermal analysis journals now feature one of the modulated temperature techniques.
In modulated temperature thermal analysis, a sinusoidal temperature “forcing function” is added to the traditional linear (or isothermal) underlying heating rate. This forcing function induces in the sample a sinusoidal response that may be deconvoluted to yield reversing and nonreversing information.
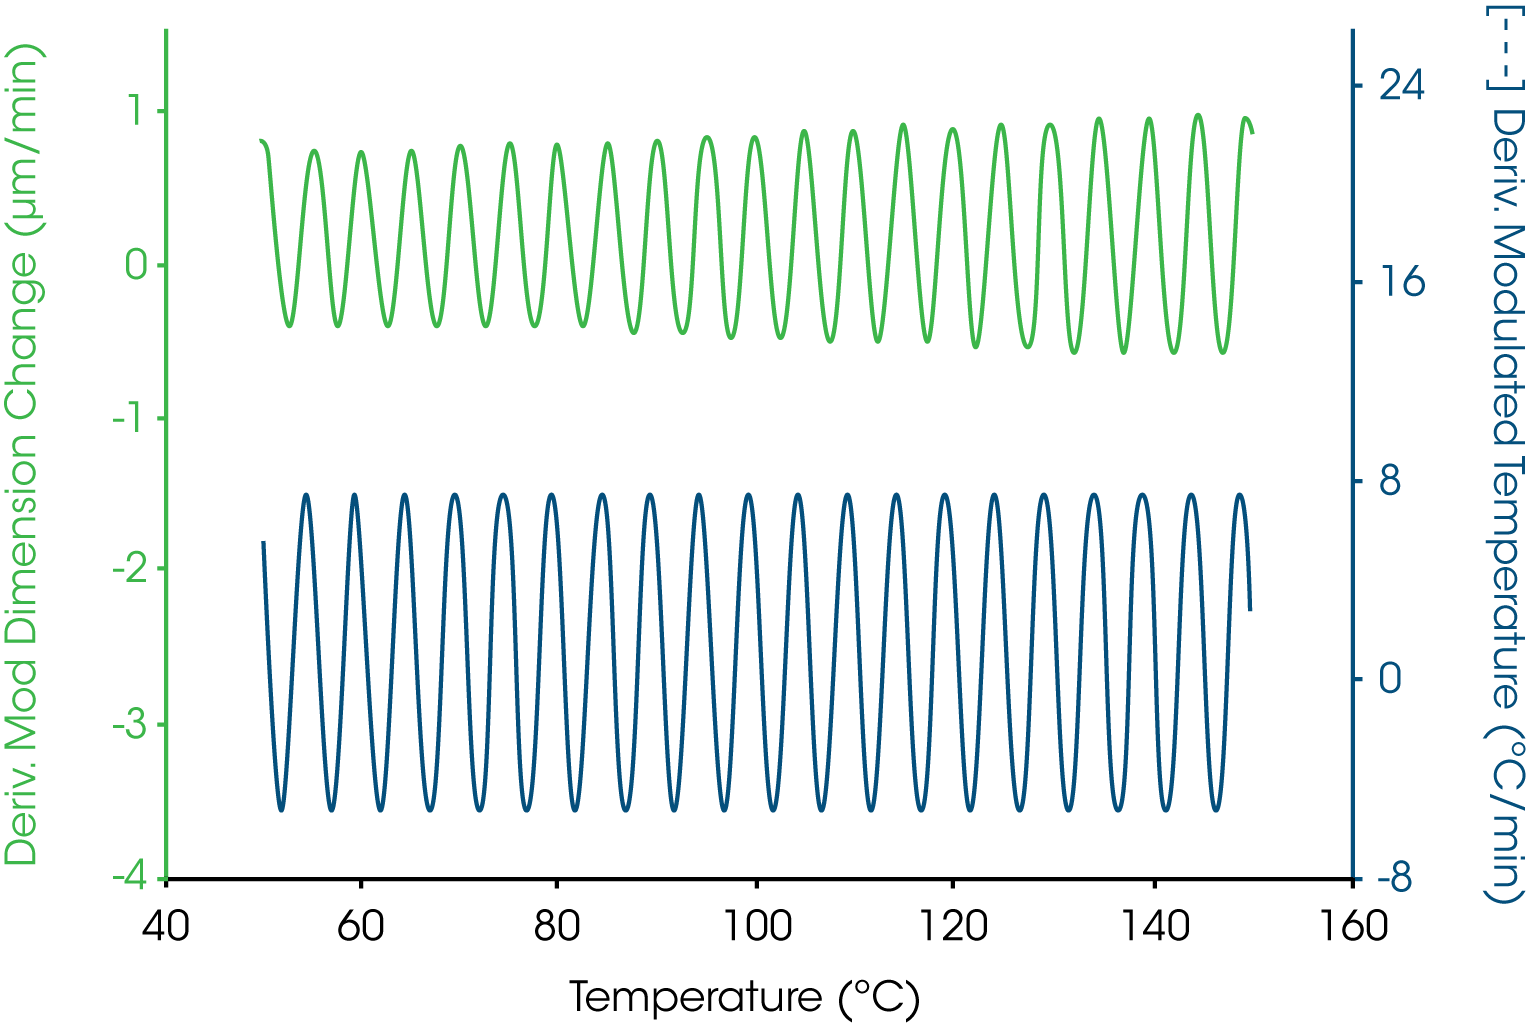
When applied to thermomechanical analysis (TMA), the temperature modulation produces a sinusoidal change in test specimen length. Figure 1, for example, shows the modulated temperature at the figure bottom and the length change at the top both as their first derivatives. Discrete Fourier transformation is applied in real time to continuously determine the average value and the amplitude value for each signal.
The governing equation for MTMA is given by (3):
dL/dt = A dT/dt + f (t, T) (1)
where L is length, T is temperature, t is time, A is expansivity, and f(x) is “some function of…”. The left hand term of equation 1, known as the total length change rate, is shown on the right to be composed of two parts; a reversing contribution proportional to the time rate of change of the independent parameter (temperature) and a nonreversing contribution from the absolute value of that independent parameter.
Of course in TMA, the dependent parameter measured is length (not the time rate of change of length) so the governing equation takes on the form of:
Ltotal = Lreversing + Lnonreversing (2)
where Ltotal is the average length from the Fourier deconvoltion, Lreversing is the (length amplitude / temperature amplitude) ∫ dT/dt K. The “average length”, “length amplitude” and “temperature amplitude” are the signals derived from the Fourier transformation process. ∫ dT/dt is the underlying heating rate averaged over a single period while K is a calibration constant close to unity. The nonreversing length is obtained from the difference between the total and reversing contributions.
Lnonreversing = Ltotal – Lreversing (3)
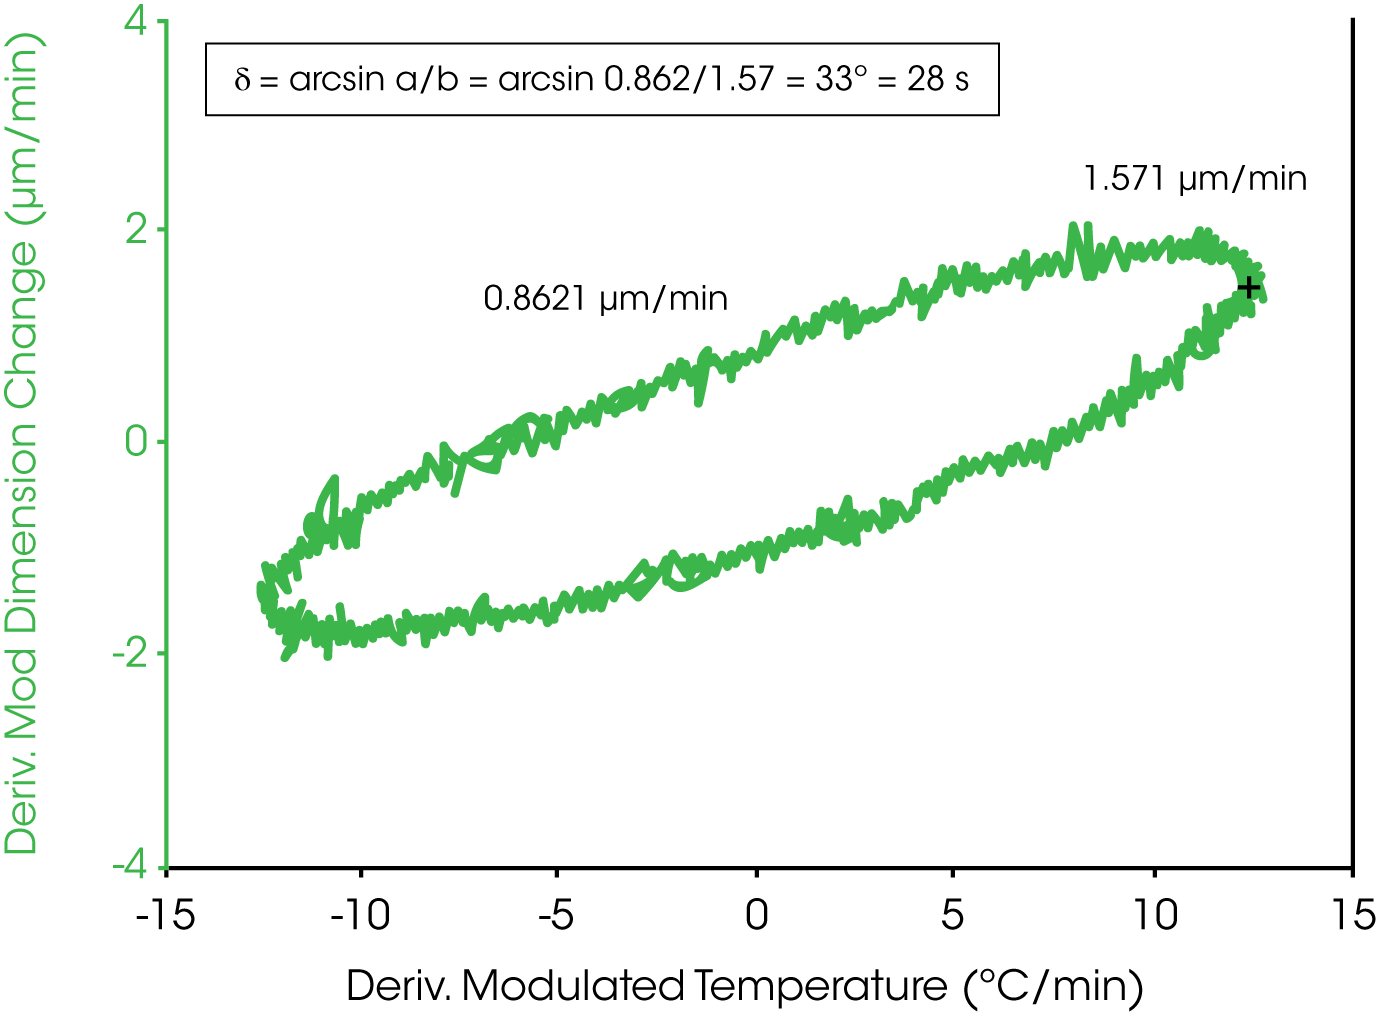
There is always a “lag” between the applications of the forcing function and the resultant response. The use of sinusoidal forcing functions provides for the easy measurement and interpretation of the magnitude of this lag through the use of a Lissajous plot such as the shown in Figure 2. Evaluation of the midpoint and extrema values of the Lissajous figure yields the phase lag. In MTMATM, this lag is rather large compared to other modulated temperature techniques, about 28 s, due to the large thermal mass and low thermal conductivity of the quartz sample stage and measuring probe. A practical rule-of-thumb is that the period of the applied forcing function should be about ten times the time constant. So for MTMA, a period of about 300 seconds is used. The applied temperature amplitude is selected based upon the value of the expansivity value A in equation 1, but is typically ± 5 °C. And as with all modulated temperature approaches, at least 5 cycles is required across a transition in order to have reliable Fourier deconvolution. This results in the typical underlying heating rate of 2 °C/min or less.
The value of the calibration coefficient is determined, as is the length change calibration of the TMA (5), from the use of a reference material with a known CTE value. We used copper for this purpose as it has no nonreversing or kinetic behavior in the region of interest between 50 and 150 °C.
Results and Discussion
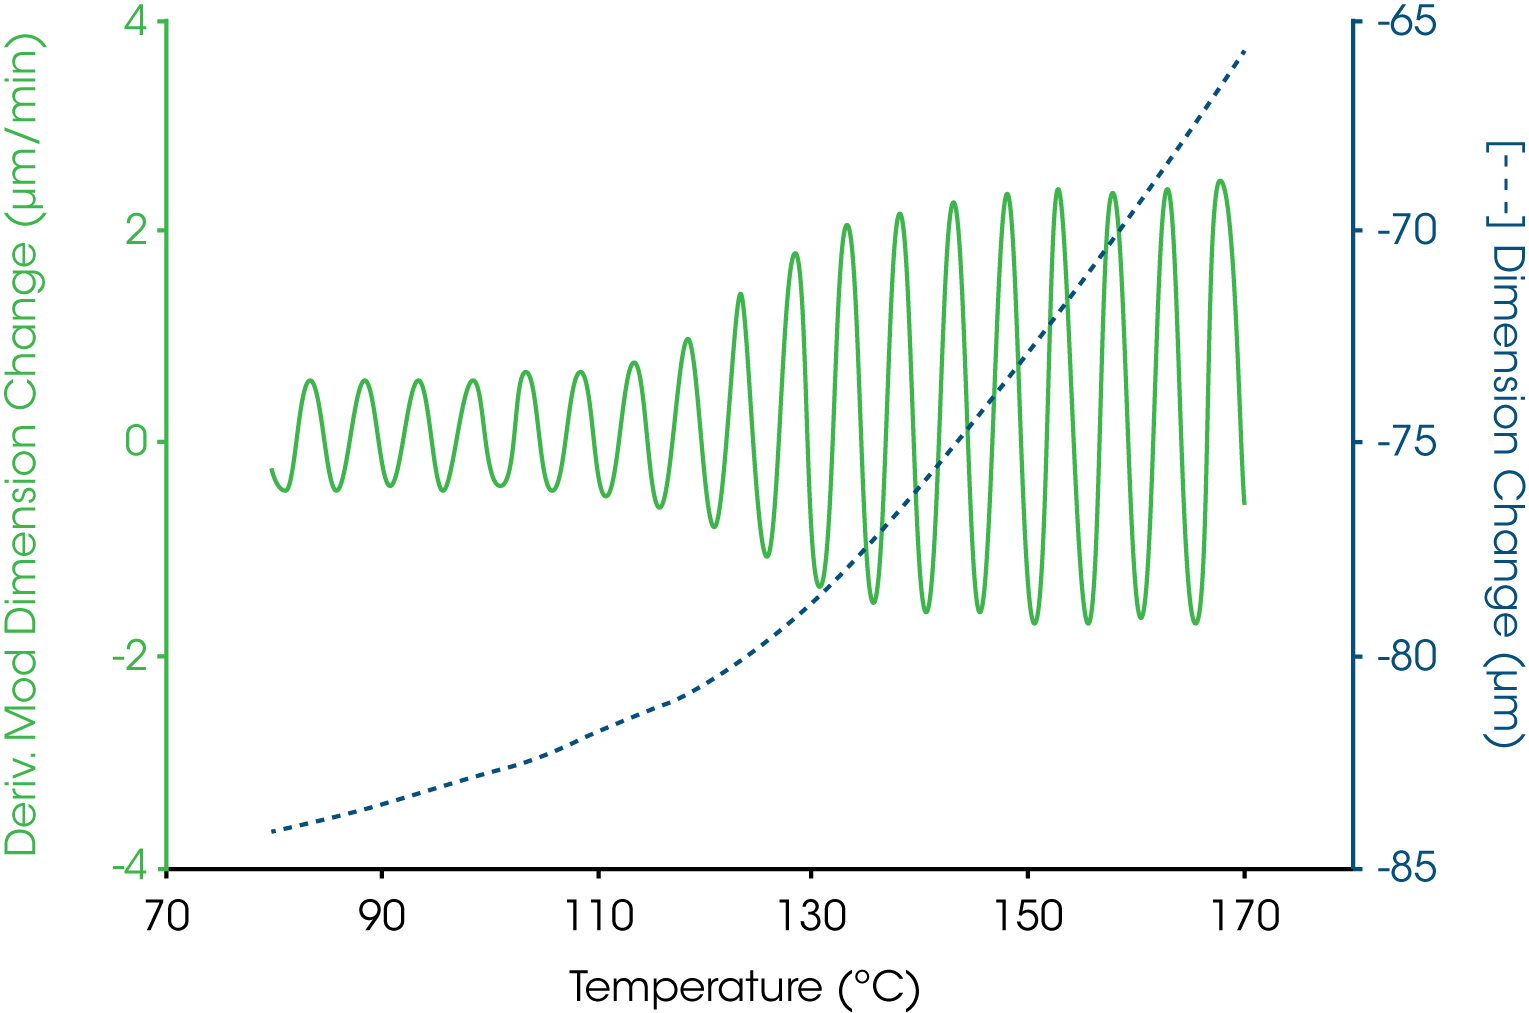
Figure 3 shows the dimension (i.e., Ltotal) and modulated dimension signals for a cured thermoset sample undergoing a change in coefficient of linear thermal expansion. Where there is no nonreversing phenomenon, the amplitude of the modulated dimension derivative is proportional to the coefficient of linear thermal expansion. The expansion is proportional to the amplitude of this signal. As the expansion increases so does the oscillatory dimension amplitude signal.
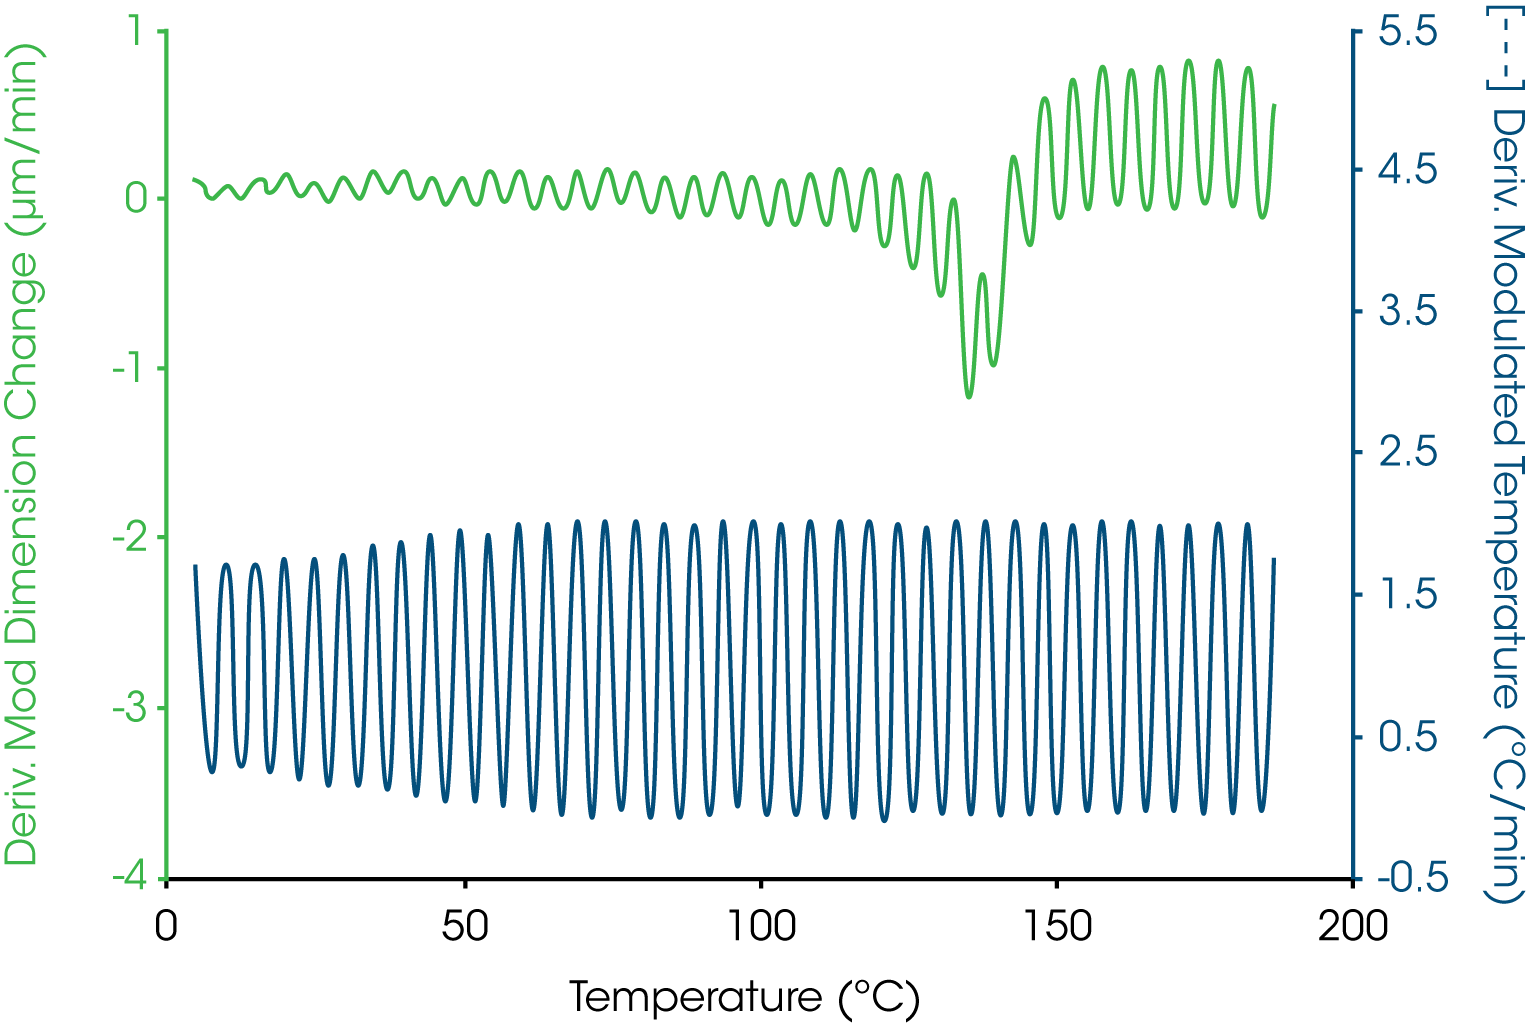
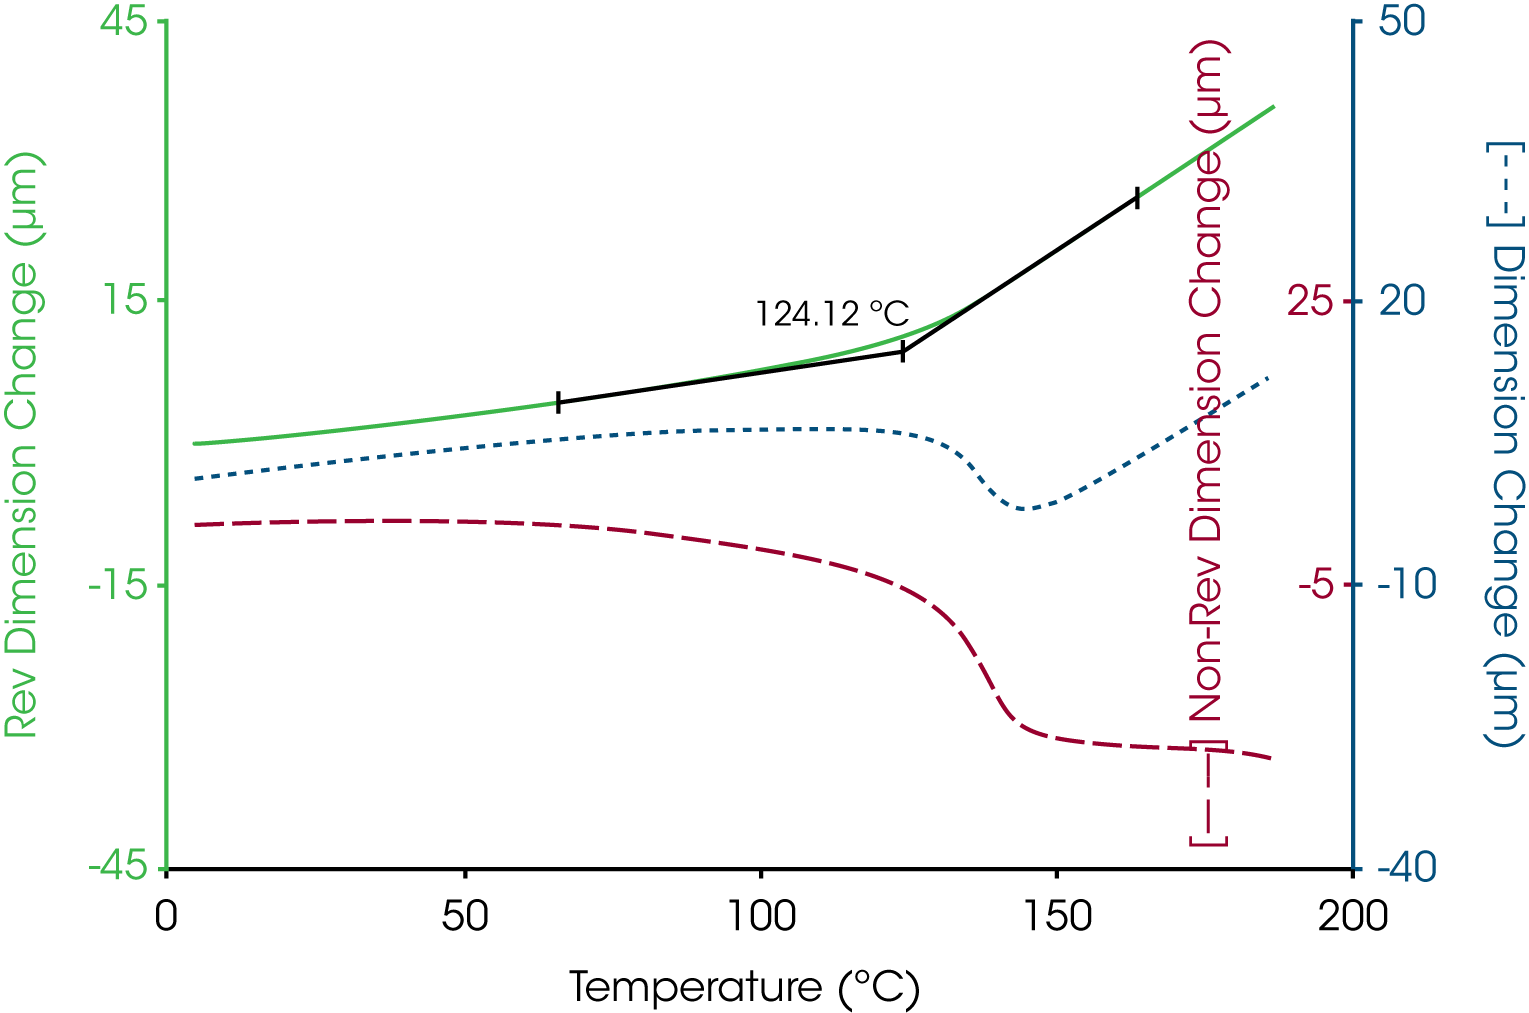
A more complicated example is shown in Figure 4 where the oscillatory temperature signal is shown at the bottom (as its derivative) while the modulated length signal is shown at the top. In this case both the amplitude and average value for the length change during the course of the experiment with a “peak” in the derivative curve appearing near 140 °C. The resultant total, reversing and nonreversing signals for this thermal curve are shown in Figure 5. The total dimension, presented in the middle curve shows the masking effect on the glass transition by the enthalpic recover transition typical of aged thermoset material. The enthalpic recovery causes the test specimen to shrink as it gains mobility upon passing through the glass transition. That is, the sample contracts (due to the enthalpic recovery) and expands (due to the glass transition) at the same time with the total length change reflecting the sum of these two events. The upper trace in Figure 5 shows the reversing expansion of the sample as a result of the increase in the coefficient of linear thermal expansion. The bottom nonreversing curve contains the shrinkage information resulting from the enthalpic recovery.
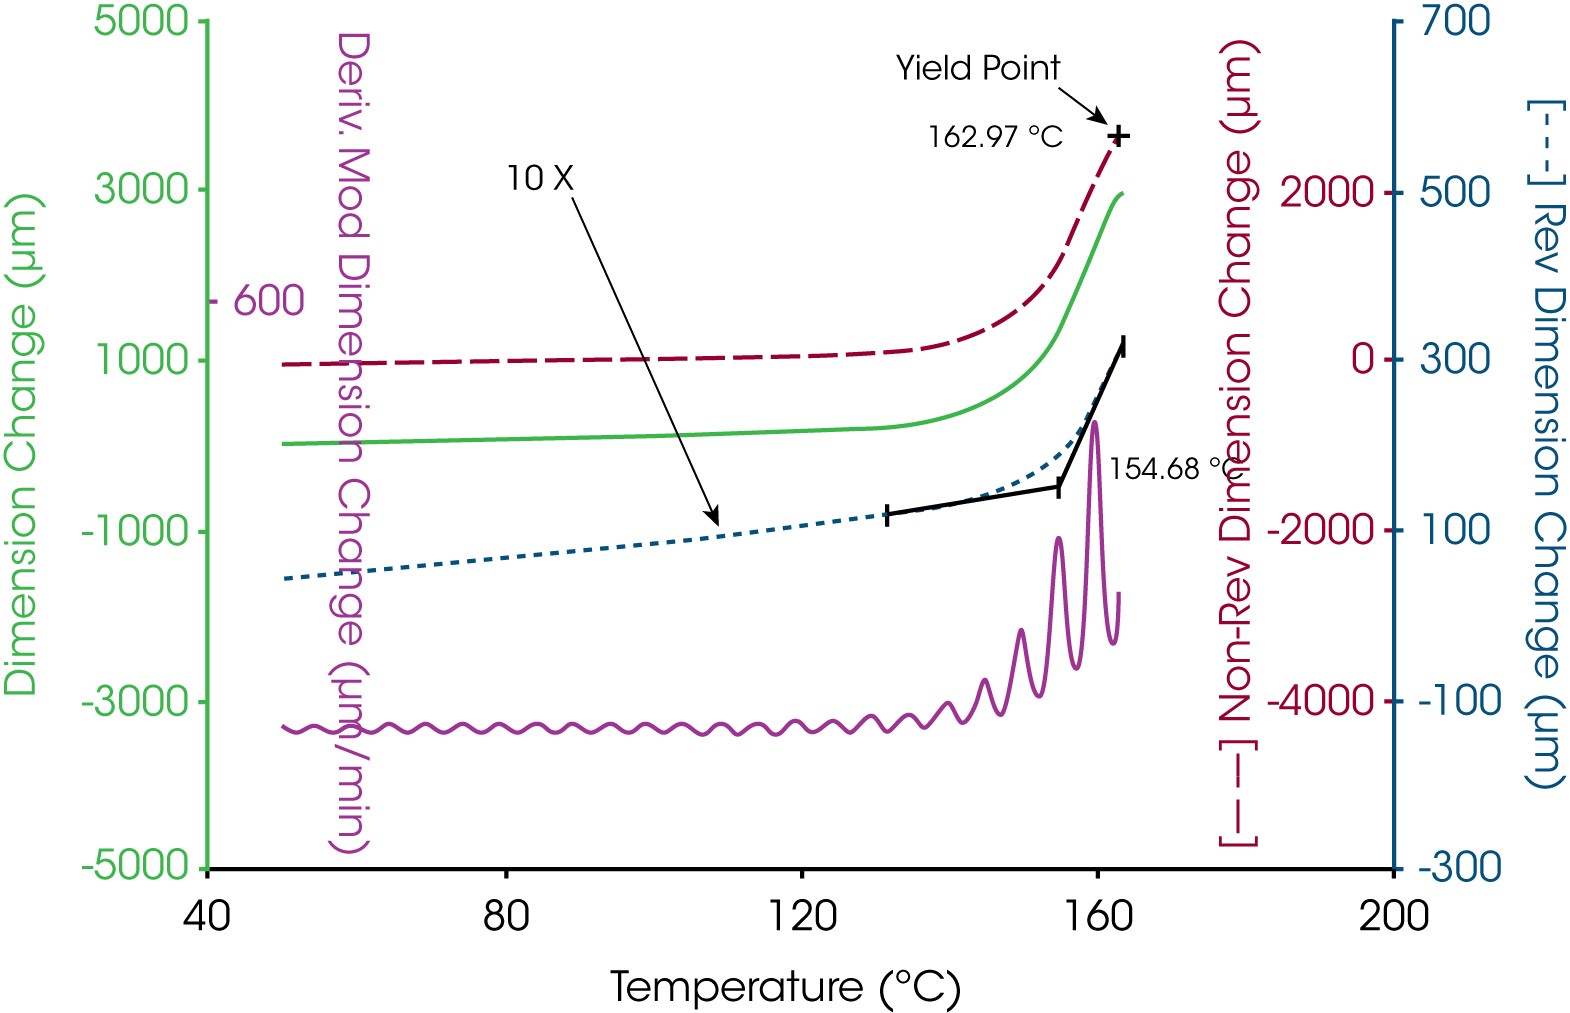
Another example is shown in Figure 6 for a thin polymer film examined in tension. As the sample goes through the glass transition, the expansion of the material increases. Additionally, the sample softens in the region of the glass transition and the sample begins to stretch under tension. The expansion is separated out into the reversing length change while the stretching is resolved into the nonreversing dimension change. In this case both the thermodynamic and kinetic components are in the same direction but are different in effect by an order of magnitude.
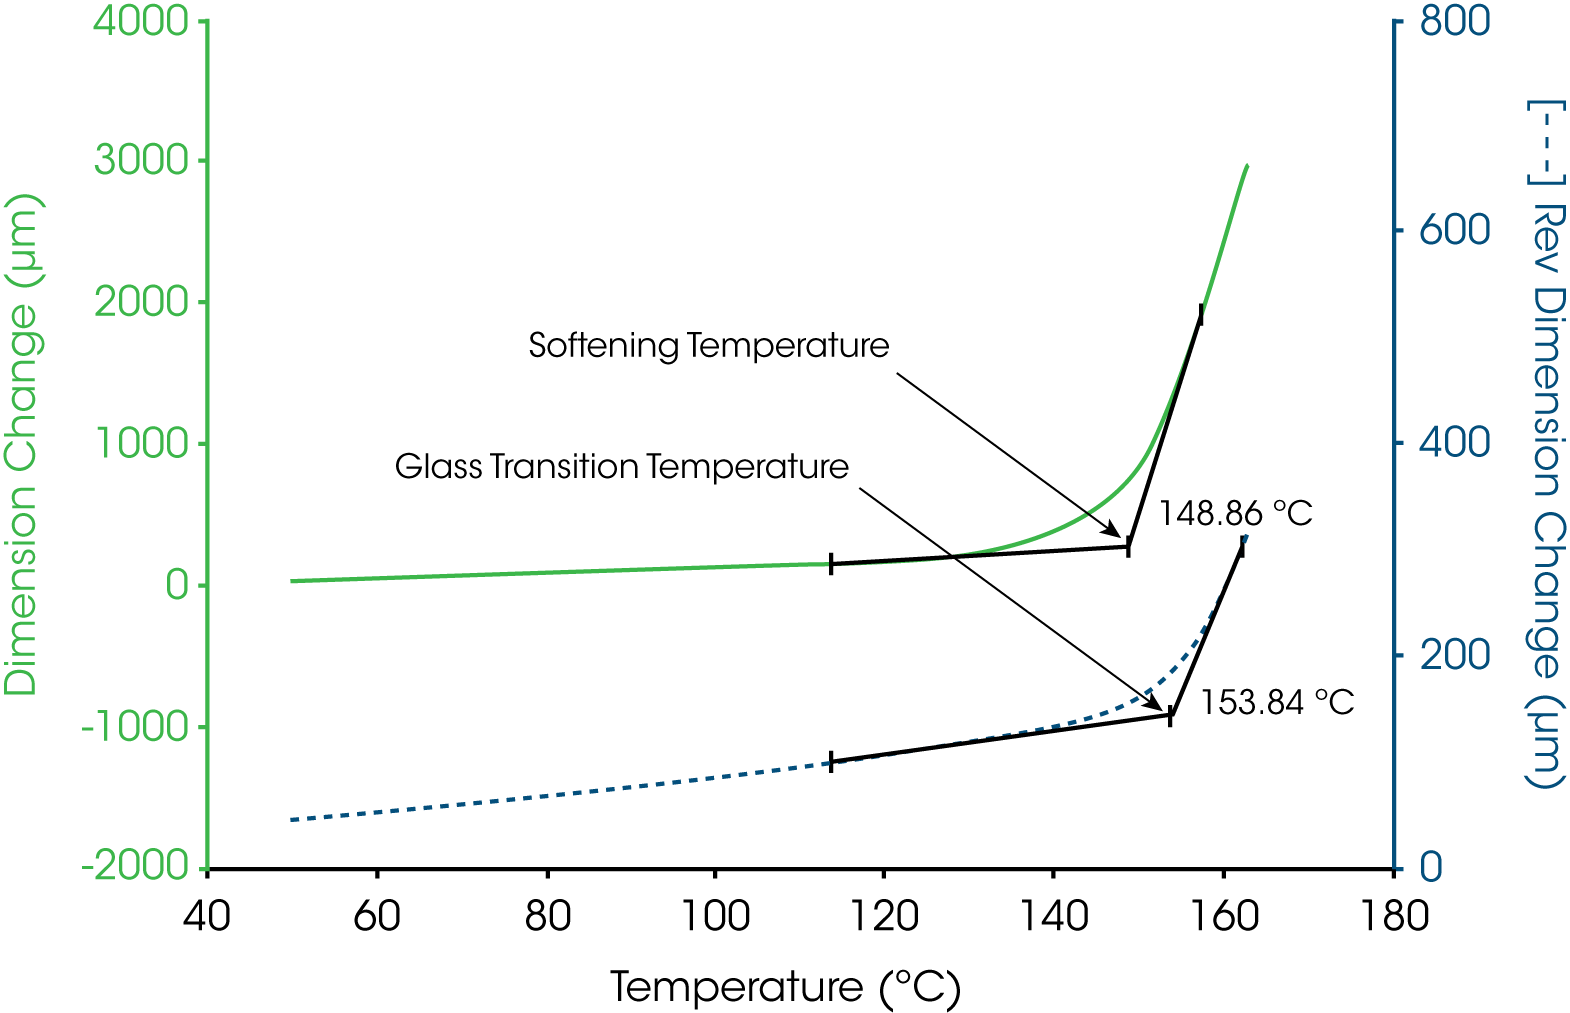
In TMA, the glass transition temperature is identified by the extrapolation of the linear portions of the expansion curve before and after the transition to their intersection (6). This value taken from the reversing length change curve corresponds to 154 °C. In some cases, the softening temperature, either as the extrapolated onset (6) or at a specific modulus value (7), is used to estimate the glass transition temperature. Figure 7 shows that the extrapolated onset from the soften curve estimate the glass transition at 149 °C, some 5 °C lower that that obtained from the change in linear expansion.
Summary
Modulated thermomechanical analysis is shown to be a useful tool for determining thermodynamic and kinetic, reversing and nonreversing length changes in materials when these thermally induced events take place simultaneously. This ability to separate thermodynamic from kinetic events aids in the interpretation of the thermal curve, measures expansion and contraction taking place at the same time and provides a more accurate estimation of the glass transition temperature than the softening temperature.
MTMATM may have applications in other measurements where thermodynamic and kinetic length changes occur simultaneously. Such examples may include the softening of organic or inorganic glasses, heat set films and fibers, and shape memory alloys.
References
- M. Reading, “Modulated Differential Scanning Calorimetry –A New Way Forward in Materials Characterization“, Trends in Polymer Science, 1993, 1, pp. 248-253.
- R. L. Blaine and B. K. Hahn, “Obtaining Kinetic Parameters by Modulated Thermogravimetry“, Journal of Thermal Analysis, 1998, 54, pp. 695-704.
- D. M. Price, “Novel Methods of Modulated Temperature Thermal Analysis“, Thermochimica Acta, 1998, 315, pp. 11-18.
- B. Wunderlich, Y. Jin and A. Bollar, “Mathematical Description of Differential Scanning Calorimetry Based on Periodic Temperature Modulation”. Thermochimica Acta, 1994, 238, pp. 277-293.
- E 2113, “Length Change Calibration of Thermomechanical Analyzers”, ASTM International, West Conshohocken, PA
- E 1545, “ Assignment of the Glass Transition Temperature by Thermomechanical Analysis”, ASTM International, West Conshohocken, PA.
- E 2092, “Distortion Temperature in Three-Point Bending by Thermomechanical Analysis”, ASTM International, West Conshohocken, PA
Acknowledgement
Click here to download the printable version of this application note.

