Keywords: Polyhydroxyalkanoate, poly-3-hydroxybutyrate, biocomposites, renewable polymer, green polymer, TGA, MTGA, evolved gas analysis, FTIR, mass spectrometry
TA478
Abstract
Renewable and biodegradable polymer resins are increasingly used to reduce the environmental impact of plastic waste. Thermal characterization of these resins is necessary to determine processability, stability, and fundamental properties. In this work, thermogravimetric analysis (TGA) was performed on a sample of poly-3-hydroxybutyrate (PHB). Onset of decomposition and three mass loss events were detected. Modulated TGA (MTGA) was used to determine the activation energy at the temperature where the highest rate of mass loss occurred for the two main mass loss events. Evolved gas analysis (EGA) combining TGA/FTIR/GCMS was used to determine decomposition products which include 2-butenoic acid, 3,6-Dimethyl-1,4-dioxane-2,5-dione, and various polymer chain fragments. Identification of the unknown sample by comparison to constructed composite FTIR spectra utilizing the vendor software shows good agreement with GC/MS data.
Introduction
The need to reduce the environmental impact of plastic waste has led to a great interest in renewable, biodegradable resins with properties similar to more common plastics like polypropylene and polyethylene. Thermal, physical, and rheological characterizations of these polymers are important for assessing stability, processability, and fundamental properties.
Polyhydroxyalkanoates (PHA) are biopolymers produced from microorganisms forming as water insoluble granules within the cytoplasm of the cell [1]. Poly-3-hydroxybutyrate (PHB) is the most studied PHA and a commercial sample with wood flour was obtained for this application note, which demonstrates the use of TGA, EGA, and MTGA as first steps in analyzing this polymer. The combination of these techniques allows characterization of decomposition, including decomposition products and activation energy. Tests were conducted using a TA Instruments™ Discovery™ 5500 TGA.
Experimental
Samples of PHA/wood flour composites with 3 mm nominal granule size were obtained from Sigma Aldrich (catalogue number GF28484343-1EA) for this work. The chemical structure of the material is shown in Figure 1. Neat samples were cut from the PHB pellets and used for the analyses.
The onset of decomposition, mass loss events, and temperature at 2% and 5% mass loss were detected using TGA. MTGA was then used to determine the activation energy at the highest rate of mass loss. Experimental conditions for the TGA and MTGA experiments are summarized in Tables 1 and 2, respectively.
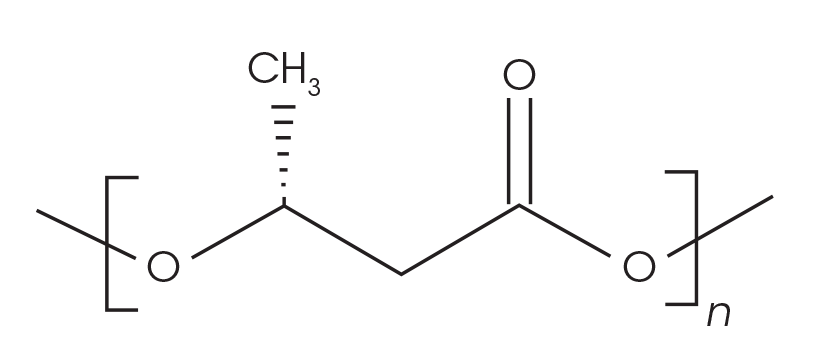
Table 1. TGA experimental conditions
| Instrument | TA Instruments Discovery 5500 TGA |
|---|---|
| Crucible | 100 µL platinum |
| Purge | N2 at 25 mL / min |
| Temperature Range | Ambient to 1000 °C |
| Heating Rate | 10 °C / min |
| Sample mass | 7 mg nominal |
Table 2. MTGA experimental conditions
| Instrument | TA Instruments Discovery 5500 TGA |
|---|---|
| Crucible | 100 µL platinum |
| Purge | N2 at 25 mL / min |
| Temperature Range | Ambient to 1000 °C |
| Sample Mass | 4 mg nominal |
| Heating Rate | 2 °C / min |
| Modulation Period | 200 second |
| Modulate Temperature Amplitude | +/- 5.00 °C |
Evolved Gas Analysis
To determine decomposition biproducts, EGA was done using the Discovery 5500 TGA using the TL9000 TGA/FTIR/GCMS interface system by RedShift srl with a Nicolet™ iS50 FTIR by Thermo Fisher Scientific Inc (Thermo). and a 7890 GC by Agilent Technologies, Inc., (Agilent) with a 5977B mass spectrometry detector (MSD). A schematic of the interface is shown in Figure 2 and a photograph of the system is shown in Figure 3.
A summary of the conditions used for the EGA work can be found in Table 3. The samples were not subjected to any thermal history before conducting the analyses. Mass losses were identified where the derivative of mass loss with respect to temperature reached the maximum. TGA data reduction was done using TA Instruments TRIOS™ software; FTIR and GC/MS data reduction was done using the vendor instrument software.

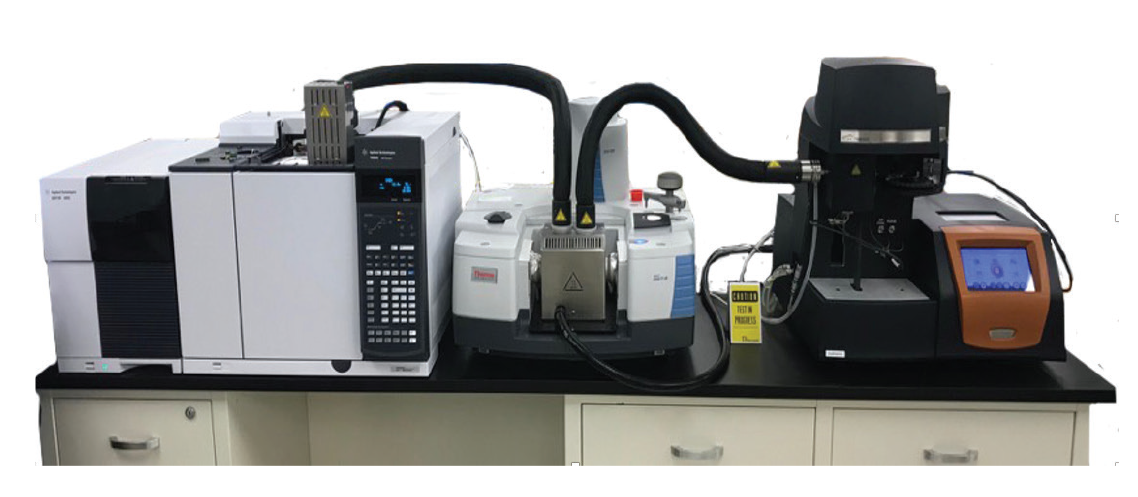
Table 3. EGA instruments and conditions
| Technique | Details |
|---|---|
| TGA | Discovery 5500 TGA, same conditions summarized in Table 1 |
| FTIR | Nicolet iS50 FTIR by Thermo; four scans, 4 cm-1 resolution |
| GC | 7890N GC by Agilent, HP 5MS 5% Phenyl methyl siloxane; 30m x 250 µm x 0.25 µm column |
| Mass Spec Detector | 5977B MSD by Agilent, mass range m/z 50-500 |
Results and Discussion
Thermogravimetric Analysis (TGA)
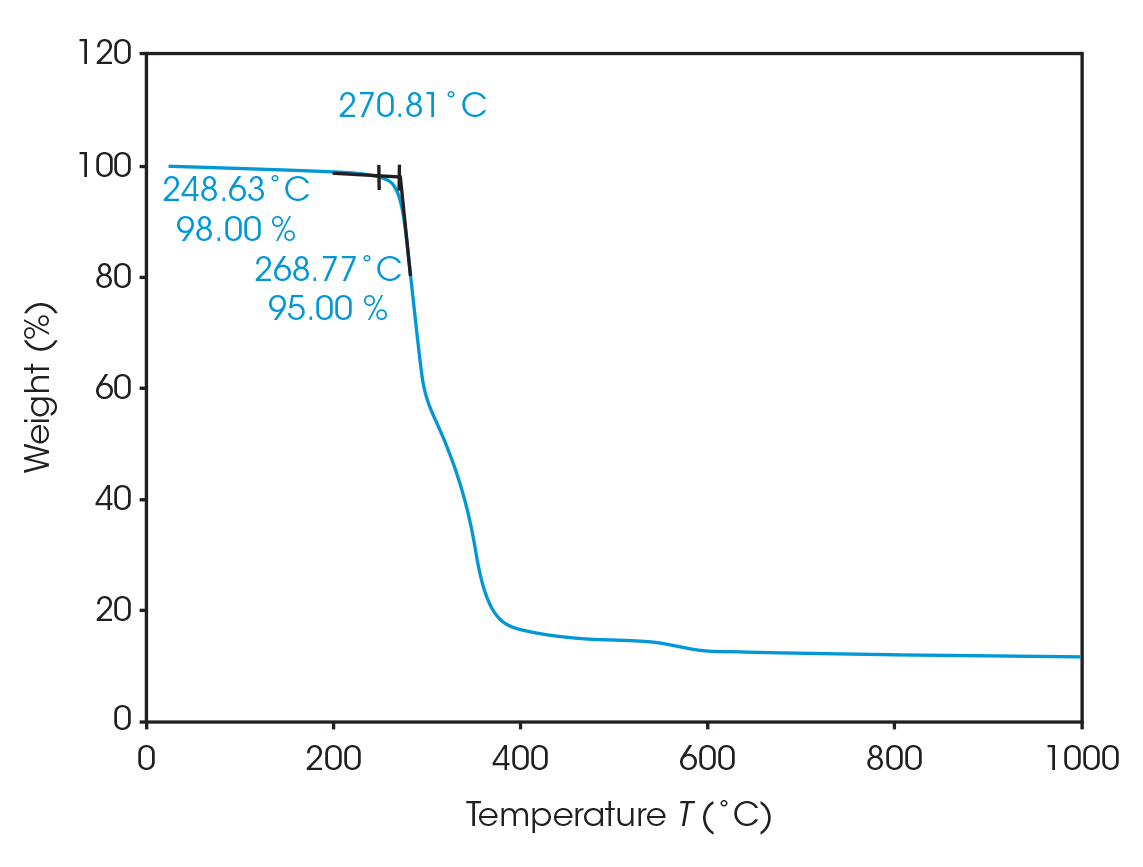
The onset of decomposition was determined to be 270.8 °C. Prior to this onset enough mass loss can occur to adversely affect material properties. At 248.6 °C, 2% mass loss occurs and 5% mass loss at 268.8 °C (Figure 4). This shows good agreement with a study by Arcos-Hernandez, et al [2].
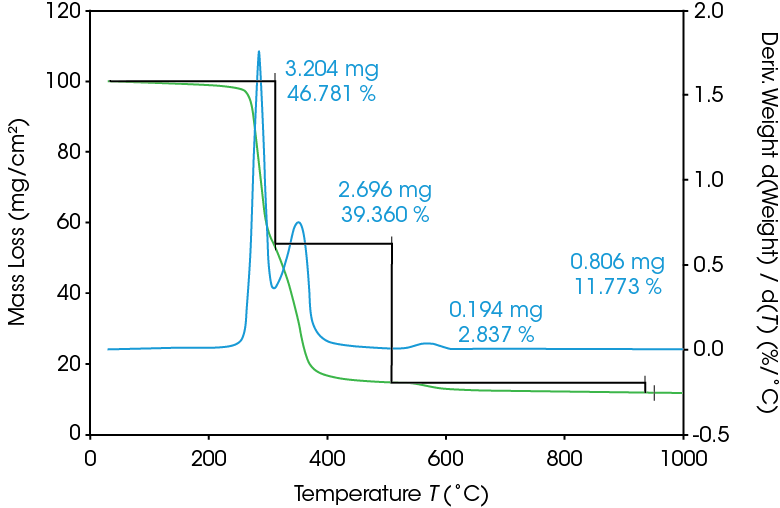
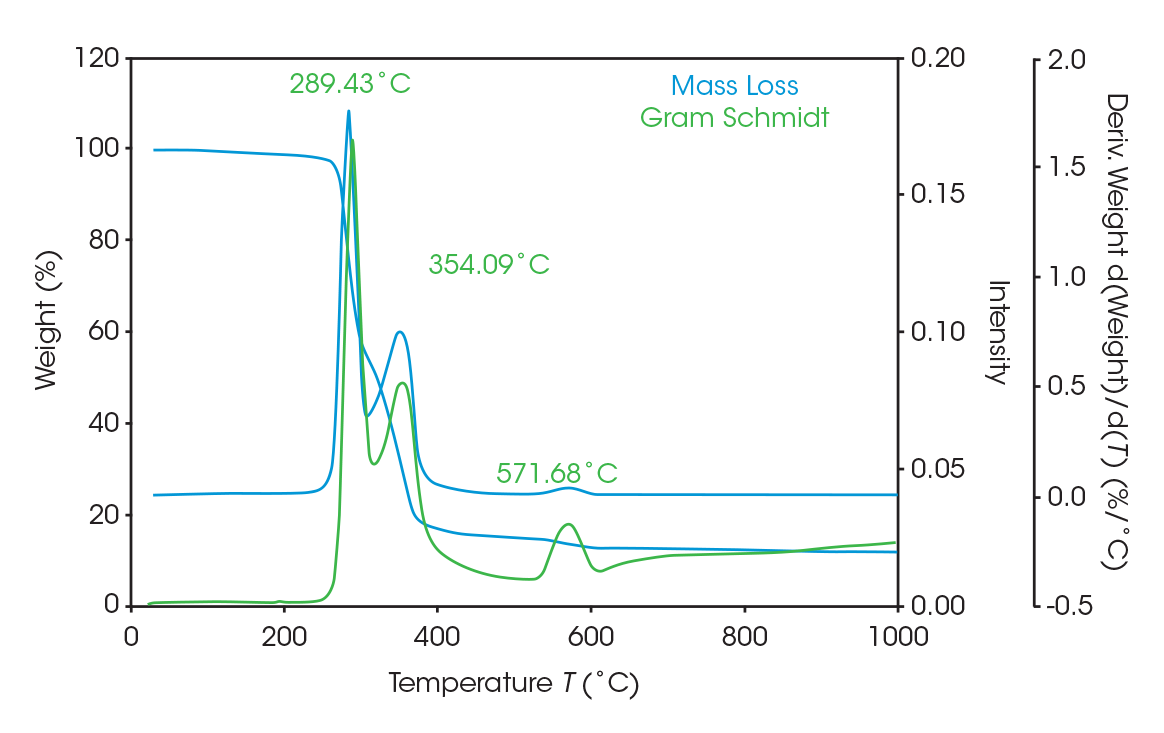
As seen in Figure 5, two large mass losses were observed: 46.78% with rate maximum at 289 °C and 39.36% with a rate maximum at 354 °C. A smaller mass loss with rate maximum at 572 °C was also observed. Residue of 11.77% remained. These results are summarized in Table 4.
Table 4. Summary of TGA mass losses
| Transition | Mass Loss (%) |
|---|---|
| 1st Mass Loss | 46.78 |
| 2nd Mass Loss | 39.36 |
| 3rd Mass Loss | 2.837 |
| Residue (%) | 11.77 |
Modulated TGA (MTGA)
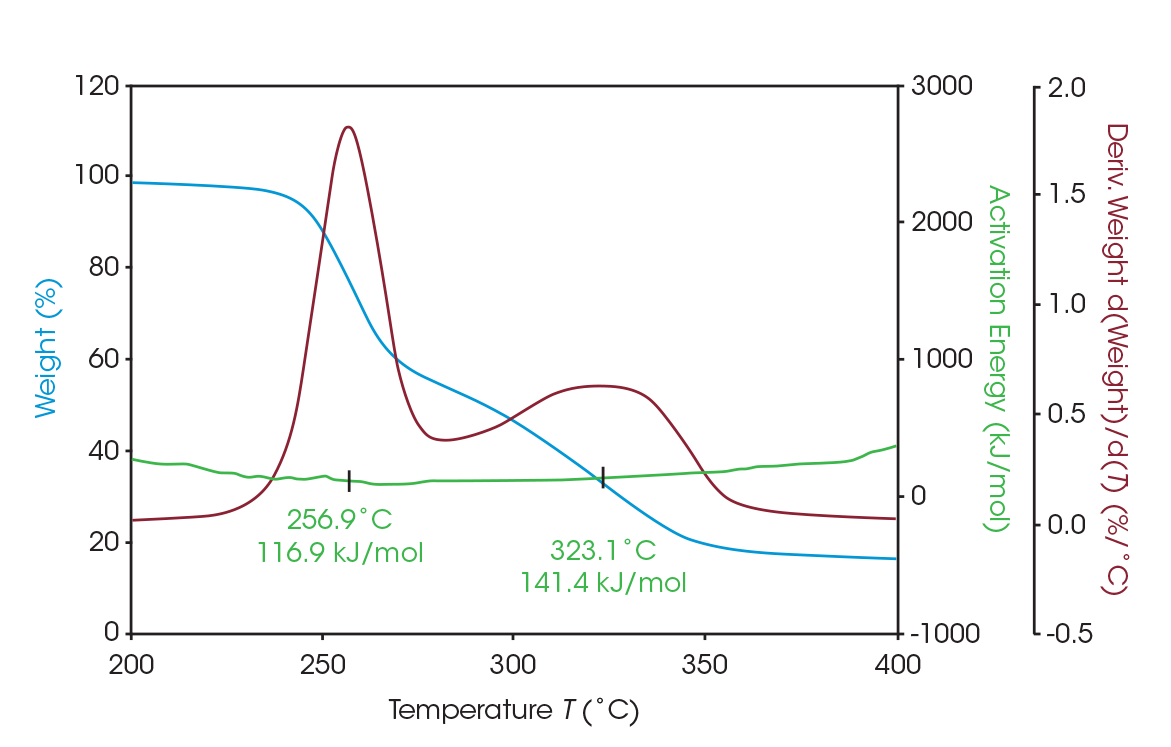
The activation energy of the two main mass losses were calculated using MTGA, in which the activation energy can be plotted as a discreet signal as a function of temperature or conversion with user-defined variables [3]. For the first mass loss, the activation energy is 116.9 kJ/mol; for the second, 141.4 kJ/mol. MTGA data is presented in Figure 6.
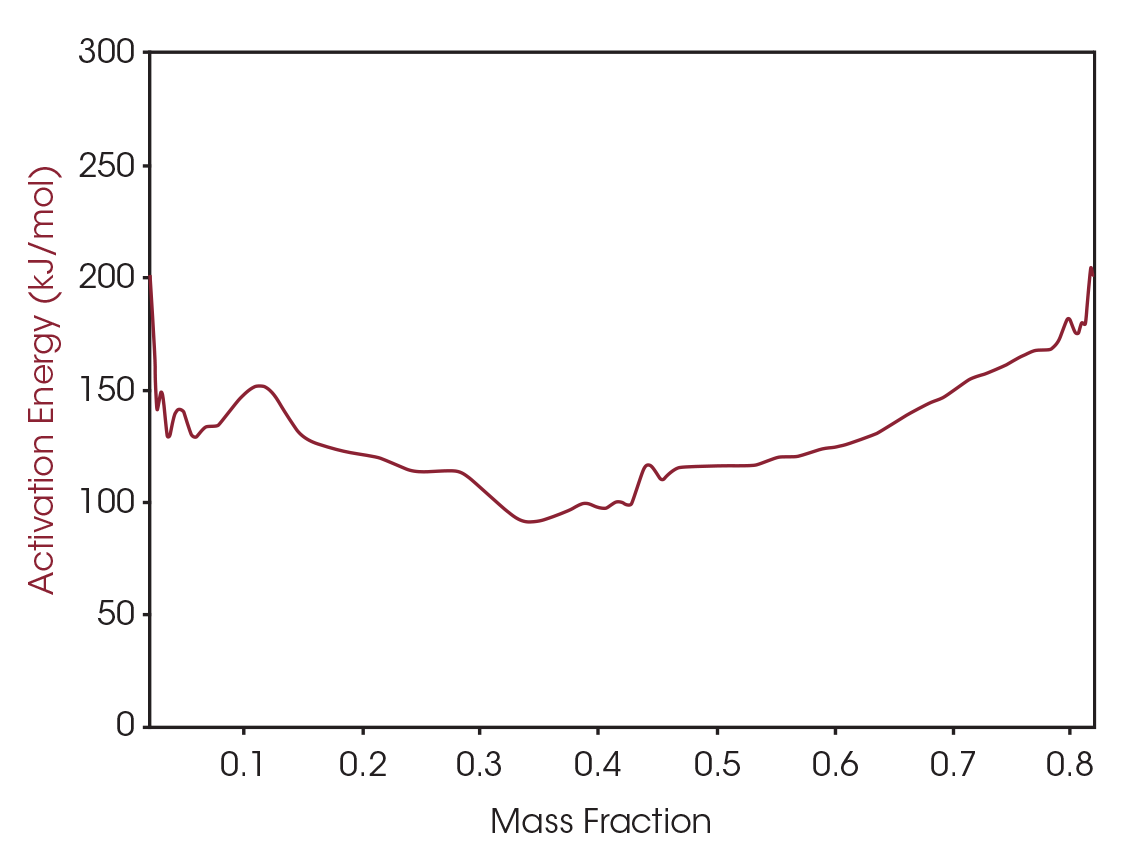
The activation energy can also be plotted as a function of mass fraction converted as shown in Figure 7. MTGA allows for activation energy to be plotted as a signal from one run, versus using several runs needed to calculate activation energy using the common Flynn and Wall method [4].
Evolved Gas Analysis (EGA)
Figure 8 Shows an overlay of the TGA mass loss with the derivative and the Gram-Schmidt reconstruction, which contains the FTIR spectral data. The data shows the similarity between the derivative and the Gram-Schmidt data. There are many methods to analyze and present the data. For this paper, mass loss events are identified at the temperature where the derivative of mass loss is at its local maximum. Coincidentally, this is typically where the Gram-Schmidt reconstruction has its local maximum. Careful inspection of the spectra throughout the entirety of the Gram-Schmidt reconstruction is necessary, and this is easily done with the instrument software.
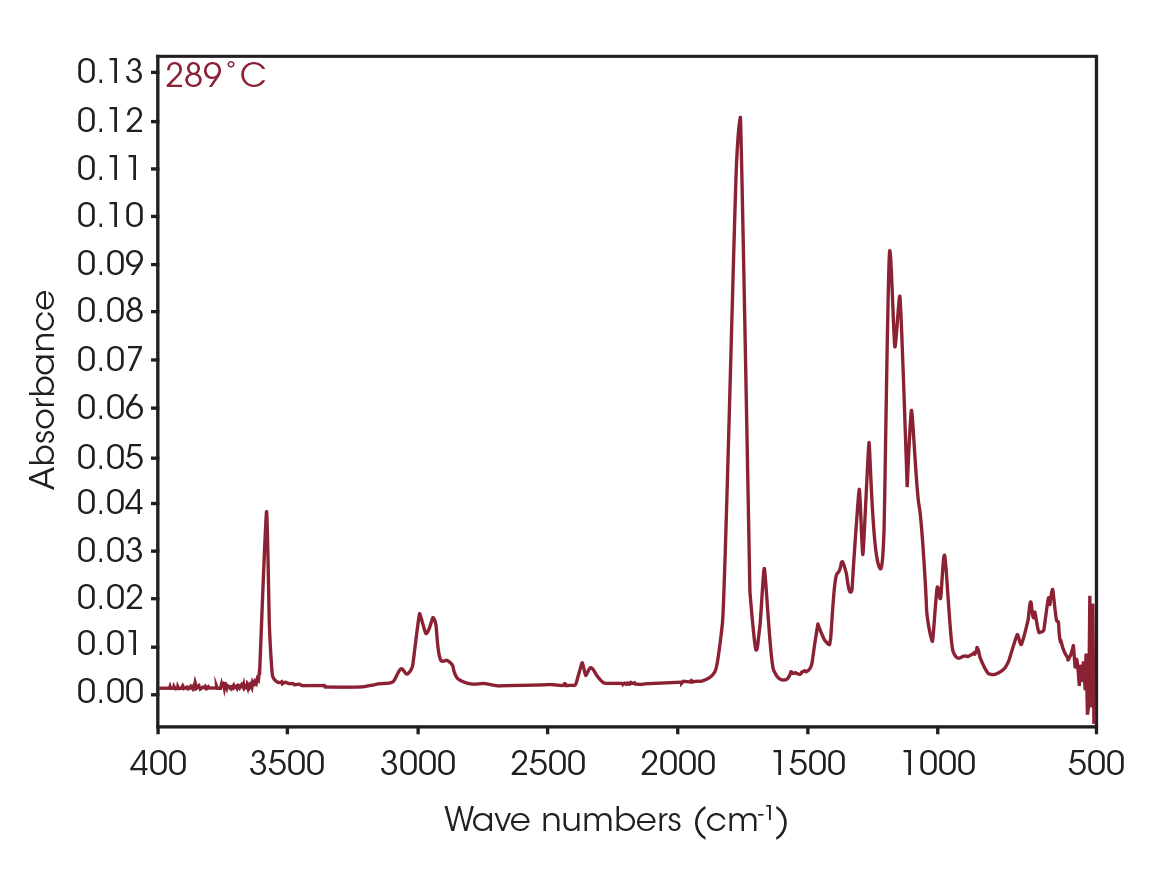
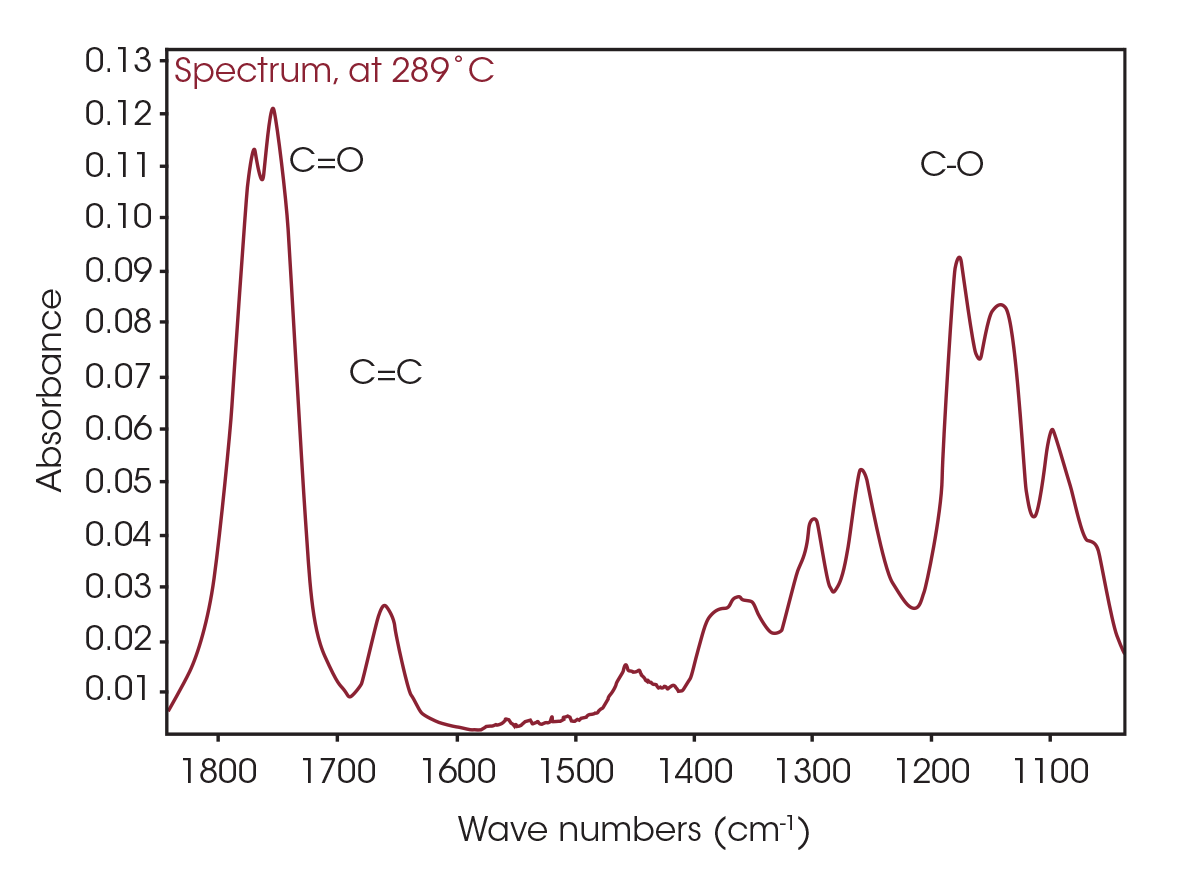
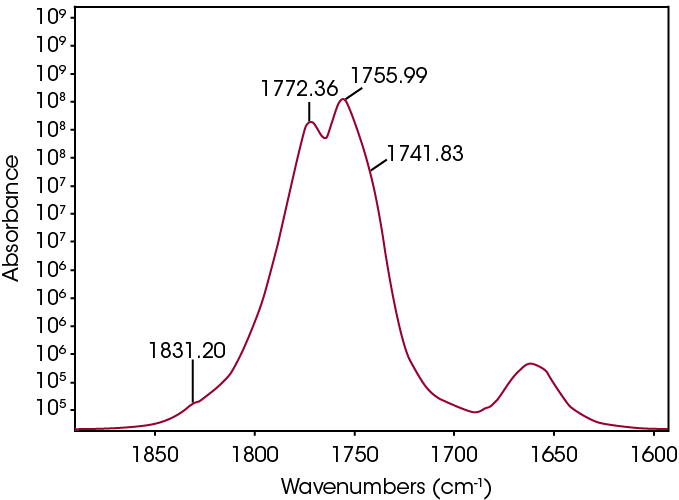
The FTIR spectrum for the mass loss at 289 °C is shown in Figure 9. Key features of the spectrum include constrained carbonyls, free hydroxyl, strong C-O single bonds, and unsaturation. One obvious species is an unsaturated organic acid with carbonyl split at 1771 and 1755 cm-1. Closer examination of the fingerprint region shows at least three carbonyls and carbon-oxygen single bonds, indicating the organic acid would not account for all the oxygen-containing species (Figure 10). Zooming in on the carbonyl region (Figure 11) shows possibly four different carbonyls. The higher energy absorbance (> 1790 cm-1) is likely due to carbonyl species with significant ring strain commonly observed as decomposition products in many plastics, while the lower energy carbonyls may be an ester. Secondary features that would indicate an aldehyde are not apparent.
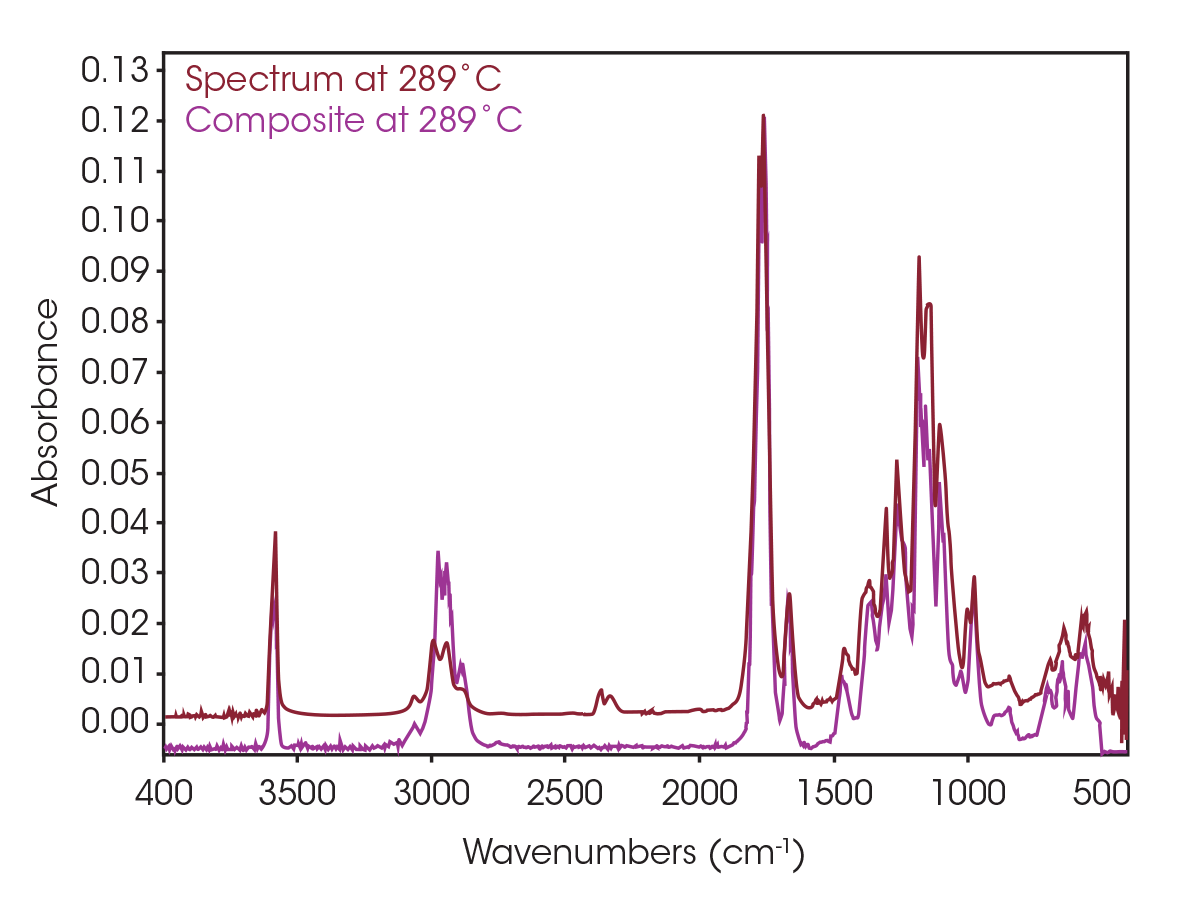
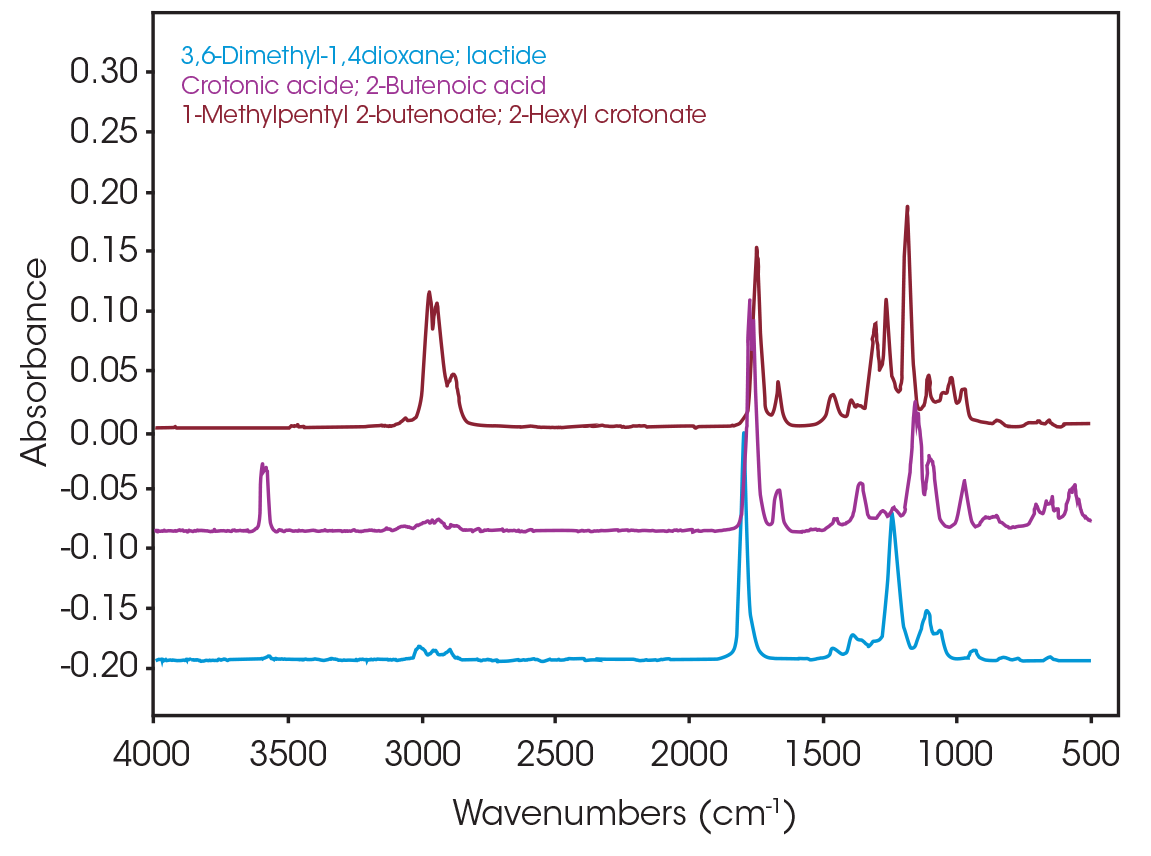
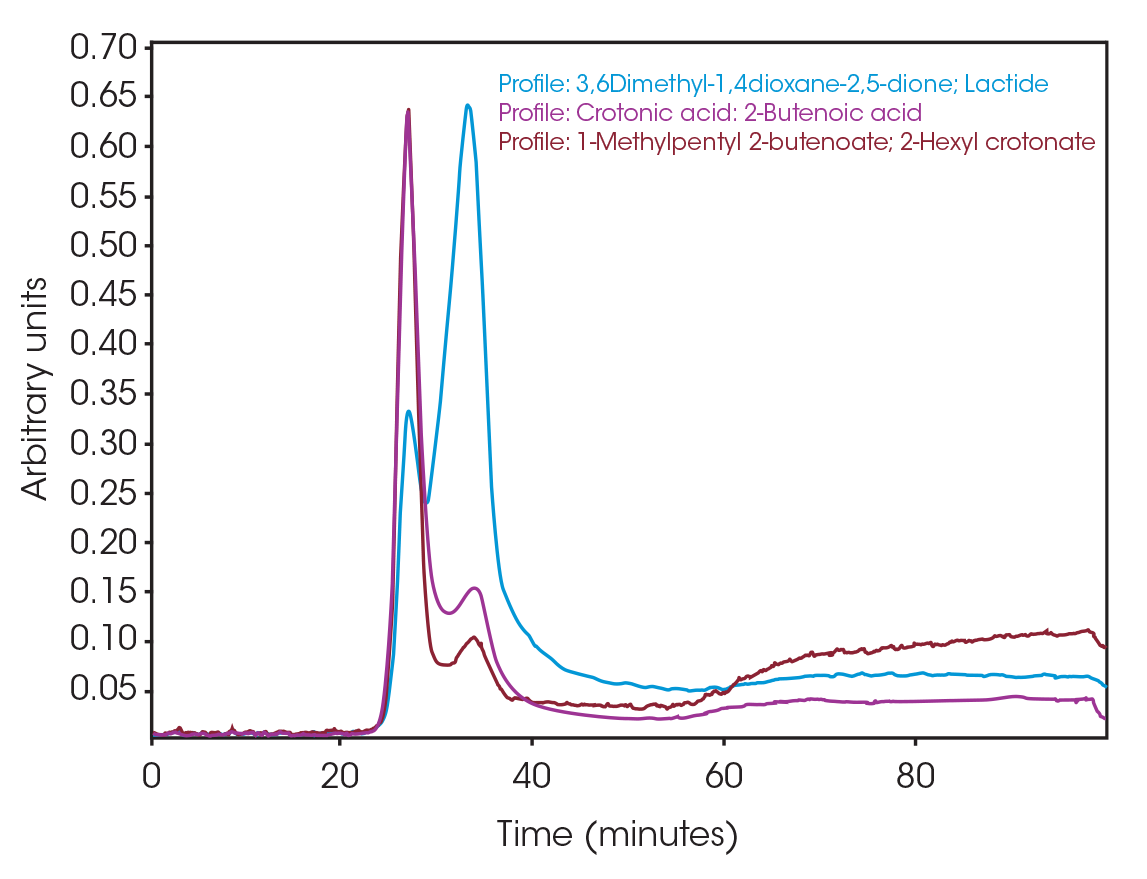
One of the powerful features of TGA/FTIR is the search capabilities of the OMNIC™ Mercury TGA software [5]. The software allows searching of the spectral data contained in the Gram-Schmidt reconstruction and builds a composite spectrum from available commercial reference libraries. For the sample spectrum, a composite was constructed containing 1-Methylpentyl 2-butenoate, 3,6-dimethyl-1,4-dioxane-2,5-dione, and 2-butenoic acid. An overlay of the composite spectrum and sample at 289 °C is shown in Figure 12. An overlay of the three components used to build the composite spectrum is shown in Figure 13. An overlay of the calculated evolved gases as a function of time is shown in Figure 14. The results of the search and composite should be scrutinized but provide a time-saving device that can make complex interpretation of FTIR spectra obtained in an EGA analysis more accessible to the analyst.
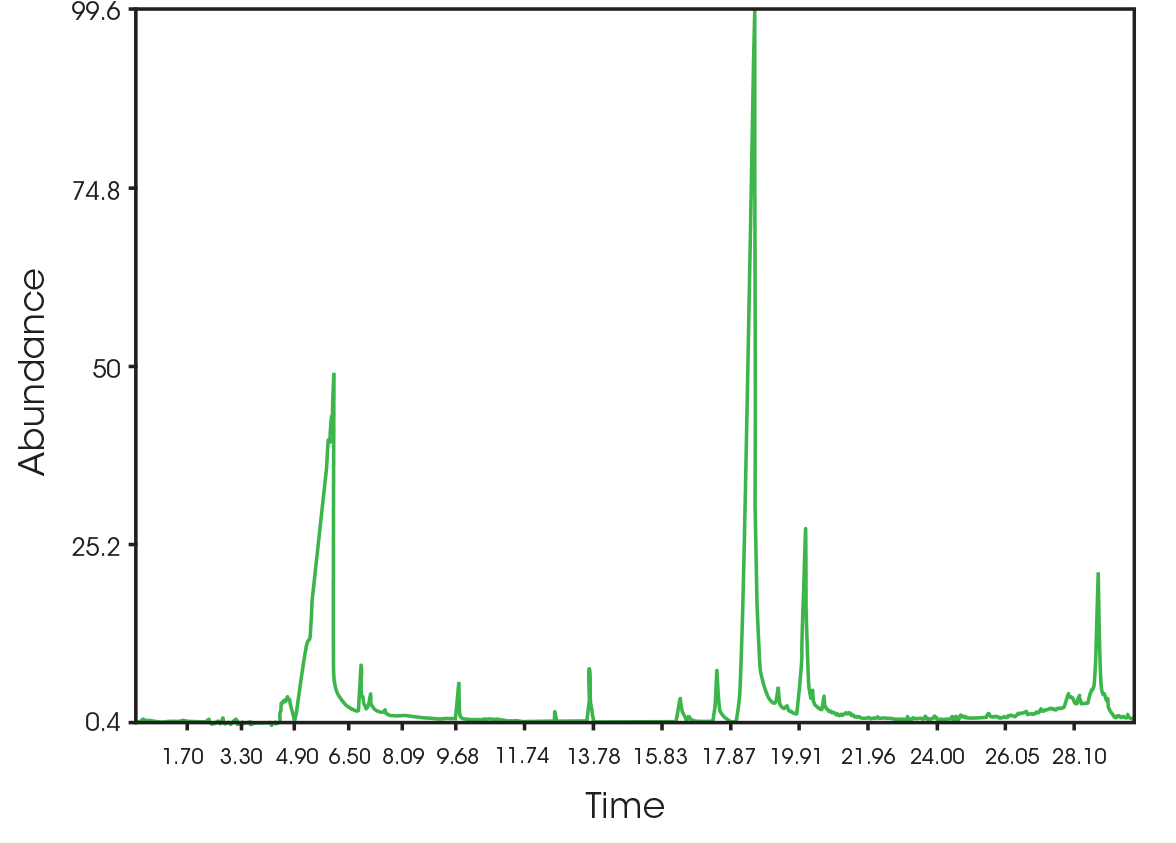
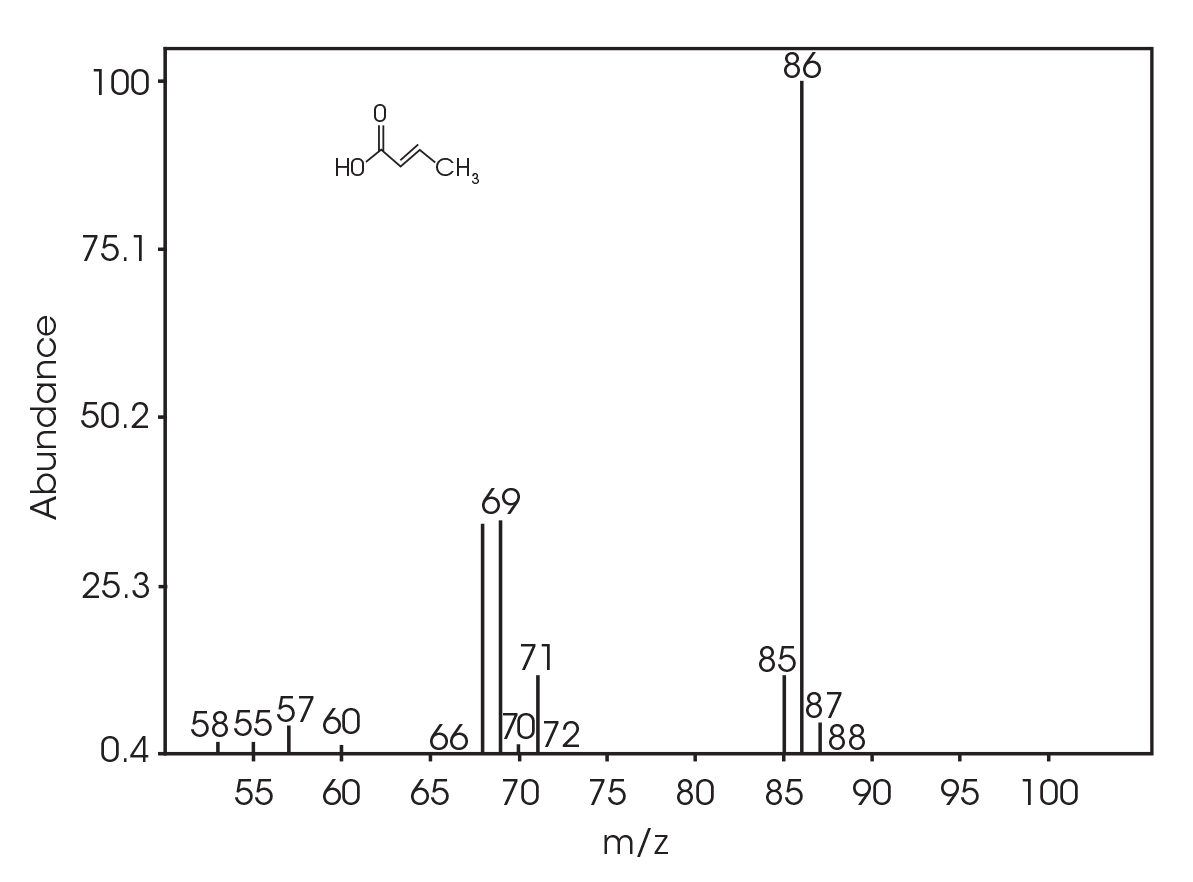
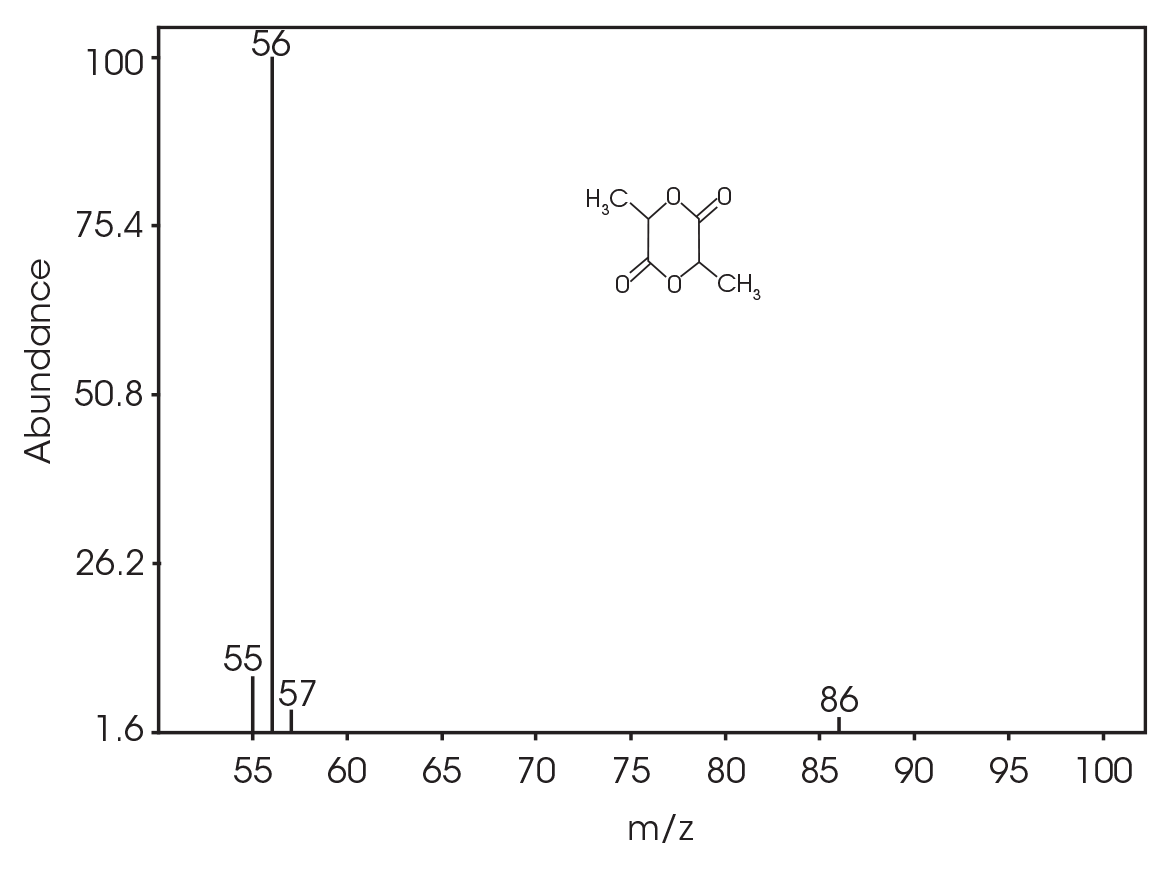
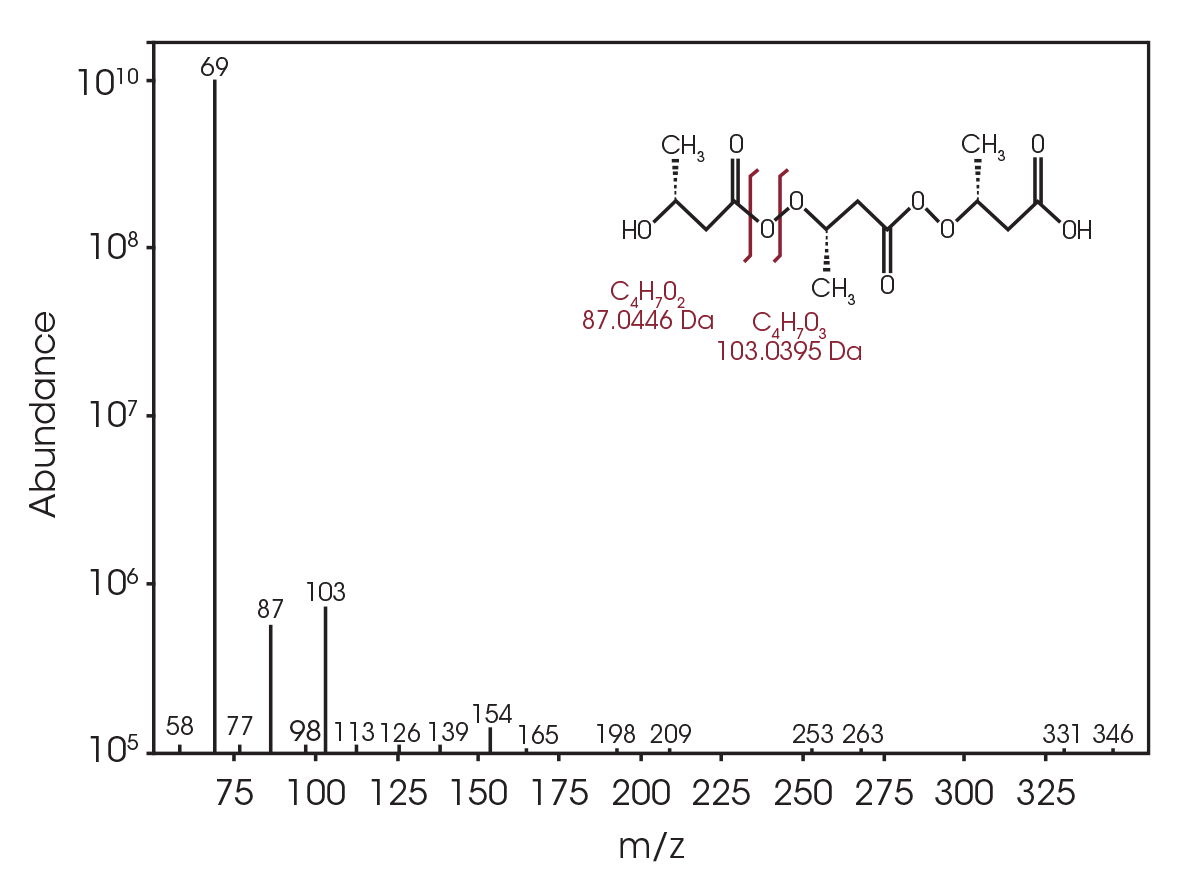
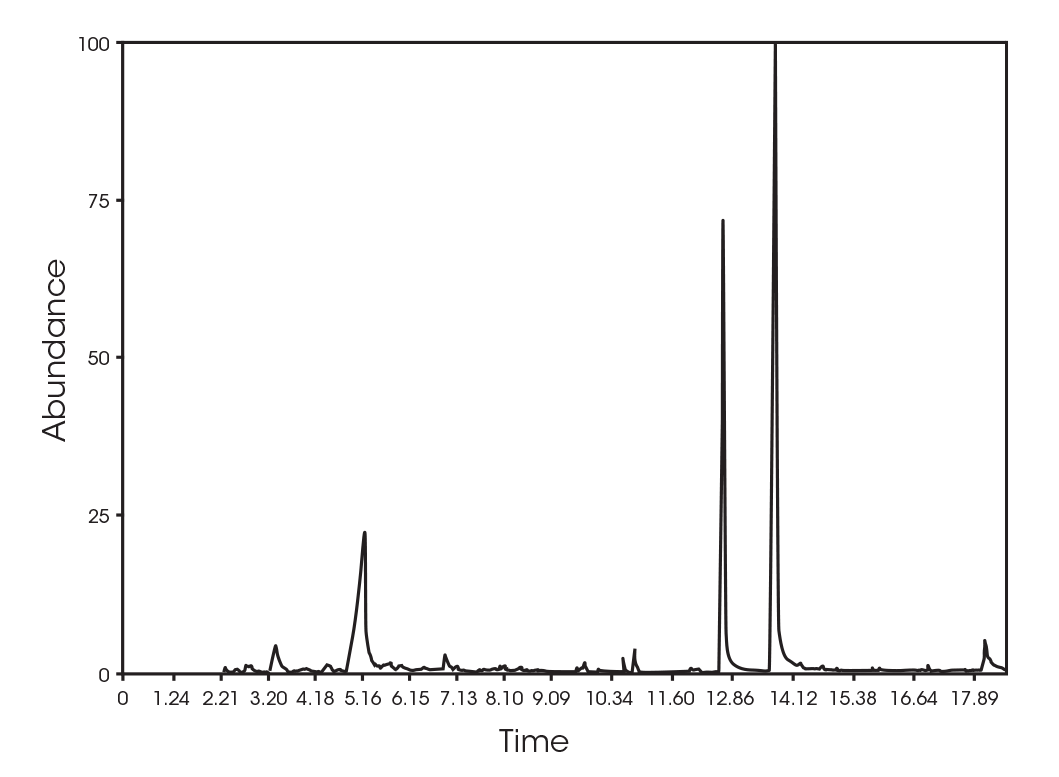
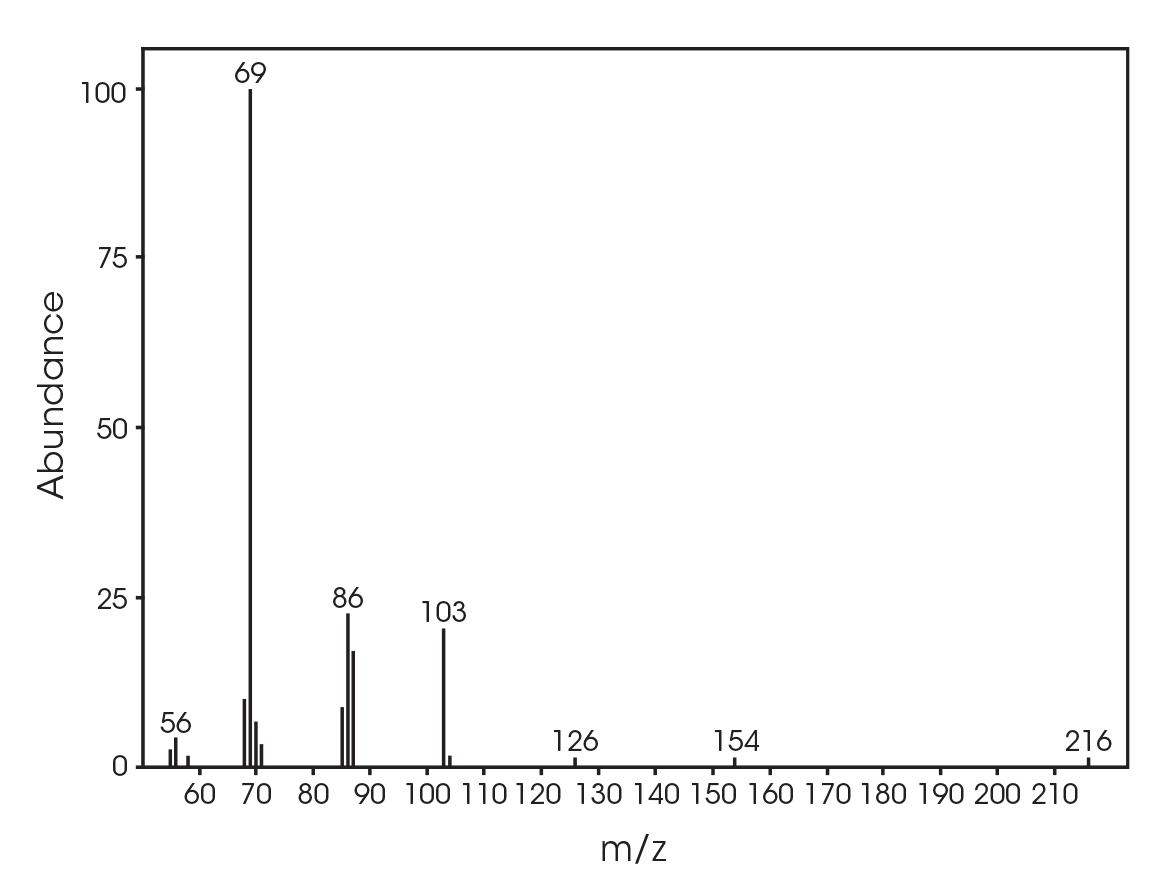
The total ion chromatogram (TIC) is shown in Figure 15. A summary of the mass spectral data with retention times (RT) is shown in Table 5. Main components appear to be 2-butenoic acid, and fragments of the polymer which account for the ester functionalities observed in the FTIR spectrum. Some 3,6-dimethyl-1,4-dioxane-2,5-dione was also detected.
Table 5. Summary of mass spectral data at 289 °C
| RT (min) | Species |
|---|---|
| 6.025 | 2-butenoic acid (Figure 16) |
| 13.692 | 3,6-dimethyl-1,4-dioxane-2,5-dione (Figure 17) |
| 18.443 | Polymer fragment (Figure 18) |
| 19.939 | Polymer fragment (Figure 19) |
| 28.801 | Polymer fragment (Figure 20) |
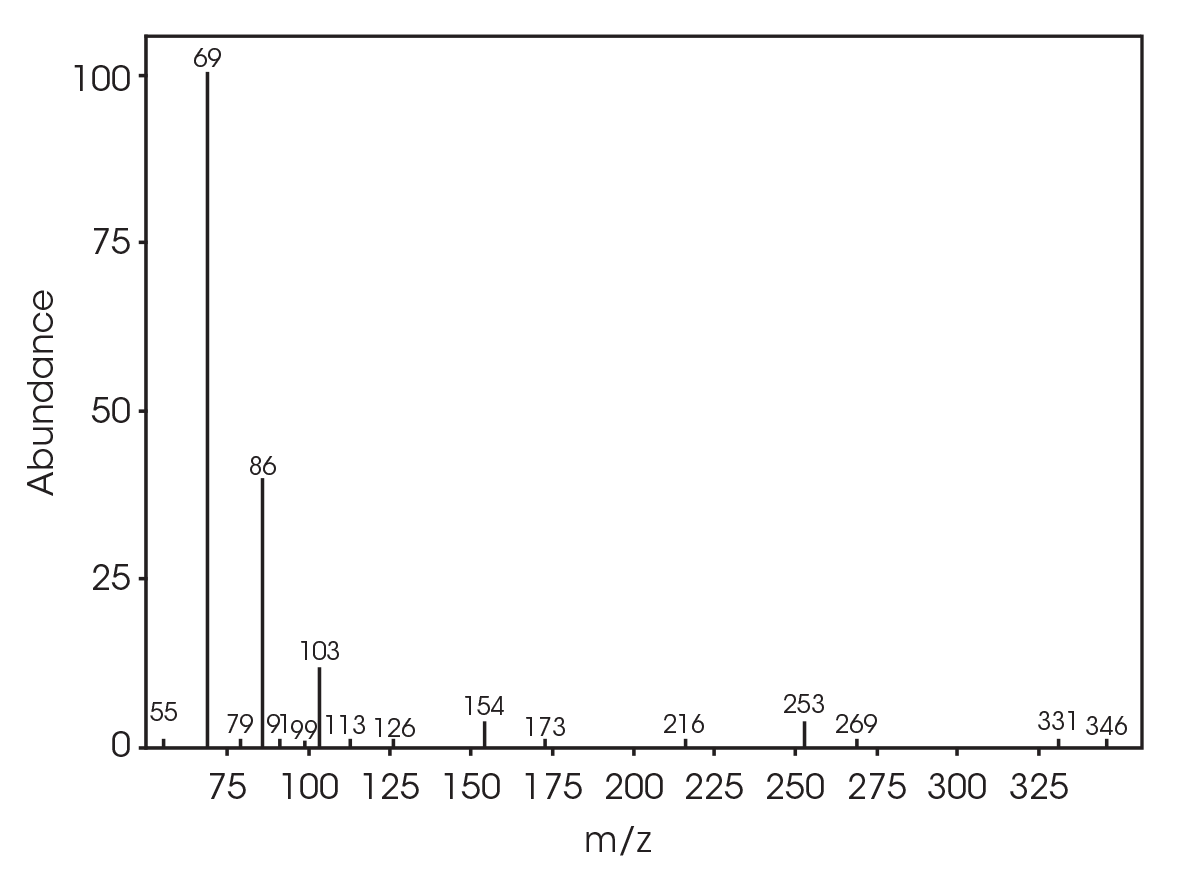
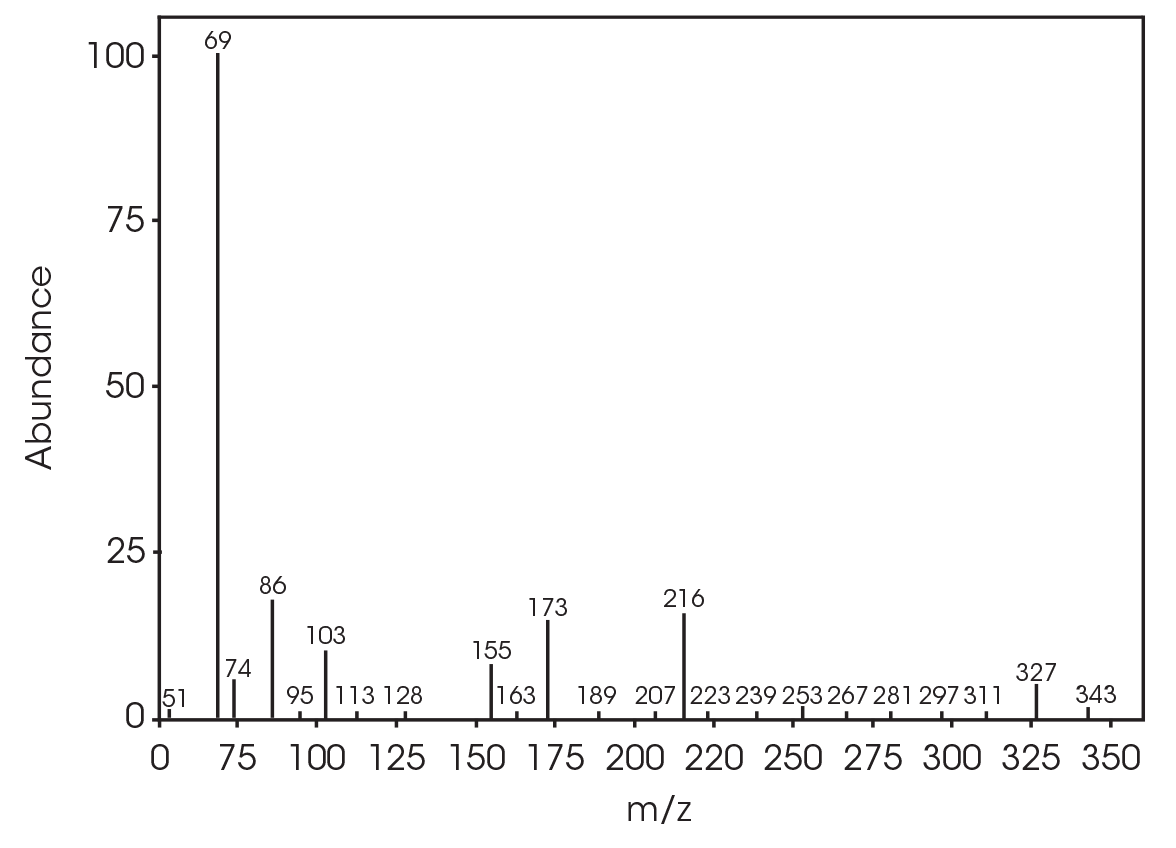
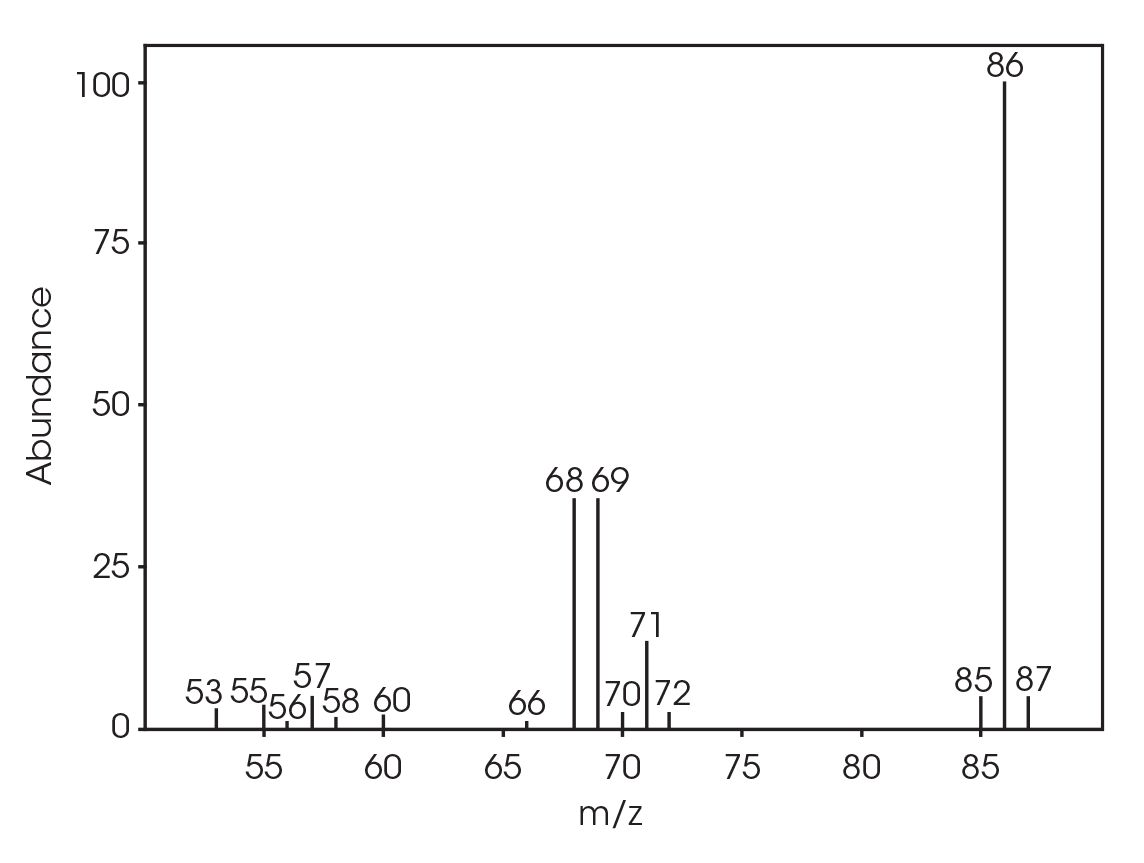
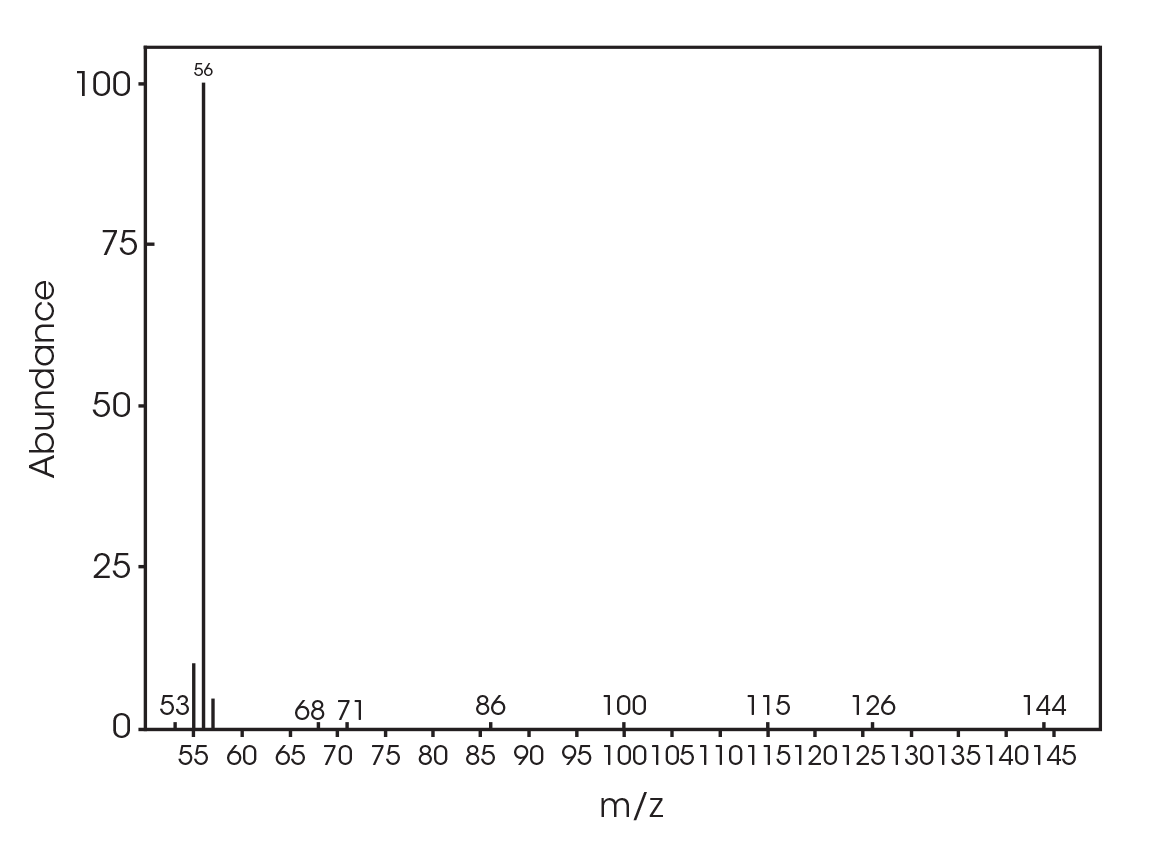
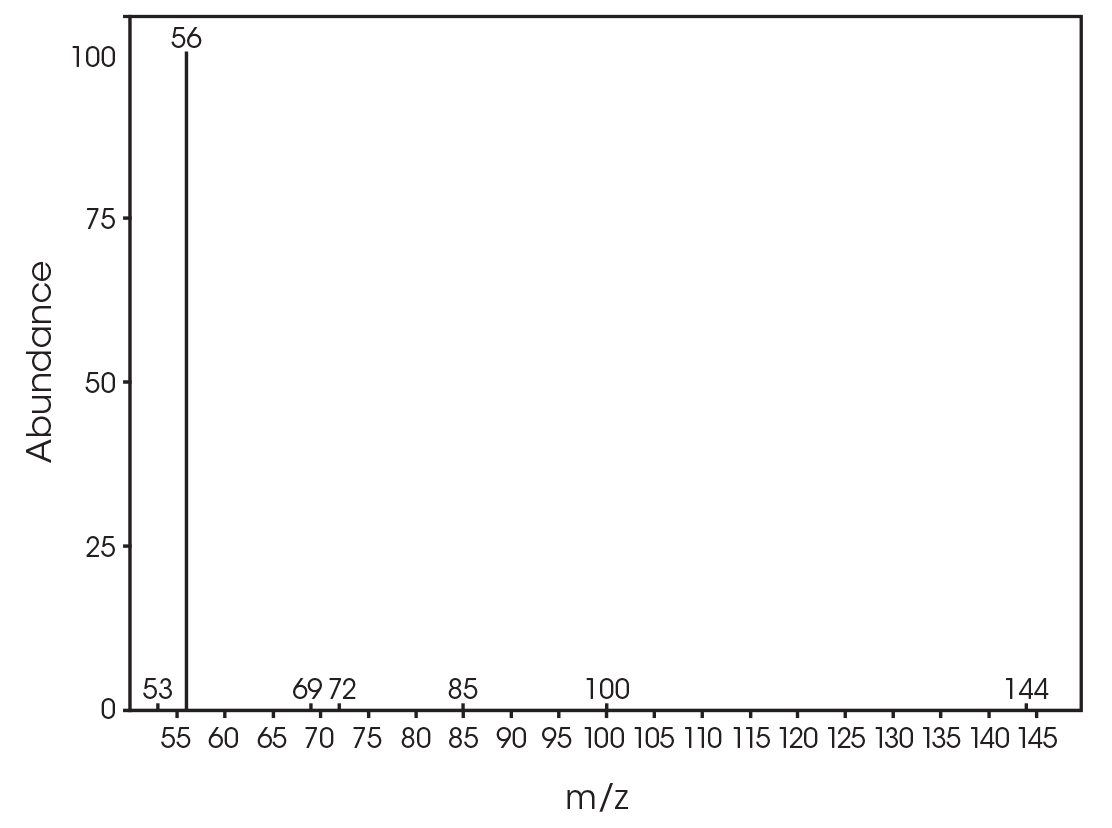
The FTIR spectrum for the mass loss at 354 °C is shown in Figure 21 and the TIC in Figure 22. The mass loss is mainly 3,6-dimethyl-1,4-dioxane-2,5-dione with some contribution from 2-butenoic acid, CO2, and CO. The two retention times associated with the 3,6-dimethyl-1,4-dioxane-2,5-dione may be due to trans and cis isomers. Table 6 summarizes the species detected and corresponding figures.
Table 6. Mass spectral data at 354 °C
| RT (min) | Species |
|---|---|
| 5.028 | 2-butenoic acid (Figure 23) |
| 12.685 | 3,6-dimethyl-1,4-dioxane-2,5-dione (Figure 24) |
| 13.379 | 3,6-dimethyl-1,4-dioxane-2,5-dione (Figure 25) |
| 18.132 | Polymer fragment (Figure 26) |
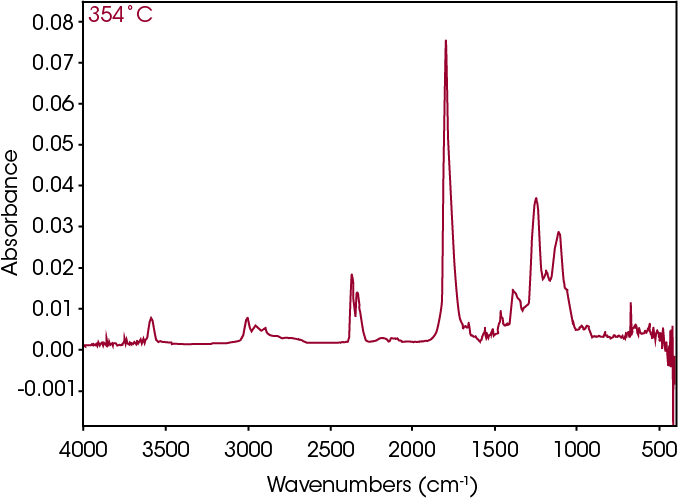
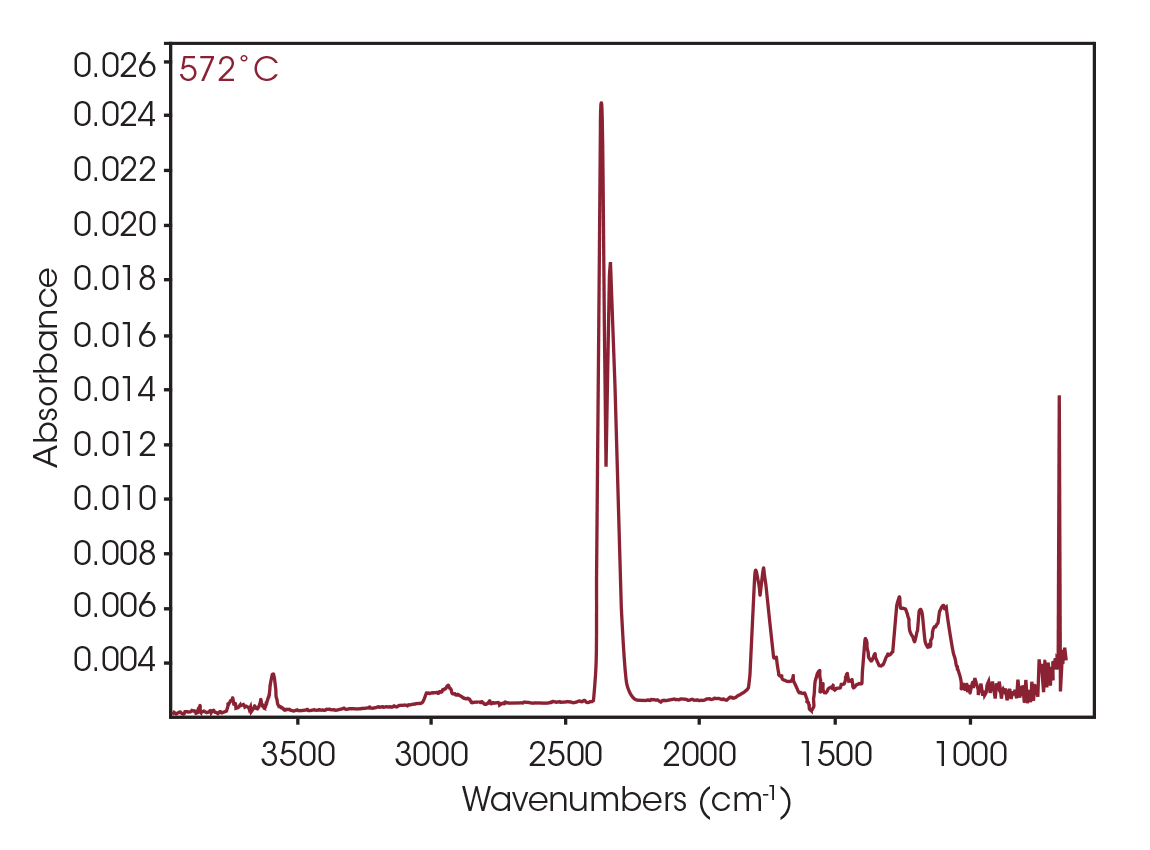
FTIR spectrum at 572 °C (Figure 27) shows CO2, constrained carbonyls likely the dioxane compound, and some organic acid. Mass spectral data was not obtained for this mass loss.
Conclusions
The emergence of renewable and naturally sourced polymers necessitates the need for extensive analytical characterization, especially thermal analysis. TGA is typically the first step in this process. TGA provides stability, onset of decomposition, and mass loss events. The decomposition activation energy of each mass loss event can be determined in a single experiment using MTGA. Finally, evolved gas analysis which combines TGA with FTIR and GC/MS yields compositional information about decomposition products. Modern search capabilities of spectroscopy software facilitate identification of the evolved species.
TA Instruments Discovery 5500 TGA anchors this powerful tandem, providing excellent sensitivity, baseline, controlled furnace chamber environment, and intuitive TRIOS software for data management.
References
- R. Sehgal and R. Gupta, “Polyhydroxyalkanoate and its efficient production: an eco-friendly approach toward development,” Biotech, pp. 1-14, November 2020.
- M. Arcos-Hernandez and e. al, “Physicochemical and mechanical properties of mixed culture polyhydroxyalkanoate (PHBV),” European Polymer Journal, vol. 49, pp. 904-913, 2013.
- R. Blaine and B. Hahn, “Obtaining Kinetic Parameters by Modulated Thermogravimetry,” Journal of Thermal Analysis, vol. 54, pp. 695-704, 1998.
- “E 1641 Standard Method for Decomposition Kinetics by Thermogravimetry,” ASTM, Conshohocken, 2007.
- Bradley, Michael, “TGA-IR Analysis Using the OMNIC Mercury TGA Software,” [Online]. Available: https://assets. thermofisher.com/TFS-Assets/CAD/Application-Notes/Whitepaper_TGA-IR_L.pdf.
Acknowledgement
This paper was written by James Browne, Senior Applications Scientist at TA Instruments.
TA Instruments, Discovery, and TRIOS are trademarks of Waters Technologies Corporation. Nicolet and OMNIC are trademarks of Thermo Fisher Scientific Inc.
Click here to download the printable version of this application note.

