Keywords: Starch, gelatinization, starch cell, heating/cooling cycle, pasting, viscoelasticity
RH133
Abstract
Starch is a natural product already known to the Romans as food thickener. Wolfgang Oswald was first to measure the viscosity of starch during the pasting process. And starch is not only a food product, functionally modified starches are widely used in the industry including adhesives, paper coatings, wood, packaging, pharmaceutical, and many other.
Because of the specific nature of starch, rotational rheometers with “viscometric” test geometries (concentric cylinders, coneplate) are not really suitable for testing starch suspensions. Starch dispersions require continuous mixing during the measurement to prevent sedimentation of the starch granules.
Therefore instruments for characterizing starch (for example the amylograph) measure the torque of a mixing element to follow the changes during gelatinization.
In order to allow a systemic analysis and a more fundamental rheological characterization, a mixing chamber (starch cell) has been mounted on a sensitive rheometer. Standard rheological methods based on steady, transient and oscillatory measurements are available now to evaluate starch during the gelatinization process as well as the final product.
Introduction
The gelatinization process of starch dispersions is characterized using torque rheometers. The first instrument of this kind is the amylograph, consisting of a temperature controlled mixing chamber. The torque introduced into the material via the mixing element is a measure of the viscosity. Some viscometers are optimized mixing devices to determine the gelatinization as well as the retrogradation of native and modified starch products. During a heating/cooling cycle, the angular velocity is maintained. The viscosity is calculated as the “Newtonian equivalent” based on a calibration with a standard material. Since starch dispersions are non-Newtonian fluids and as such shear rate dependent, this viscosity calibration is certainly not adequate for more fundamental testing. Another issue is the control of the water content during the heating/cooling cycle. The Starch Pasting Cell (SPC) is designed to minimize water losses during the cooking cycle. Mounted on a sensitive rheometer and separately calibrated for strain (rate) and stress, the starch cell provides a more accurate and powerful tool to characterize the gelatinization of raw and modified starch products as well as the properties of the starch gels.
What Is Starch?
Starch is abundant in nature. All major agricultural crops contain starch. Modern technologies enable starch to be extracted with high yield from agricultural crops. The extracted starch granule is a compact package of pure glucose polymer. Starch is composed of two polymers – amylose and amylopectin. Amylopectin is a branched chain polymer with branches of 20 to 30 glucose residues long. Amylose is a linear polymer with glucose residues of 400 to 4000 units long. Within the granules the starch molecules are layered down in an organized manner. In order to withstand modern processing and storage conditions as well as to provide special functionality to the end product, native starch is chemically or physically modified. The modifications include mild degradation, cross-linking of chains, derivatization with phosphate or esters, pre-gelatinization, etc. The addition of chemical groups to the starch chain for example, improves the clarity and stability of the gel during cooking, mixing and freezing. Starch molecules become tailor made hydrocolloids which go into food products, are used as coating for paper, as adhesive for paperback, etc.
Why Test Starch: the Significance of the Pasting Curve
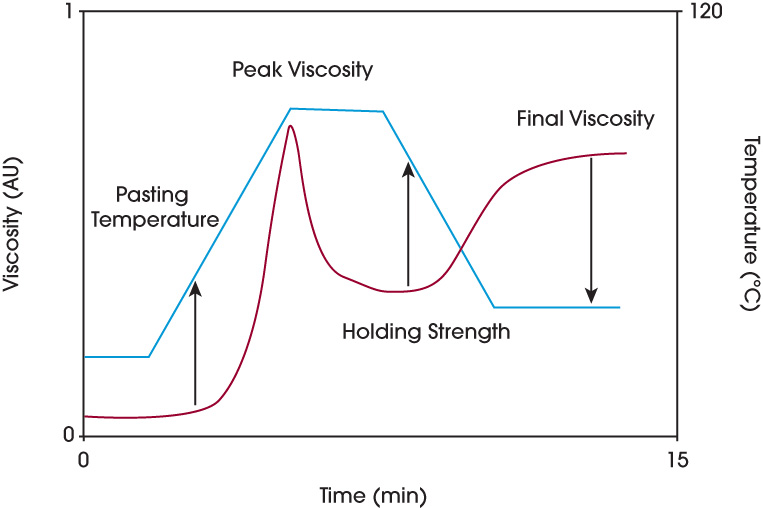
Raw starch exists as microscopic granules. The size and shape of these granules is characteristic of the starch’s botanic source. When starch is heated above a critical temperature, the starch granules undergo a irreversible process, known as gelatinization. The properties of the starch gels depend on the origin of the raw starch (crop, potatoes, etc.), the environmental conditions (seasons) or the modification. The viscosity curve (pasting curve) produced by heating and cooling starch generally has a similar characteristic shape as shown in figure 1. Unmodified raw starch is insoluble in water below 50 °C. Early in the pasting process, the starch granules absorb a large amount of water and swell to many times their original size. The viscosity increases because the swollen starch granules have to squeeze past each other. Oswald has defined the temperature at the onset of the rise in viscosity as the pasting temperature. With increasing temperature, the granules rupture and amylose leaches into solution followed by amylopectin. Granule rupture and polymer alignment due to mechanical shear reduces the viscosity. This process that follows the gelatinization is known as pasting.
The peak temperature occurs at the equilibrium point between swelling and polymer leaching. During a hold period (typically 95 °C) the viscosity drops to a minimum value, referred to as holding strength or hot paste viscosity. As the starch mixture is subsequently cooled, reassociations between starch molecules occurs. This usually causes the formation of a gel and the viscosity increases to a final viscosity. This phase of the pasting curve involves retrogradation or re-ordering of the starch molecules. The final viscosity is the most commonly used parameter to define the quality of a particular starch sample.
The cooked starch exhibits a non-Newtonian behavior characterized by an intensive shear thinning. Most starches also show a reduction of viscosity over time as a function of shear rate (thixotropy). As such, there is no absolute measure of starch viscosity. Rates of heating and cooling, holding time, shear rate etc. affect the final viscosity. Standard test protocols are therefore required and used to compare test results.
The Starch Pasting Cell (SPC)
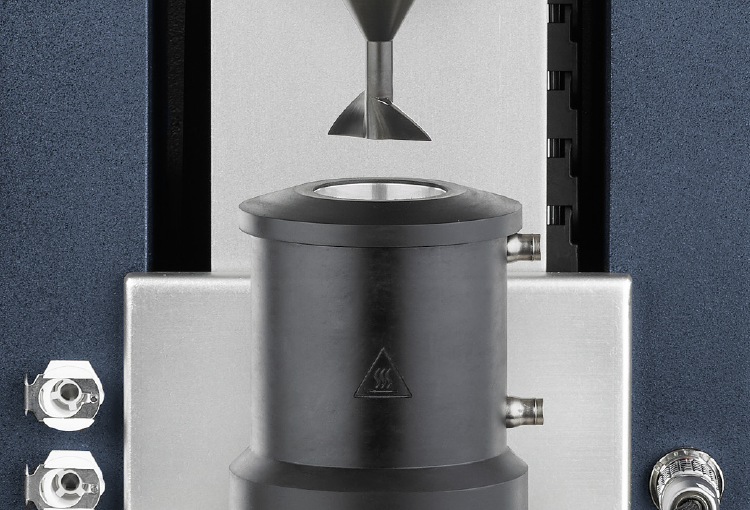
The SPC is temperature controlled using resistive elements placed concentrically to the cup for heating. Cooling is through water carried in a helical conduit in close proximity to the cup outer walls. The maximum temperature ramp rate is 15 ºC per minute, the maximum cooling rate is 30 ºC per minute. Figure 2 shows a cutaway drawing of the starch pasting cell attachment. The impeller is designed to closely fit the cup containing the starch suspension. The top of the mixing element shaft is gradually extended to provide a noncontact conical shape cover, which significantly prevents solvent evaporation. Since the impeller produces an illdefined flow, analytically derived factors used in the conversion of the angular velocity to shear rate and torque to shear stress do not exist. For Newtonian materials, the mixer geometries can be simply calibrated for the viscosity using a reference material. For non-Newtonian fluids like the starch suspensions this is not possible and separate calibration constants for stress and strain (rate) need to be determined. A procedure for a quantitative analysis of torque and rotor speed data to extract viscosity shear rate curves using non conventional geometries has been described by Ait-Kadi, Marchal, et al using a Couette Analogy for mixer elements. Once strain(rate) and stress geometry coefficients are determined for a given geometry, standard test protocols based on continuous rotation or oscillatory testing can be used to measure the viscosity as a function of shear rate or the dynamic moduli as a function of the frequency.
Test Results
Figure 3 shows two runs of a heating/cooling cycle for a waxy maize cook-up starch (ST01) and figure 4 two runs for a hydroxyethylated Dent Corn Starch (ST03). Cook-up starches are used widely as thickeners and stabilizers in products such as gravies, soups, dairy products, etc. All tests were performed at a rotation speed of the impeller of 160 rpm.
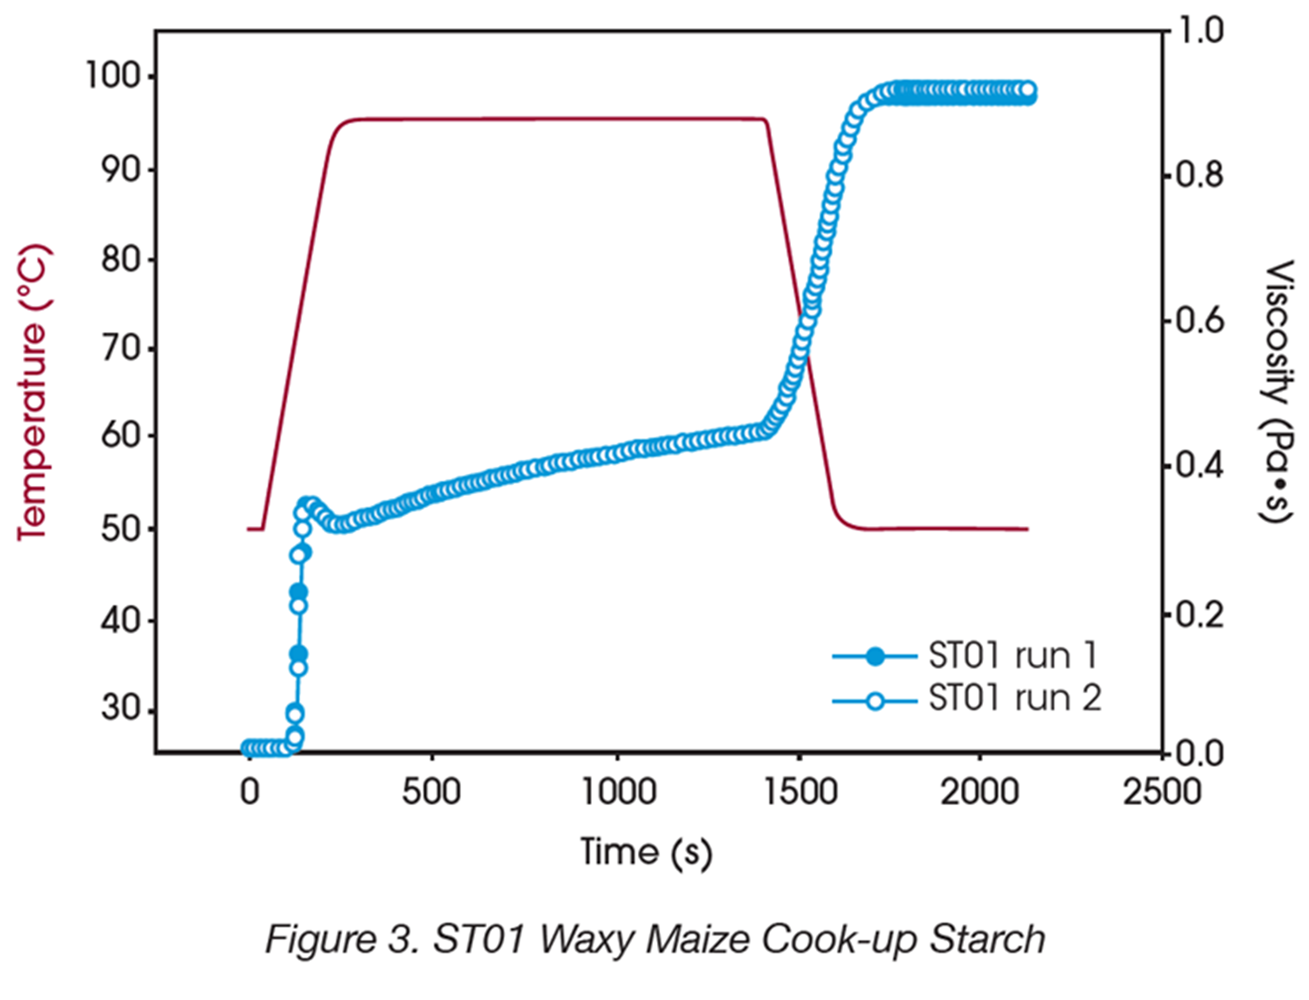
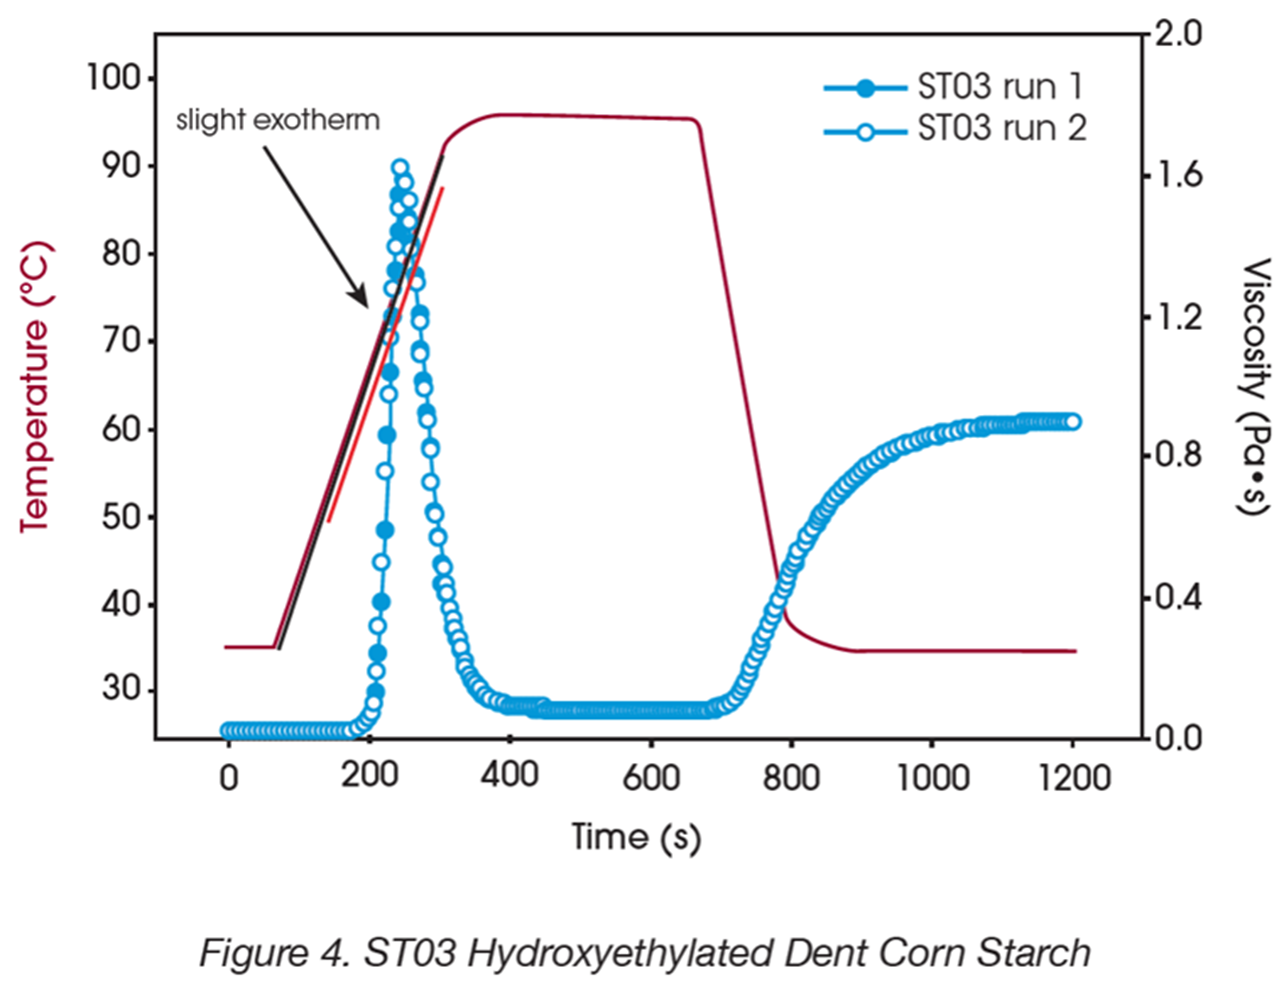
The two pasting curves exhibit the typical shape characteristic for the two different types of starch. The final viscosity for the two starches is very similar, also the pasting curve is quite different. The reproducibility of the tests is excellent. The temperature plot does not show a sharp change between the steps. This is due to the temperature sensor, positioned close to the cup wall to reflect the sample temperature better. The curvature in the heating ramp for the hydroxyethylated dent corn starch could be an indication of a slight exothermal during the starch cooking.
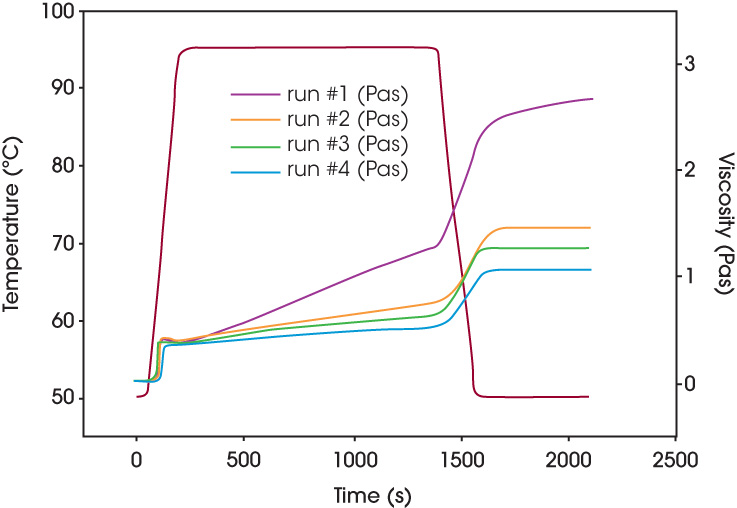
In order to check the evaporation of water in the new starch cell, a series of experiments was conducted using the waxy maize cookup starch (ST01), where evaporation is more of a problem. Figure 5 shows four plots, obtained with different impeller systems. Run #1, with the highest viscosity profile, was done with an impeller with no rim to give worst-case evaporation scenario. The middle runs (Run #2 and #3) were done with a Staley paddle at two different gaps. The Run #4 was performed with the TA™ geometry shown in figure 2. The lower viscosity corresponds to the lowest moisture loss, which has been obtained for the TA starch cell with a tight gap between impeller and cup. The conical design of the impeller makes evaporation less dependent on the vertical position. The moisture loss for Run #4 was 0.7 as opposed to 1.15 and 1.7g using the Staley paddle arrangement in runs #2 and #3.
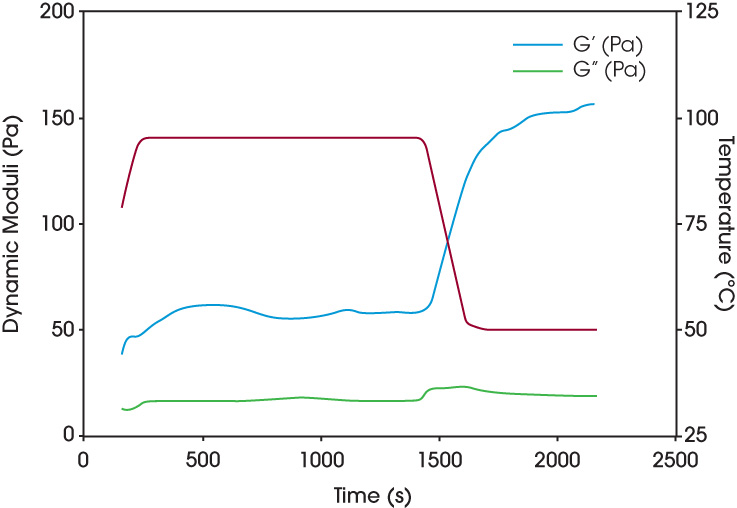
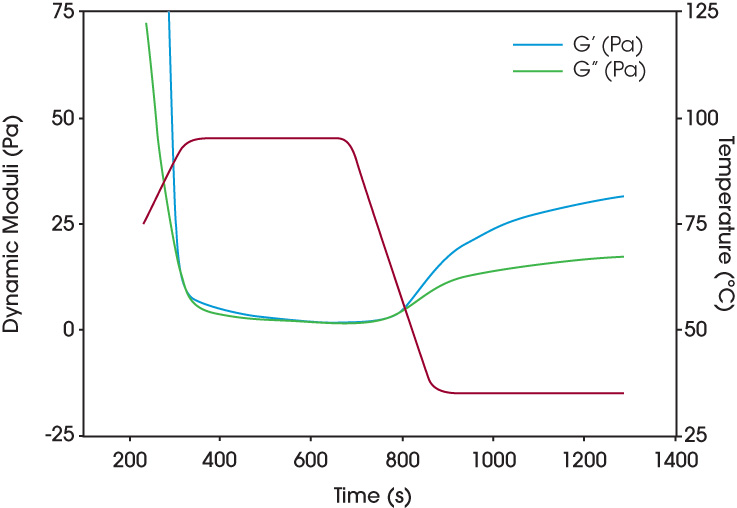
Figure 6 and figure 7 show data obtained on the same two starch samples, however the steady shear has been stopped at 75°C and the test was continued at an applied oscillating torque of 10 mN•m. Under these conditions, the sample is experiencing negligible shearing. The complex viscosity is recorded to follow the gel formation during the cooking cycle. Plotted are the G‘ and G‘‘ respectively. The storage modulus G‘ of the waxy maize starch is considerable higher then the storage modulus of the hydroxyethylated dent corn starch, whereas the final viscosity under continuous shear conditions (figure 3 and 4) was approximately the same for both starches. The storage modulus of the waxy maize starch is higher than the viscous modulus throughout the heating and cooling phase and a gel like behaviour already established early in the pasting process. It may be concluded, that the continuous shearing in the standard pasting procedure affects the gel structure build-up differently for the two types of starches.
Conclusion
The SPC is an option for Discovery™ Hybrid Rheometers with excellent temperature control during the heating and cooling cycles. The new design of the impeller minimizes moisture losses. The integration of the cell with a sensitive rheometer, allows in addition to conducting standard heating/cooling cycles, more advanced rheological characterization of the starch gels using oscillatory testing protocols. The evaluation of strain (rate) and stress coefficients provides an analysis in terms of correct shear rate and stress while using a mixing element to measure torque and not an ideal “viscometric flow” geometry typical for rotational rheometers.
References
- Quantitative Analysis of Mixer type rheometers using Couette analogy A. Ait- Kadi, P. Marchal, et al, Canadian J. Chem. Eng., 80, 2002
- American Association of Cereal Chemists (AACC) Method 76-21
- Use of a mixer geometry to determine the viscosity and linear viscoelastic properties of starch B. Costello, Proc. 3rd Int’l Symp. On Food Rheology and Structure, 459
Acknowledgement
This paper was written by A.J. Franck, Ph. D., TA Instruments.
TA and Discovery are trademarks of Waters Technologies Corporation.
Click here to download the printable version of this application note.

