Keywords: Polyhydroxyalkanoate, poly-3-hydroxybutyrate, bio composites, renewable polymer, green polymer, DSC, MDSC
TA483
Abstract
Differential scanning calorimetry (DSC) can be used to provide analysis of poly-3-hydroxybutyrate (PHB), a widely studied biopolymer. This application note presents the workflow of the DSC analysis of PHB using both standard and Modulated DSC™. Rapid cooling from the polymer melt was used to simulate process conditions. This yields a partially amorphous structure that has two cold crystallization transitions and two major melting transitions with crystal perfection. Minor melting transitions are also observed. Slow cooling from the melt yields a more crystalline structure which also has two major melting transitions with some crystal perfection occurring, but no cold crystallization. The Modulated DSC results show that most of the melting occurs in the non-reversing heat flow signal. This may be due to hydrogen bonding between the PHB carbonyl and hydroxyl functionalities of the wood flour including cellulose, hemicellulose, and lignin. The Discovery™ 2500 DSC generates high quality data and, with advanced features like MDSC™, is a vital analytical tool to characterize complicated samples.
Introduction
The need to reduce the environmental impact of plastic waste has led to a great interest in renewable, biodegradable resins with properties like more common plastics such as polypropylene and polyethylene. Thermal, physical, and rheological characterizations of these polymers are important for assessing stability, processability, and fundamental properties.
Differential scanning calorimetry is a fundamental analytical technique used in the characterization of polymers. Thermal transitions including melting, crystallization, glass transitions, and heat capacity are commonly evaluated using DSC. Characteristics obtained in the DSC experiment correlate with end use properties of the materials including stiffness, toughness, stability of crystalline forms, processability, and clarity, among others. The effects of additives, fillers, polymer blends, copolymerization, and nucleating agents are also studied using DSC. DSC is also an important augmentation to other techniques such as FTIR for obtaining compositional information of polymers.
Polyhydroxyalkanoates (PHA) are biopolymers produced from microorganisms forming as water insoluble granules within the cytoplasm of the cell [1]. Poly-3-hydroxybutyrate (PHB) is the most studied PHA. A commercial sample with wood flour was obtained for this application note and DSC and Modulated DSC (MDSC) were used in characterizing basic thermal properties of this polymer. Tests were conducted using a TA Instruments™ Discovery 2500 Differential Scanning Calorimeter.
Experimental
Commercially available LDPE was thermally degraded using a hydrogen mordenite (H-MOR) catalyst. LDPE powders were mixed with varying amounts of H-MOR powder to yield samples with 0, 5, 10, and 20 wt% H-MOR.
Degradation and pyrolysis were measured using a Discovery™ 5500 TGA, shown in Figure 1. Samples of 1.5 (± 0.2) mg were loaded into 100 μL platinum pans and ramped at 20 °C/min up to 800 °C in inert gas (nitrogen).
Results and Discussion
Sample Preparation
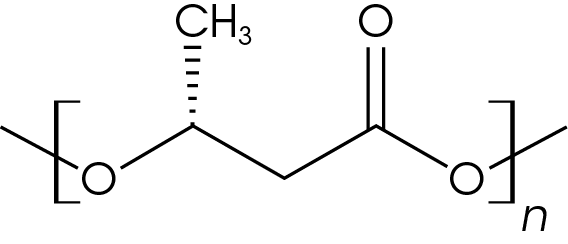
Samples of PHB/wood flour composites with 3 mm nominal granule size were obtained from Sigma Aldrich (catalogue number GF28484343-1EA) for this work. The chemical structure of PHB is shown in Figure 1. Samples were cut from the PHB pellets and used for the analyses.
Determining the upper limit of both the DSC and MDSC experiments is done utilizing thermogravimetric analysis (TGA) by determining the temperature where approximately 2 percent mass loss occurs using identical heating ramps and purge gas composition. For the standard DSC heat-cool-heat experiment (10 °C / min), an upper limit of 245 °C was chosen; for the MDSC experiment (2 °C/min), an upper limit of 220 °C/min was chosen [2].The parameters for the DSC and MDSC experiments are shown in Tables 1 and 2, respectively.
Table 1. Discovery 2500 DSC parameters
| Instrument | TA Instruments Discovery 2500 |
|---|---|
| Pan | Tzero Aluminum |
| Purge | N2 at 50 mL/min |
| Temperature Range | -50 to 245 °C |
| Sample Mass | 4 mg nominal |
| Heat Rate | 10 °C/min |
Table 2. Discovery 2500 MDSC experimental conditions
| Instrument | TA Instruments Discovery 2500 |
|---|---|
| Pan | Tzero Low Mass Aluminum |
| Purge | N2 at 50 mL/min |
| Temperature Range | -50 to 220 °C |
| Heating Rate | 2.5 °C/min |
| Sample Mass | 4 mg nominal |
| Period | 60 |
| Amplitude | +/- 1 °C |
For each experiment, samples were heated to 220 °C and rapidly cooled in the instrument to impart as much amorphous structure as possible and eliminate thermal effects imparted during the pelletization process. A slow-cooling (1 °C/min) DSC experiment was also done to impart as much crystalline structure as possible. The experiments performed were:
- Standard DSC – Heating and cooling rates were done at 10 °C/min.
- DSC comparison of heating rates done at 2.5, 5, 10, and 20 °C/min
- MDSC experiment at a heating rate of 2.5 °C/min, conditions are shown in Table 2.
- DSC with a slow cooling rate done at 1 °C/min followed by heating at 5 °C/min. MDSC was also done using the slow cooling rate protocol.
Data analysis was done using TA Instruments TRIOS™ software. Some data was also deconvolved using PeakFit software v4.12. Curve fitting was done using the Pearson IV model.
Results and Discussion
Heat-Cool-Heat of PHB
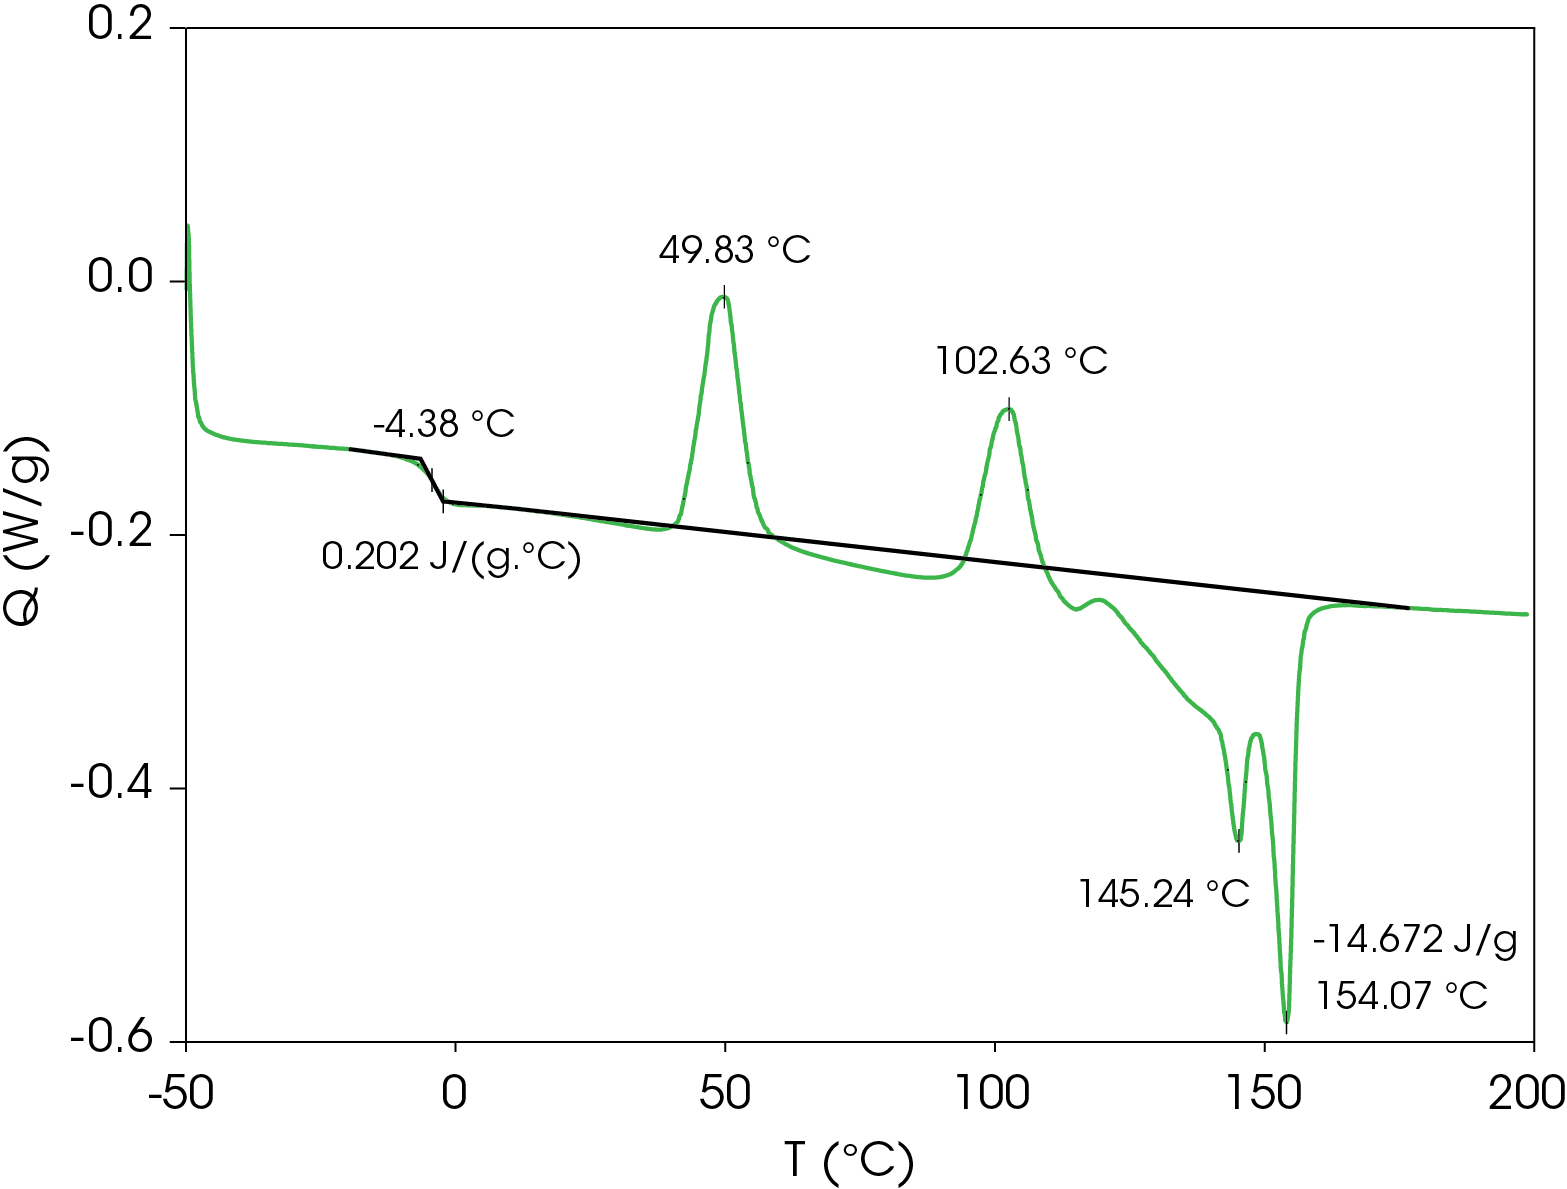
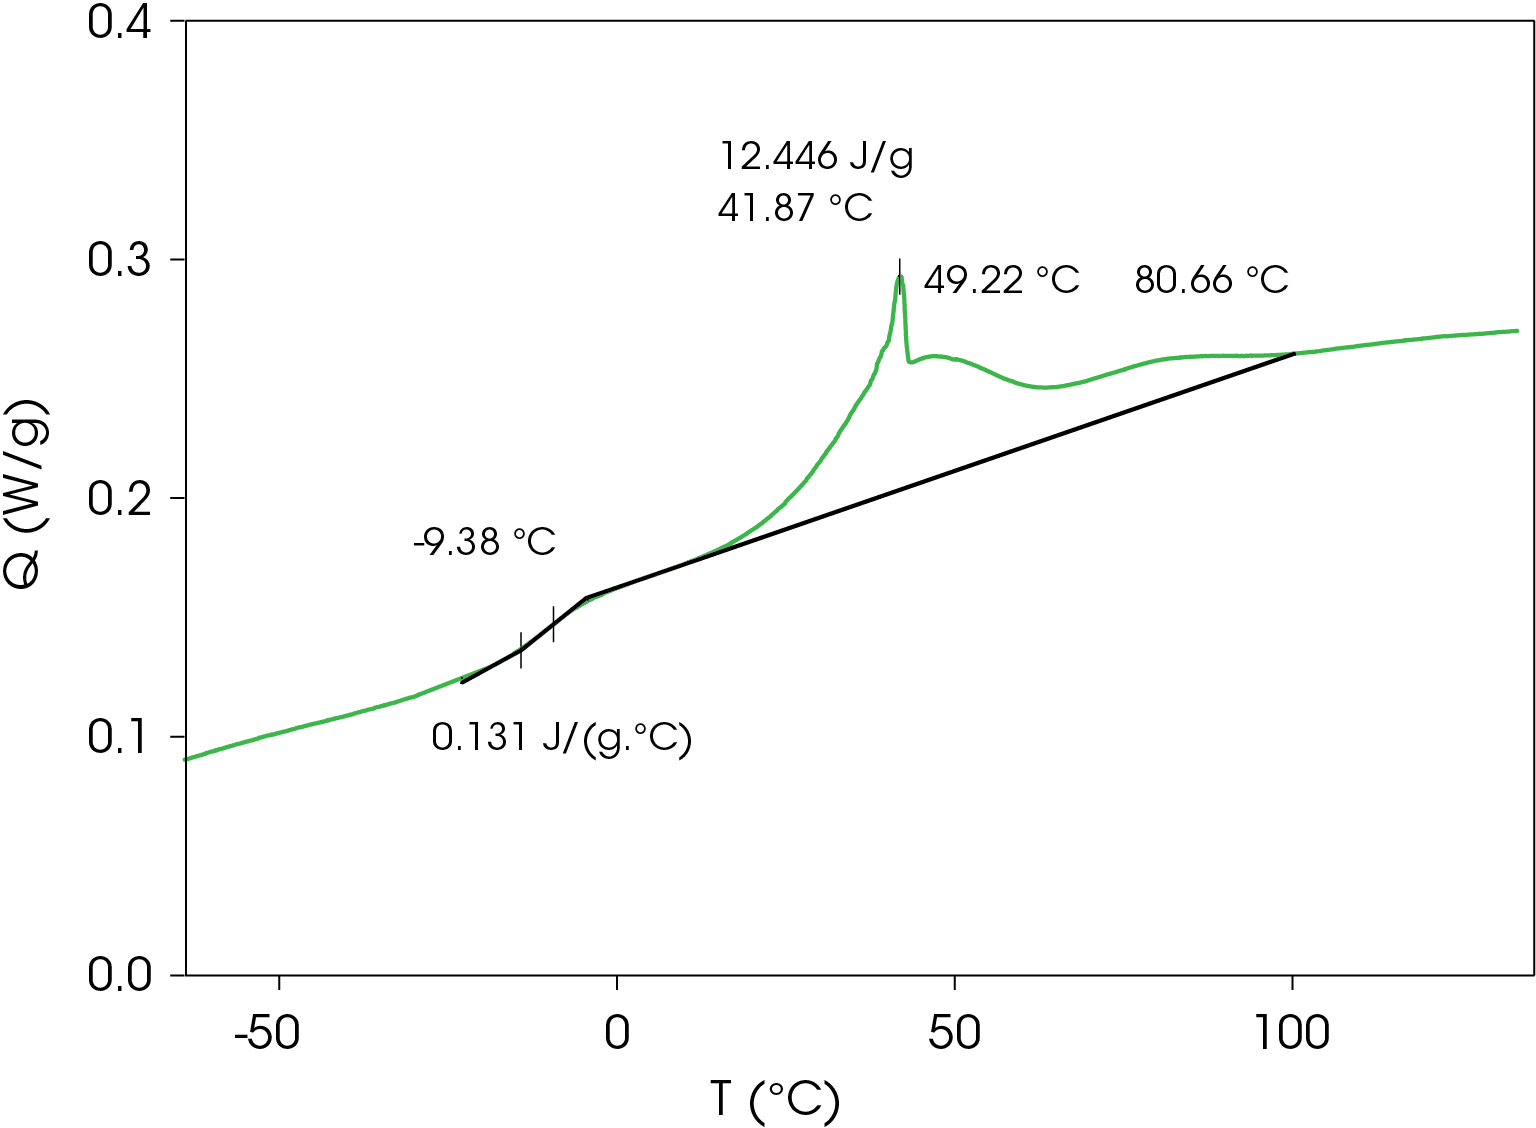
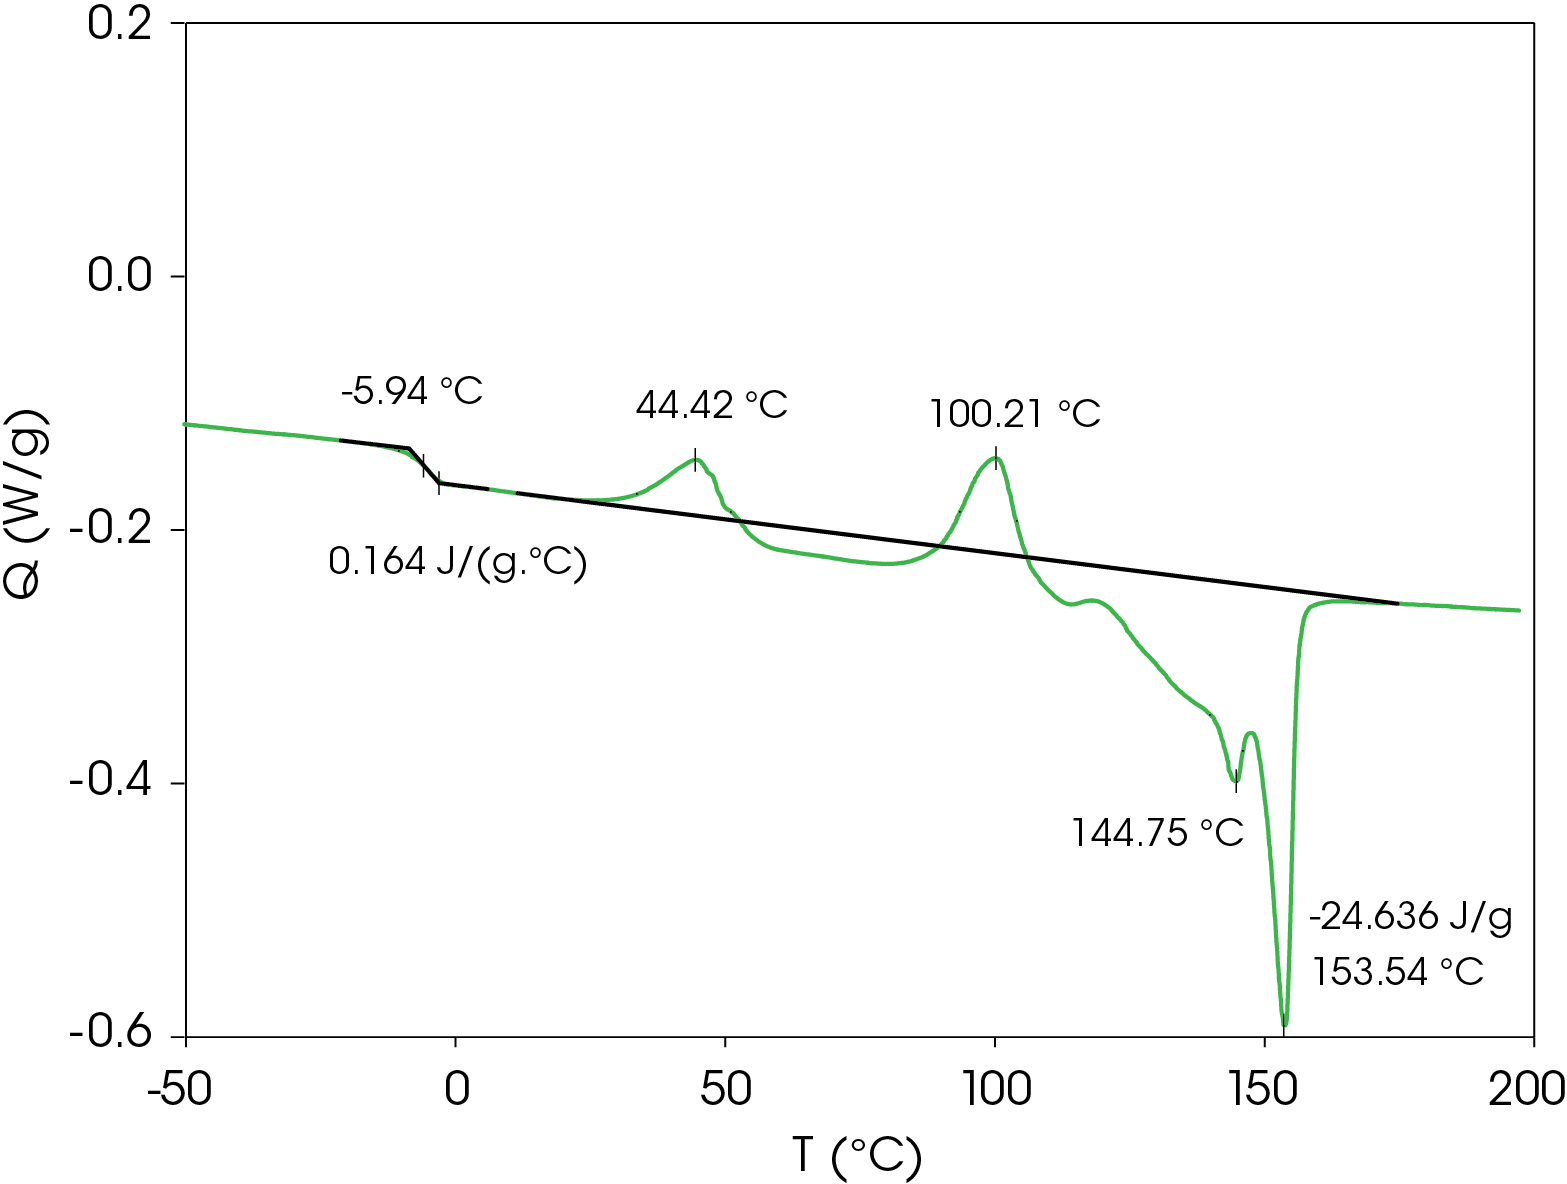
A summary of the resultant heat cool re-heat thermal data is shown in Table 3.
Table 3. Thermal data summary for PHB sample 10 °C / min
| 1st Heat | Cool | 2nd Heat | |
|---|---|---|---|
| TG (°C) | -4.38 | -9.38 | -5.94 |
| ΔCP (J /g °C) | 0.202 | 0.131 | 0.164 |
| TC 1 (°C) | 49.8 | 49.22 | 44.4 |
| TC 2 (°C) | 102.6 | 41.87 | 100.2 |
| TM 1 (°C) | 145.2 | – | 144.8 |
| TM 2 (°C) | 154.1 | – | 153.5 |
| ΔHF (J/g) | -14.67 | – | -24.64 |
| ΔHC (J/g) | – | 12.45 | – |
| ΔCP (J/g/ °C) | 0.202 | 0.131 | 0.164 |
First Heat Results
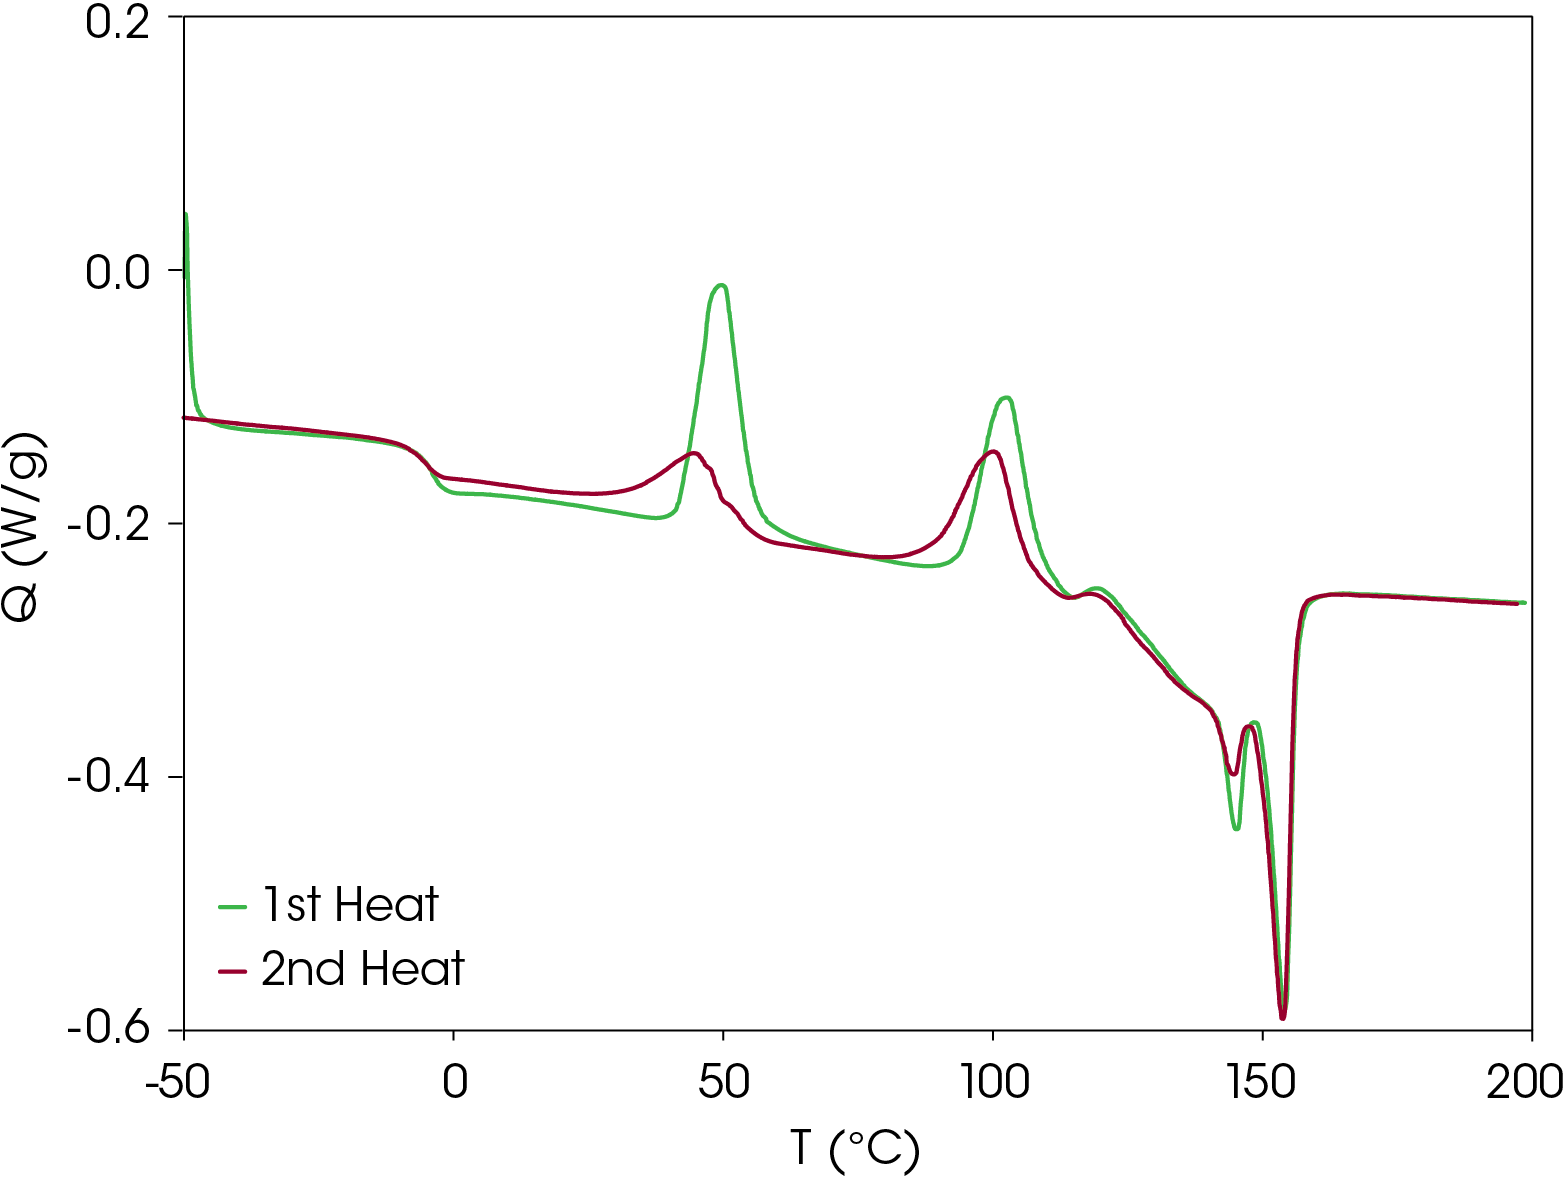
The DSC result for the first heat is shown in Figure 2. The Tg is -4.38 °C with a change in heat capacity of 0.202 J/g °C. Two cold crystallization transitions are observed at 49.83 and 102.63 °C. It appears that crystal perfection initiates after the second cold crystallization starting at about 120 °C, followed by melting peaks at 145.24 and 154.07 °C. Integrating forward of the glass transition to after the final melting endotherm yields a heat of fusion of -14.67 J/g (negative sign convention is chosen arbitrarily for endotherms). The heat of fusion indicates that the sample was not completely amorphous at the beginning of the experiment. The relatively low glass transition and low onset of the first cold crystallization peak means the sample would have to be quenched and kept at a temperature below Tg until loading in the DSC if analysis of a completely amorphous sample is desired.
Cooling Results
Figure 3 shows a series of complicated crystallization exotherms with a sharp peak at 41.87 °C. A glass transition occurs at -9.38 °C with a change in heat capacity of 0.131 J/g °C.
Second Heat Results
Second heat flow data is shown in Figure 4. Even at cooling rate of 10 °C/min, the resin forms metastable crystal structures that also show two cold crystallization transitions and similar transitions observed in the first heat. The low glass transition and relatively low onset of cold crystallization means that the metastable structures formed under typical processing conditions may crystallize and the amorphous phase may undergo enthalpic relaxation. Both phenomena are associated with physical changes that may affect the end-use properties of the resin. The energy associated with enthalpic relaxation known as enthalpic recovery can be analyzed and quantified using MDSC [3]. An overlay comparison of the first and second heats is shown in Figure 5.
Comparison of Heating Rates
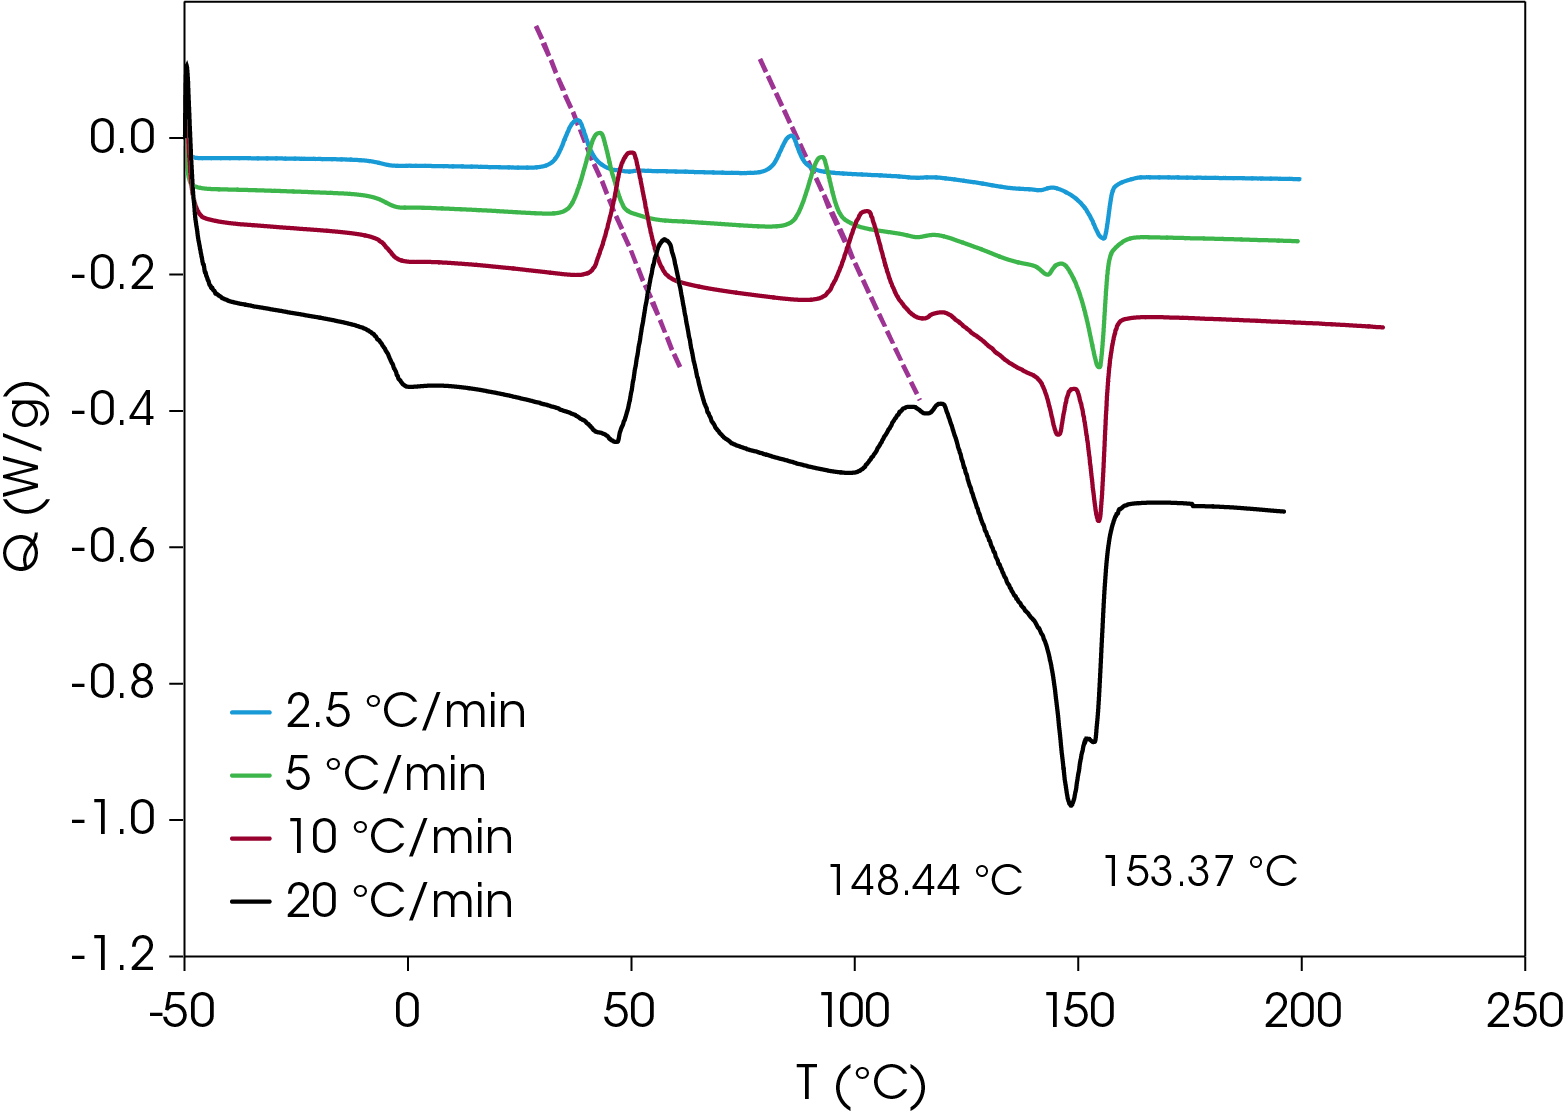
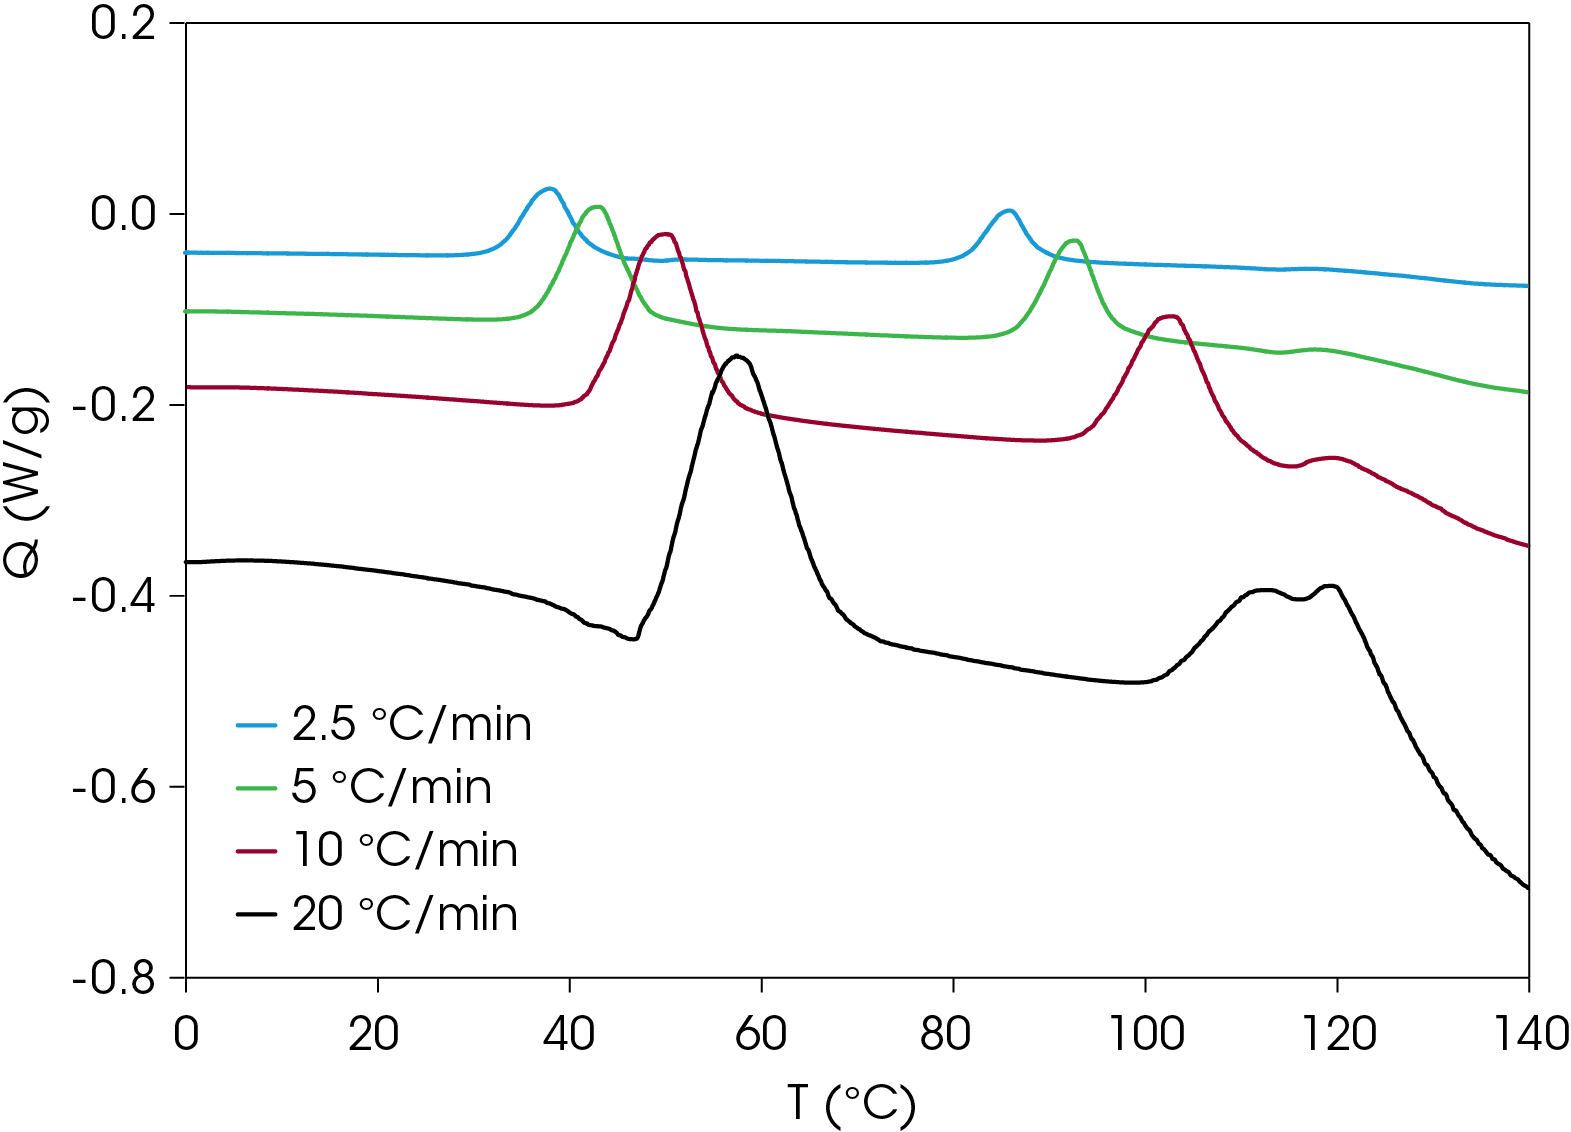
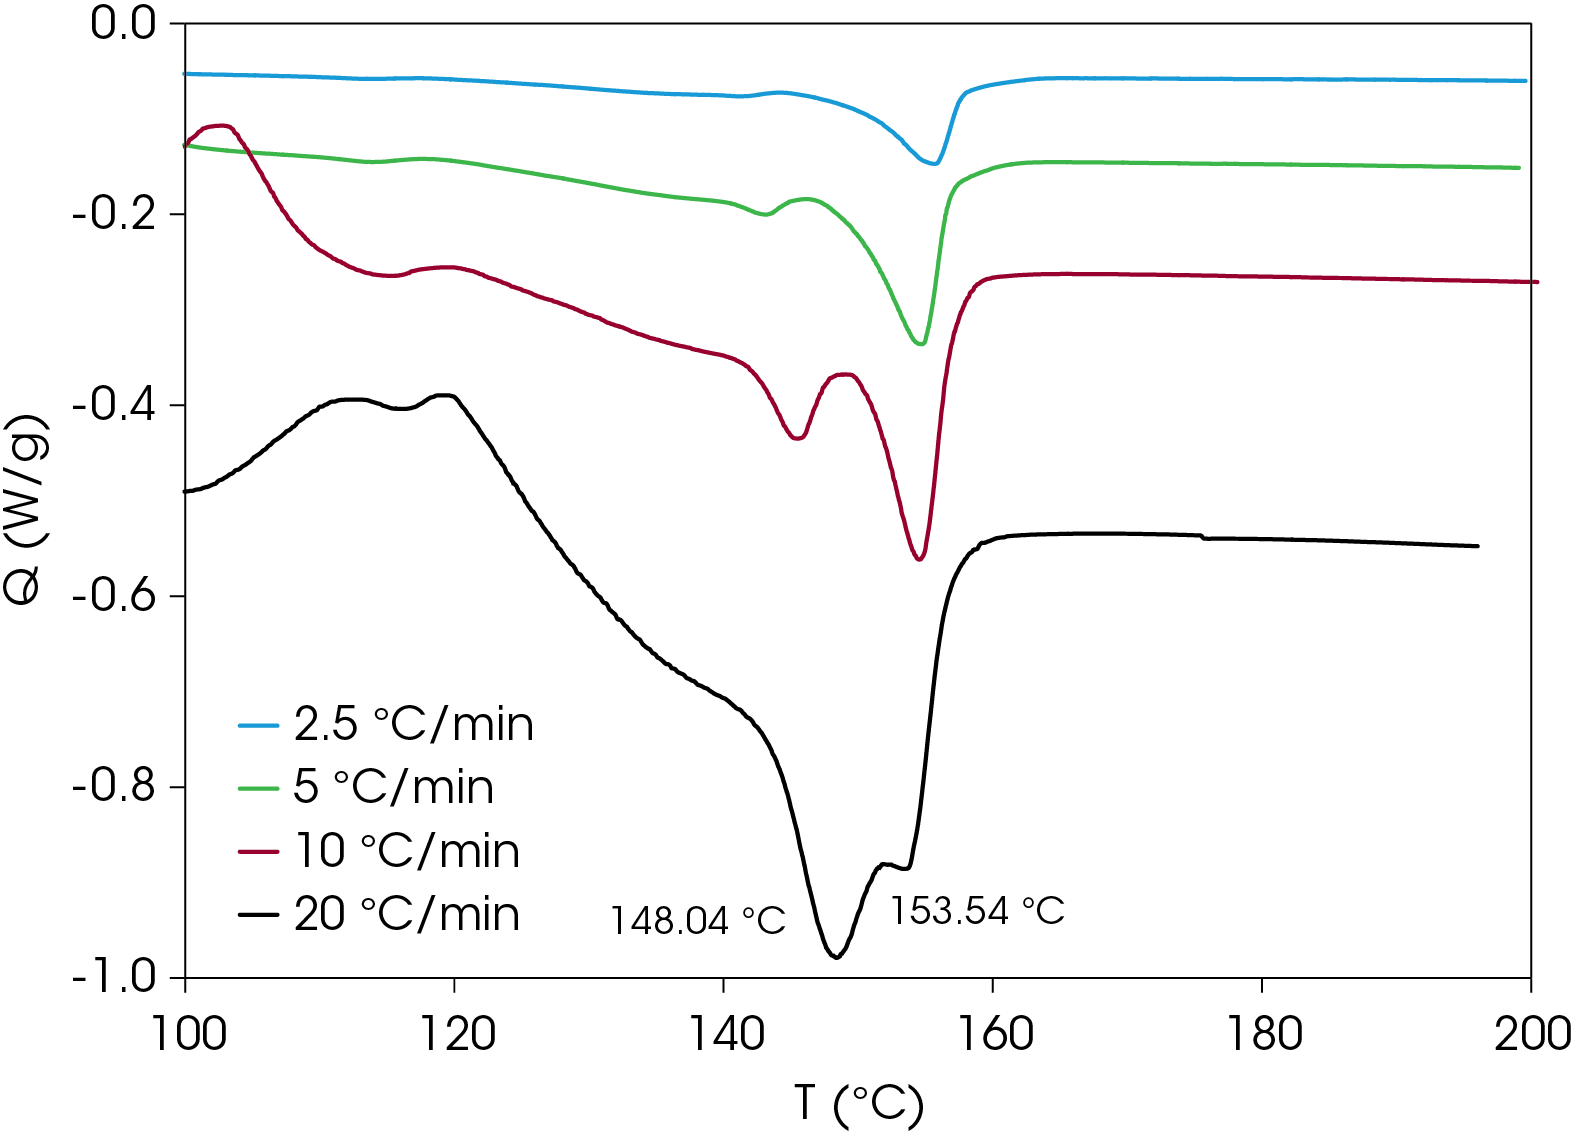
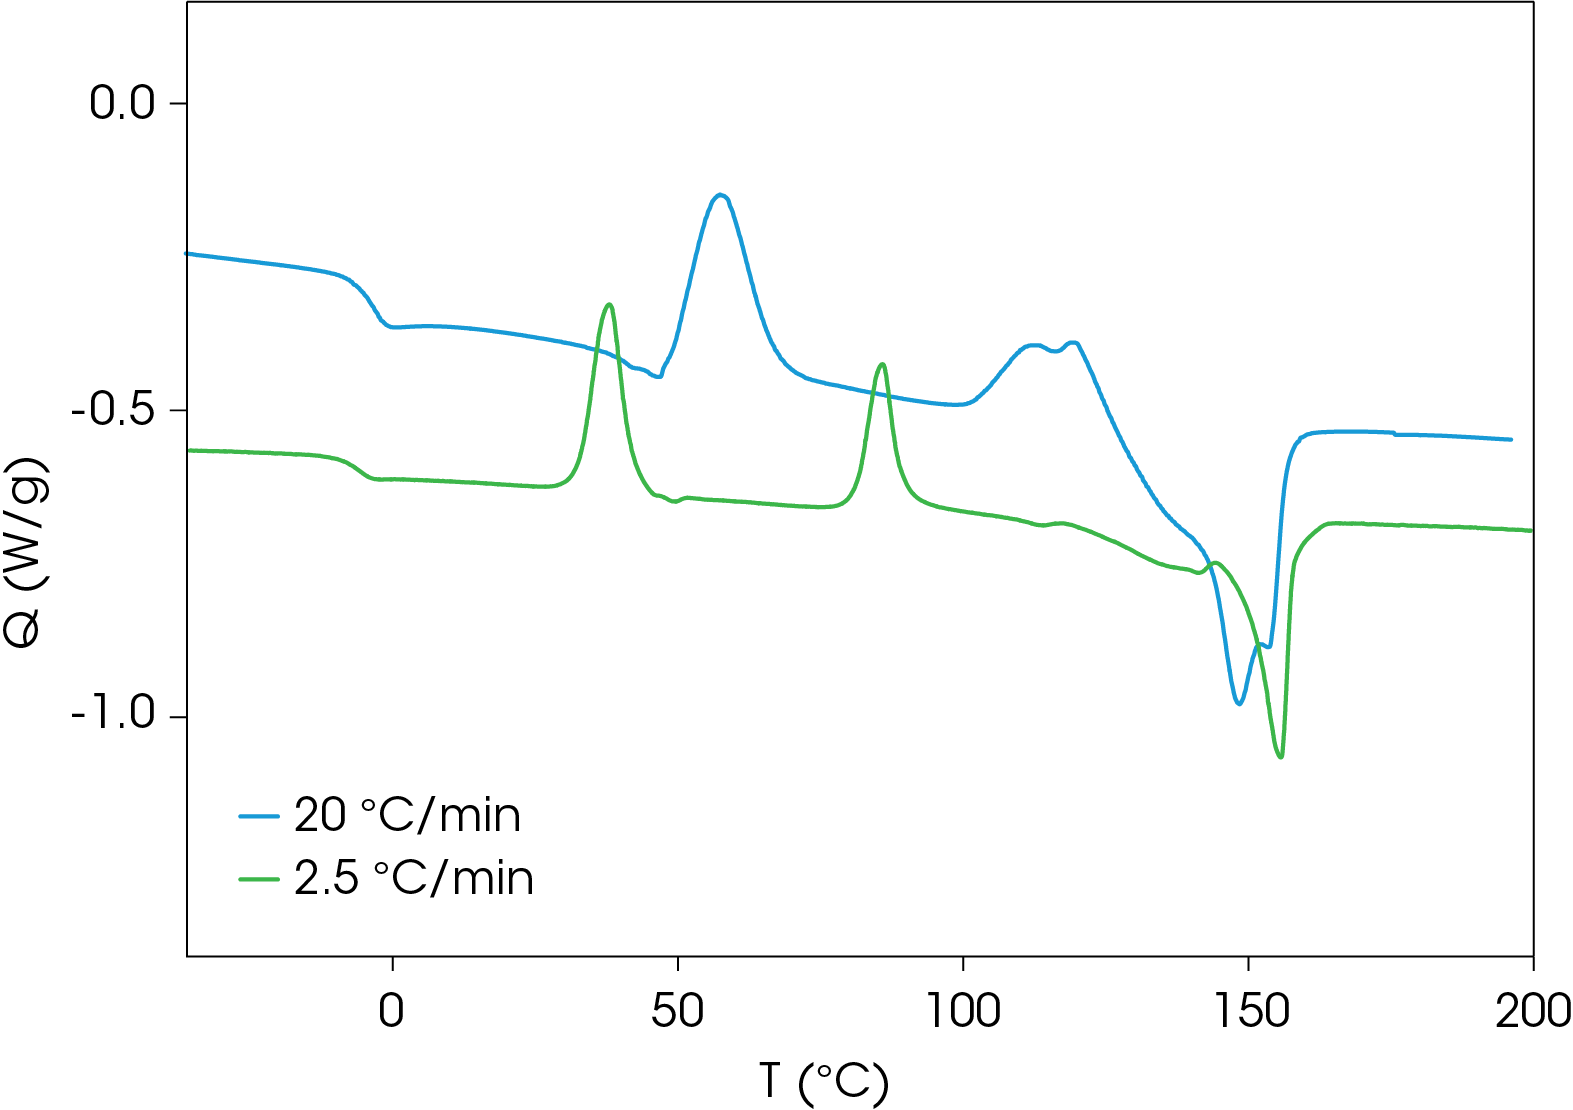
A comparison of heat flow at different heating rates of the rapidly cooled samples is shown in Figure 6. The peak temperature shift is observed in the cold crystallization exotherms, which is consistent with kinetic transitions (Figure 7) with two major melting temperatures (Figure 8) remaining approximately constant consistent with thermodynamic transitions. With increasing heating rate, the lower melting transition becomes more intense relative to the higher melting transition. This implies that the cold crystallization that results in the higher melt transition is partially suppressed with higher heating rates. The predominance of the higher melting transition at the lower heating rate implies that it is the more stable form when the samples are cooled quickly from the melt and heated slowly. This is demonstrated in Figure 9, which compares the slowest and fastest heating rates used in the experiment. Two cold crystallizations are unusual and may originate due to interaction of the PHB and wood flour filler, which is composed of cellulose, lignin, etc. TGA analysis shows two close mass losses through the main decomposition temperature range [2]. The kinetics of crystallization of both forms should be evaluated, as well as the effects of annealing. This will be the subject of a future application note.
Modulated DSC Results of PHB
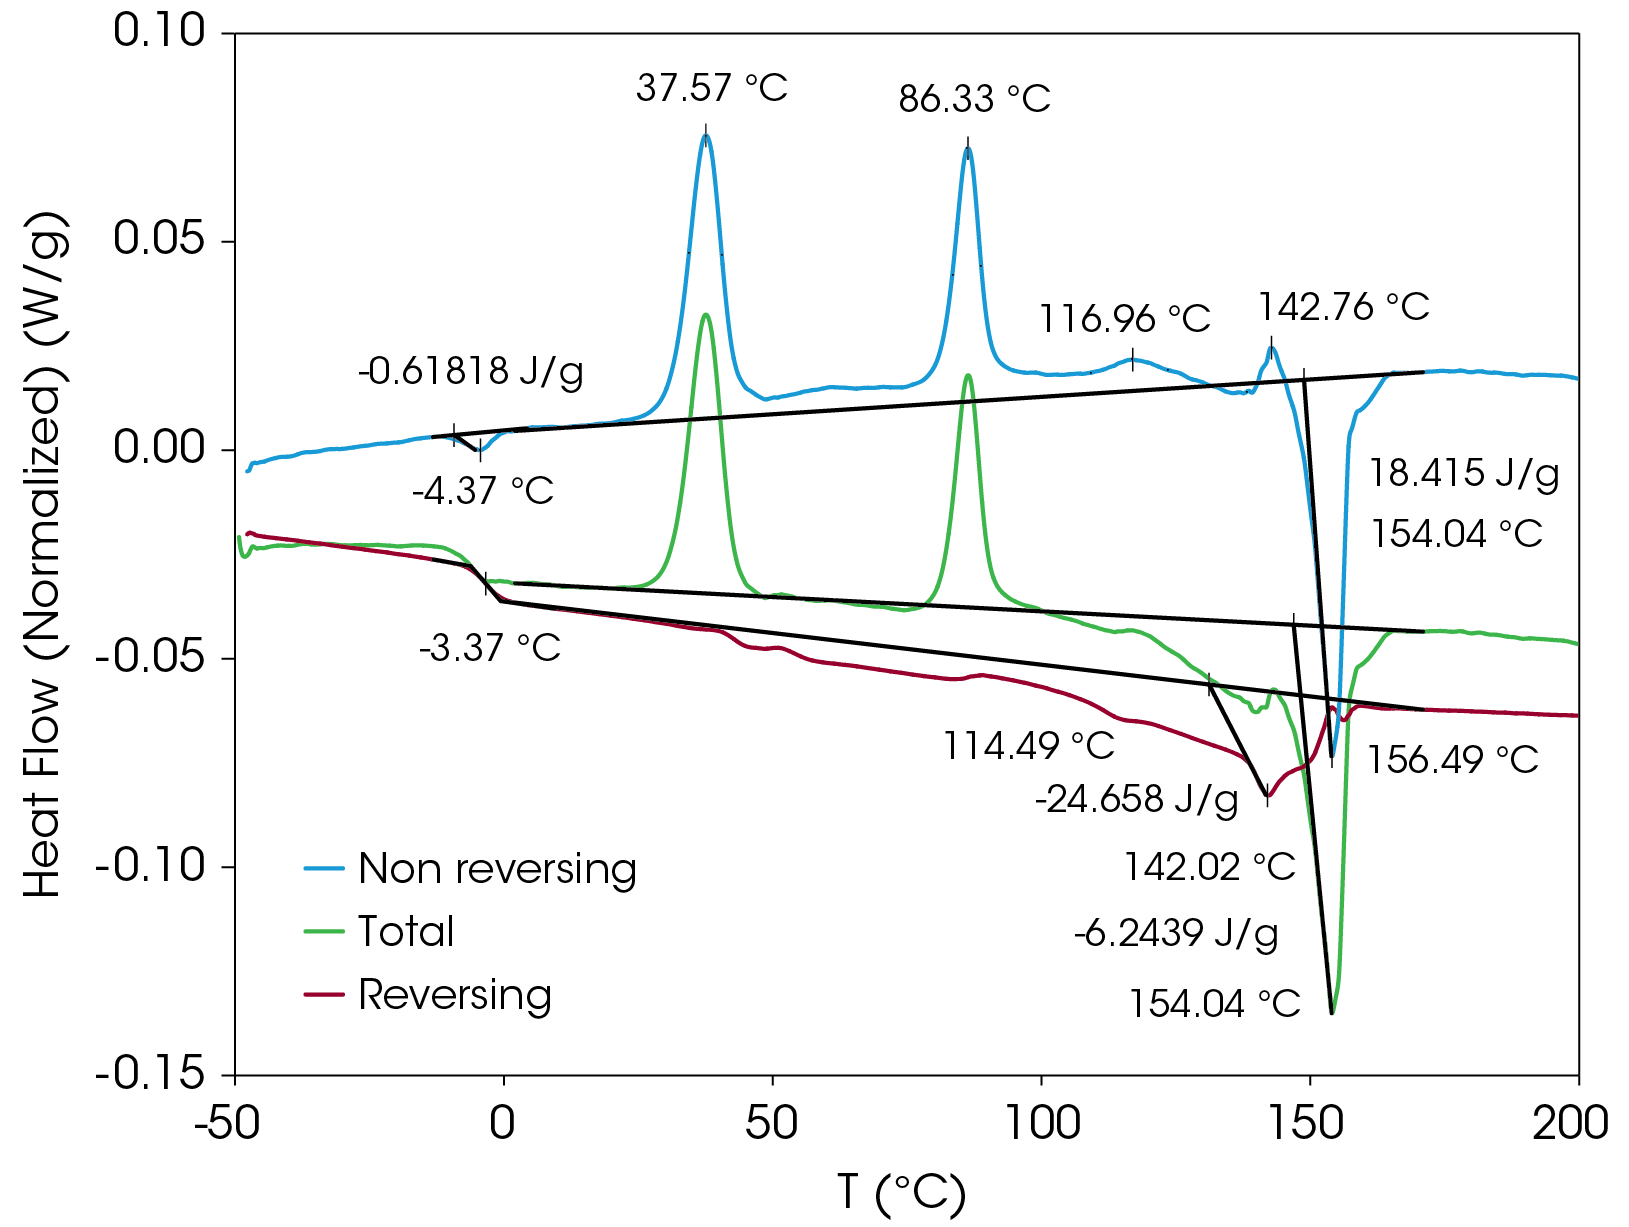
MDSC experiments were run on the sample to separate thermodynamic from kinetic heat flow events in the sample. The sample was heated to 220 °C and cooled quickly to -50 °C to induce as much amorphous structure as possible. Rapid cooling was done in the instrument to minimize the time above the glass transition temperature. The conditions for the MDSC experiment are shown in Table 2 and the results are shown with transitions annotated in Figure 10. Analysis of the transitions is shown in Figure 11. The total heat flow (green) is the summation of the reversing (red) and non-reversing (blue) heat flows.
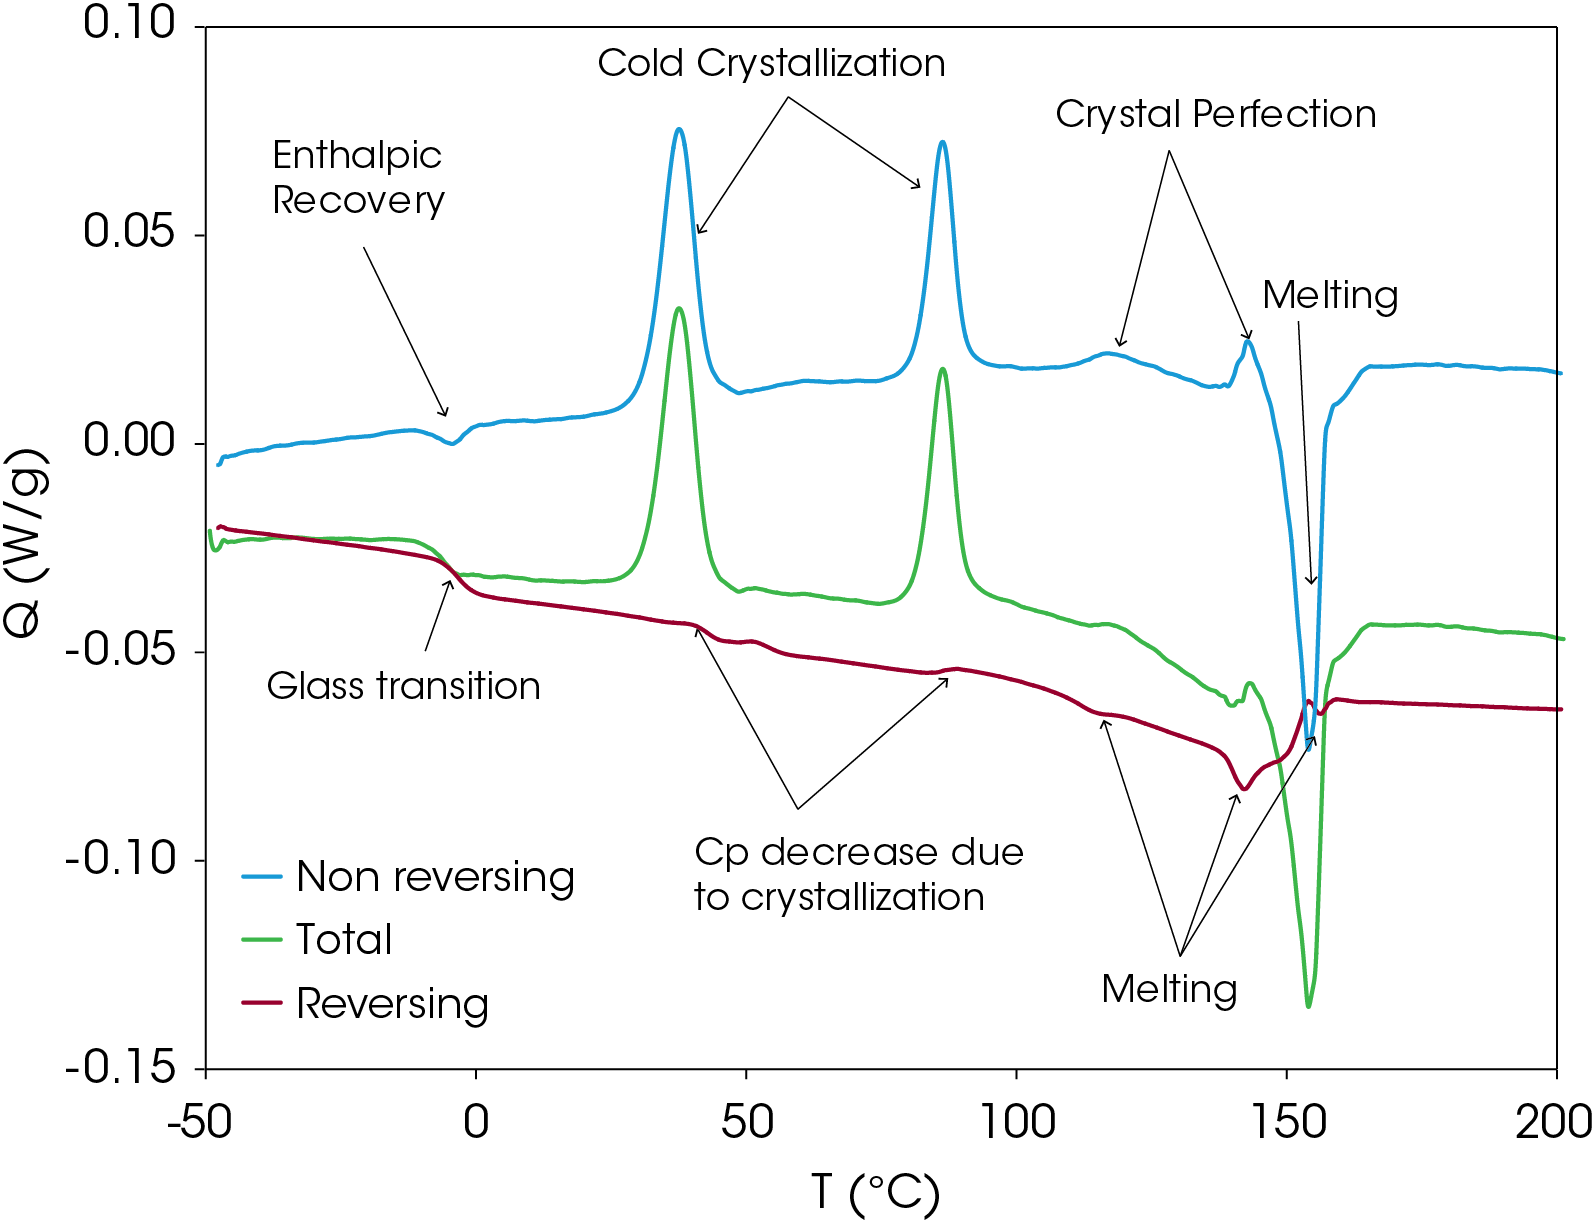
The non-reversing heat flow contains several transitions including enthalpic recovery at -4.37 °C, a cold crystallization peak at 37.57 °C, a second cold crystallization peak at 86.33 °C, crystal perfection peaks at 116.96 and 142.76 °C and a melting peak at 154.04 °C. The total non-reversing heat of fusion is 18.415 J/g; the positive value indicates that the net heat flow is exothermic.
The reversing heat flow shows a glass transition at -3.37 °C, melting peaks at 114.49, 142.02, and 156.49 °C. The reversing heat of fusion is -24.658 J/g. Summing the reversing and nonreversing heats of fusion yields a value of -6.244 J/g.
The MDSC experiment yields some important information about this sample. The appearance of the enthalpic recovery at the glass transition indicates that under modest cooling conditions, the resin readily goes through enthalpic relaxation, which is associated with brittle fracture, among other things. This may be a determining factor in processing conditions. The energy associated with enthalpic recovery can be determined and corrections for frequency effect can be made [3].
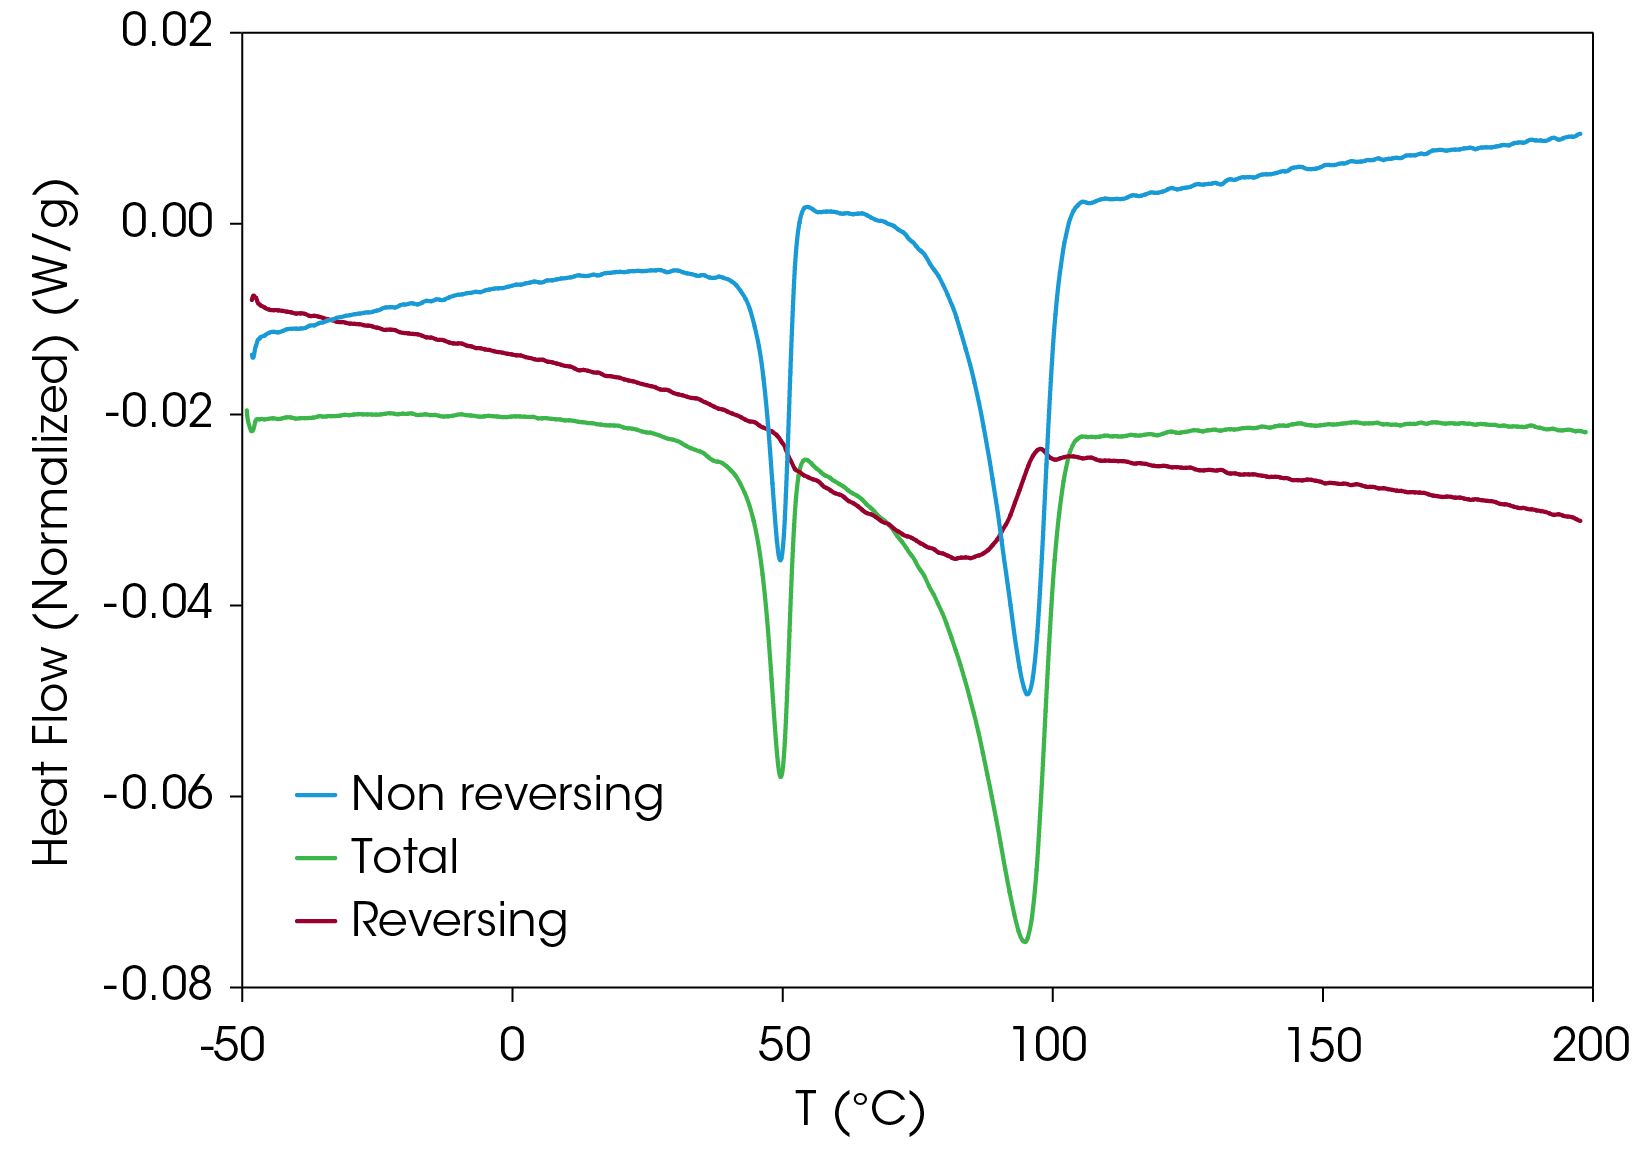
Most of the melting occurs in the non-reversing heat flow signal, suggesting the resin composed of structure that the heat flow is not able to follow the temperature variation inherent in the the MDSC experiment. Often the non-reversing heat flow is associated with the kinetic contribution to the total heat flow. This is not the case in these samples as variation of the heating rate does not result in an appreciable change in the melting transition temperatures contrasted with the crystallization temperatures.
The interaction of carbonyls in PHB with the hydroxyl groups in the cellulose and phenolics in lignin in the added wood flour [4] likely contributes to the non-reversing heat flow. The predominance of non-reversing heat flow is also observed in the SURLYN™ ionomer (Figure 12) and some PLA resins.
Slow Cooling Results
The samples were once again heated above the melting temperature and cooled at a rate of 1 °C/min to allow as much crystal structure to develop as possible. Crystallization peaks are found at 105.6, 76.5, and 42.9 °C with a total heat of crystallization of 36.40 J/g. The glass transition occurs at -17.28 °C. The DSC data is shown in Figure 13.
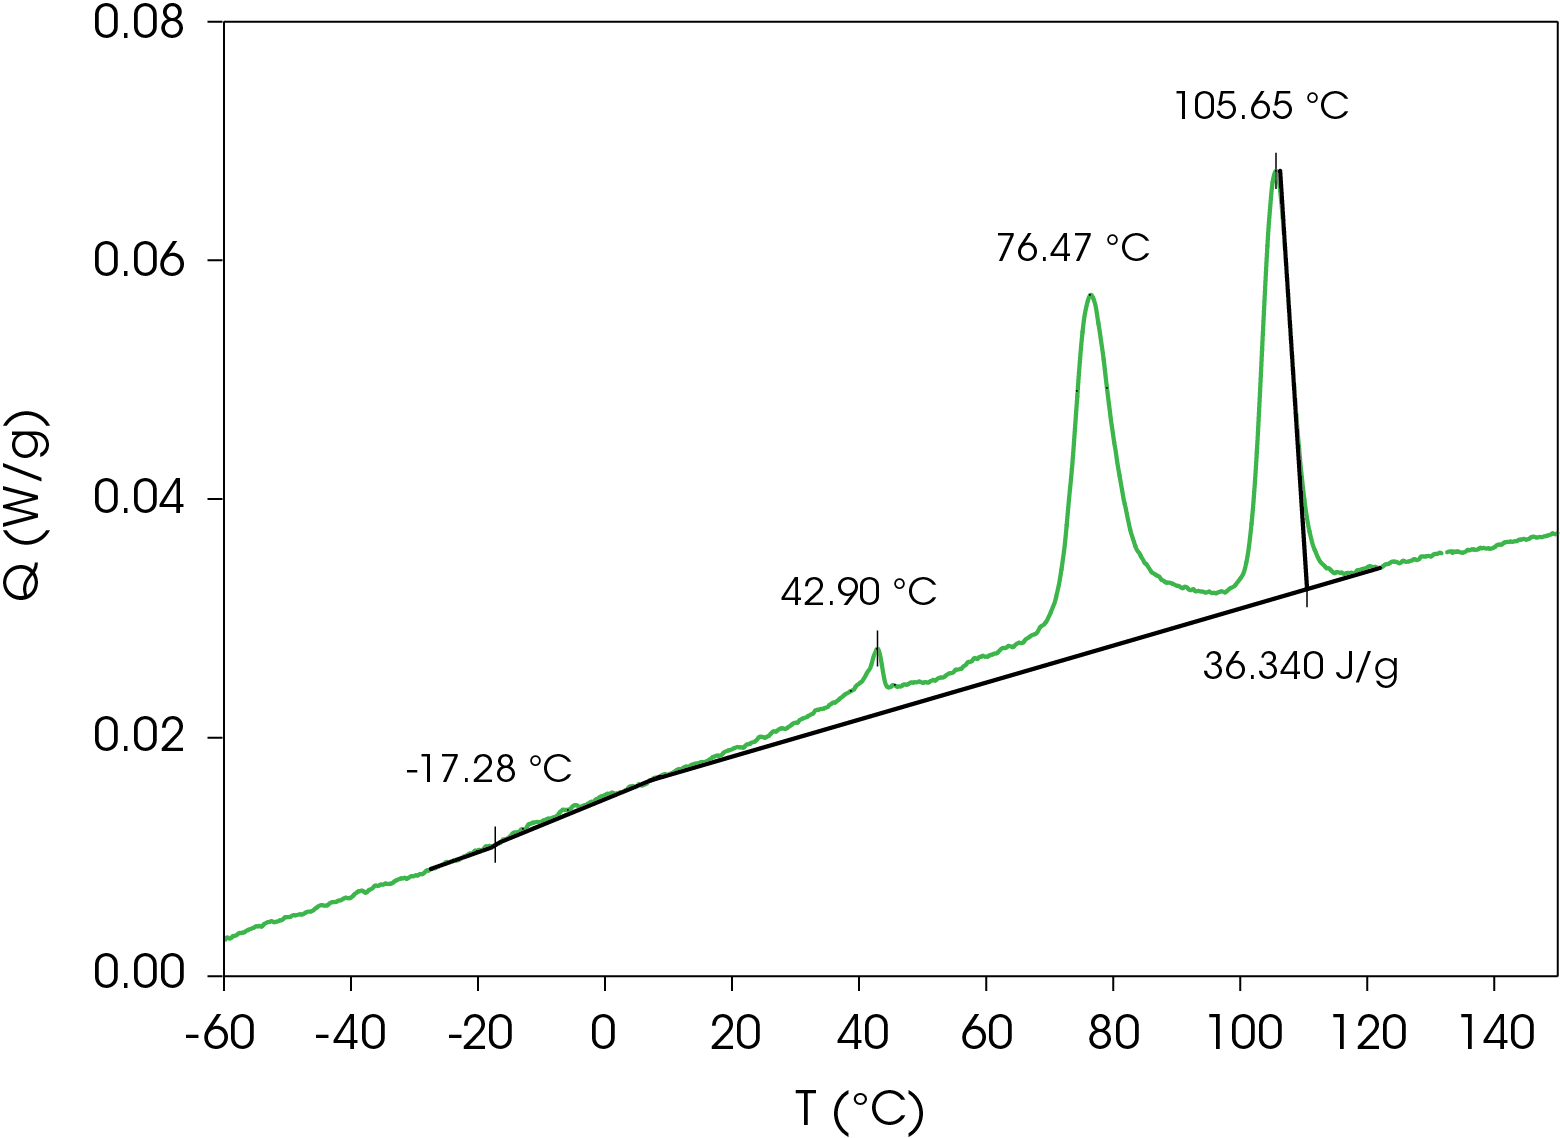
The cooling data was curve fit, revealing the obvious peaks and two broad exotherms at 61.7 and 37.3 °C and is shown in Figure 14. The area percent and calculated contribution to the heat of crystallization is shown in Table 4.
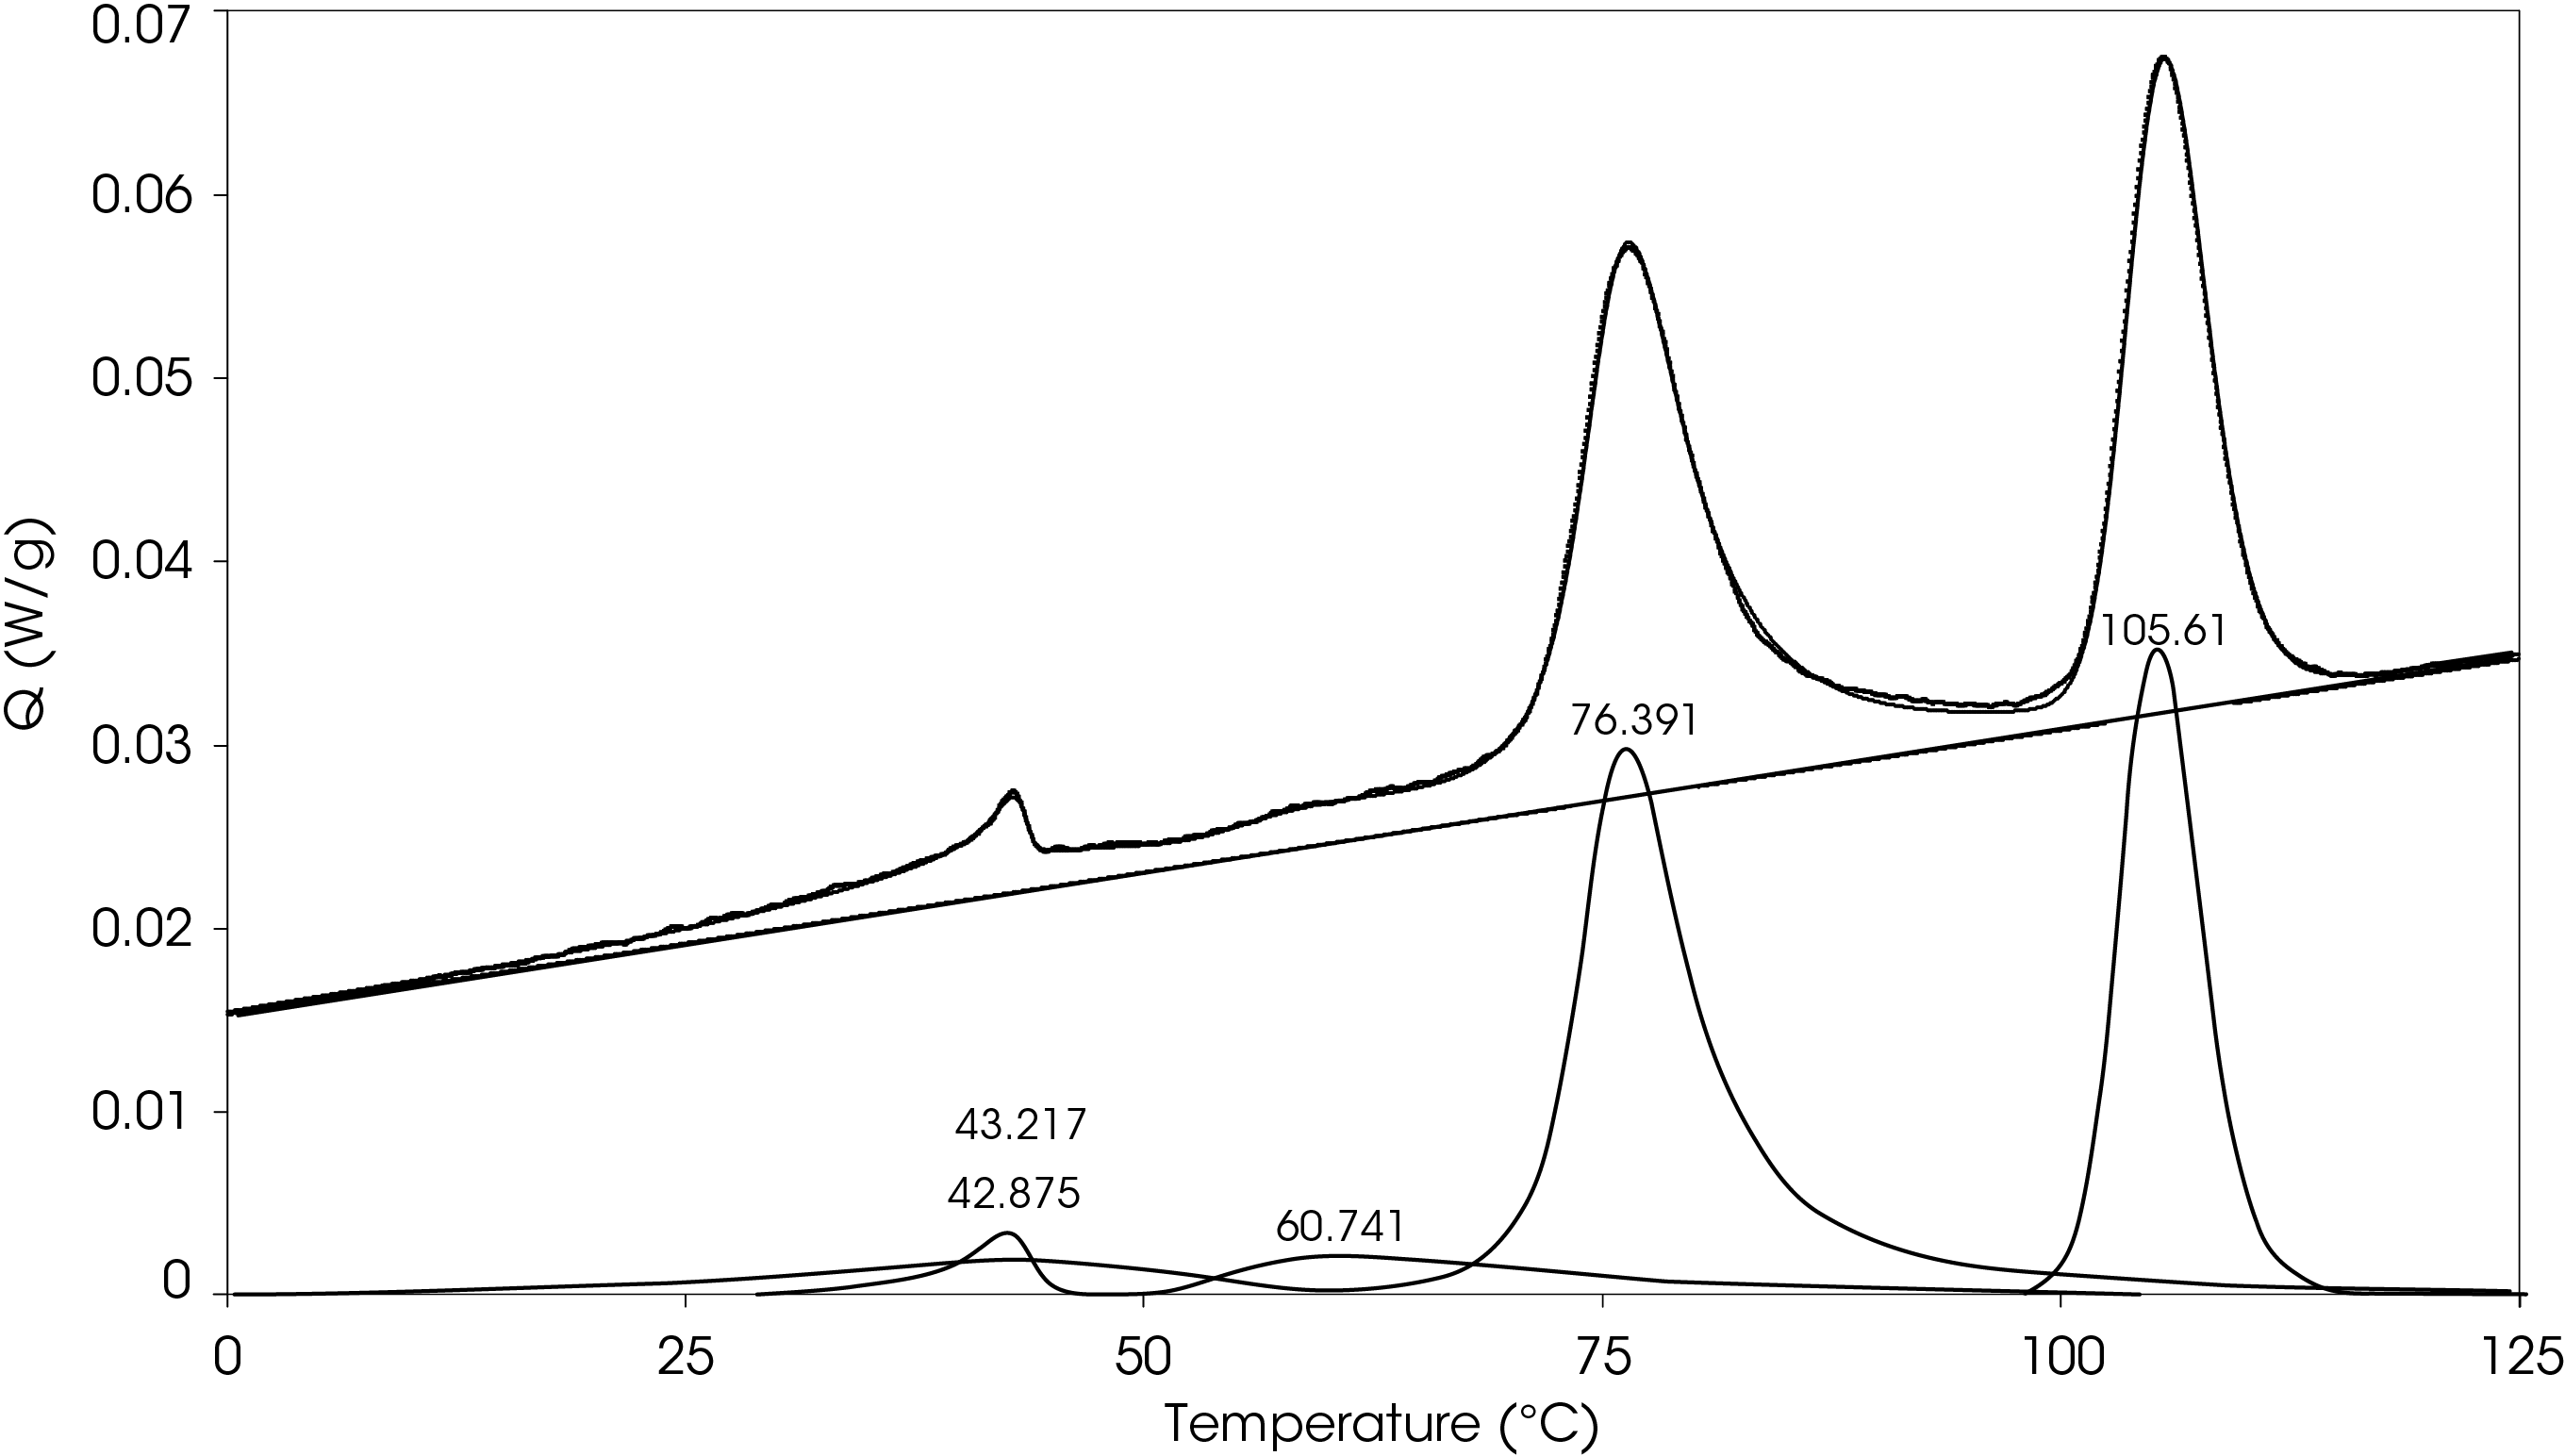
Table 4. Relative contributions of crystallization exotherms
| Peak Position °C | % Area | ΔHC (J/g) |
|---|---|---|
| 105.6 | 33.1 | 12.04 |
| 76.39 | 49.0 | 17.79 |
| 60.74 | 6.98 | 2.54 |
| 43.22 | 8.30 | 3.02 |
| 42.88 | 2.64 | 0.96 |
A heating rate of 5 °C/min was chosen to heat the sample after the slow cooling cycle. A glass transition was observed at -10.87 °C with a change in heat capacity of -0.111 J/g °C. Several melting transitions were observed including 46.36 (split), 124.68, 136.42, 147.26, and 155.35 °C, as well as an apparent crystal perfection exotherm at 128.78 °C. The relative contributions of the thermal transitions were calculated by curve fitting (Figure 16) and are shown in Table 5. The most prominent melt transitions are the two highest at 147.26 and 155.35 °C. No cold crystallization peaks were observed, implying that except for some crystal perfection, relatively stable crystal forms nucleate when the sample is cooled slowly, a sharp contrast to a cooling rate of 10°C/min.
Table 5. Relative contributions of melting endotherms and crystal perfection exotherm
| Peak Position °C | % Area | ΔH (J/g) |
|---|---|---|
| 45.35 | 1.652 | -0.66 |
| 49.97 | 2.101 | -0.84 |
| 125.13 | 1.018 | -0.41 |
| 130.3 | -6.927 | 2.77 |
| 137.84 | 66.503 | -26.55 |
| 147.29 | 10.135 | -4.05 |
| 155.19 | 25.516 | -10.19 |
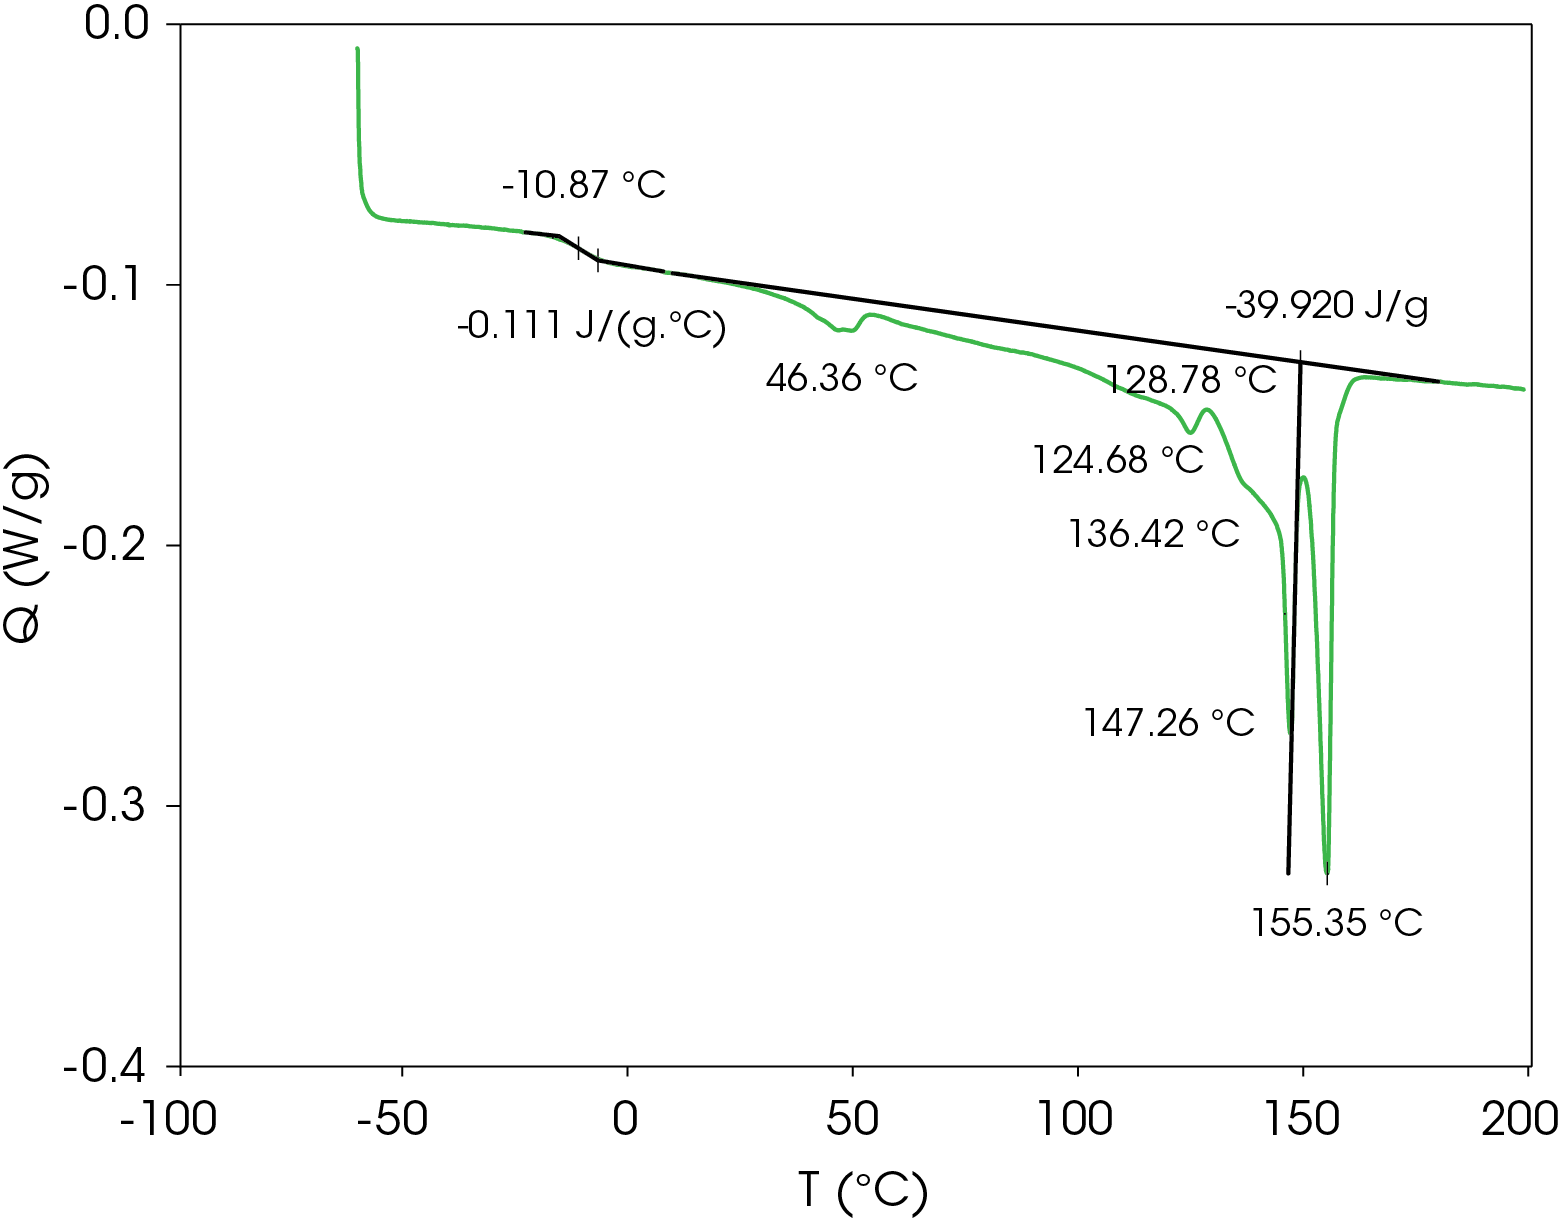
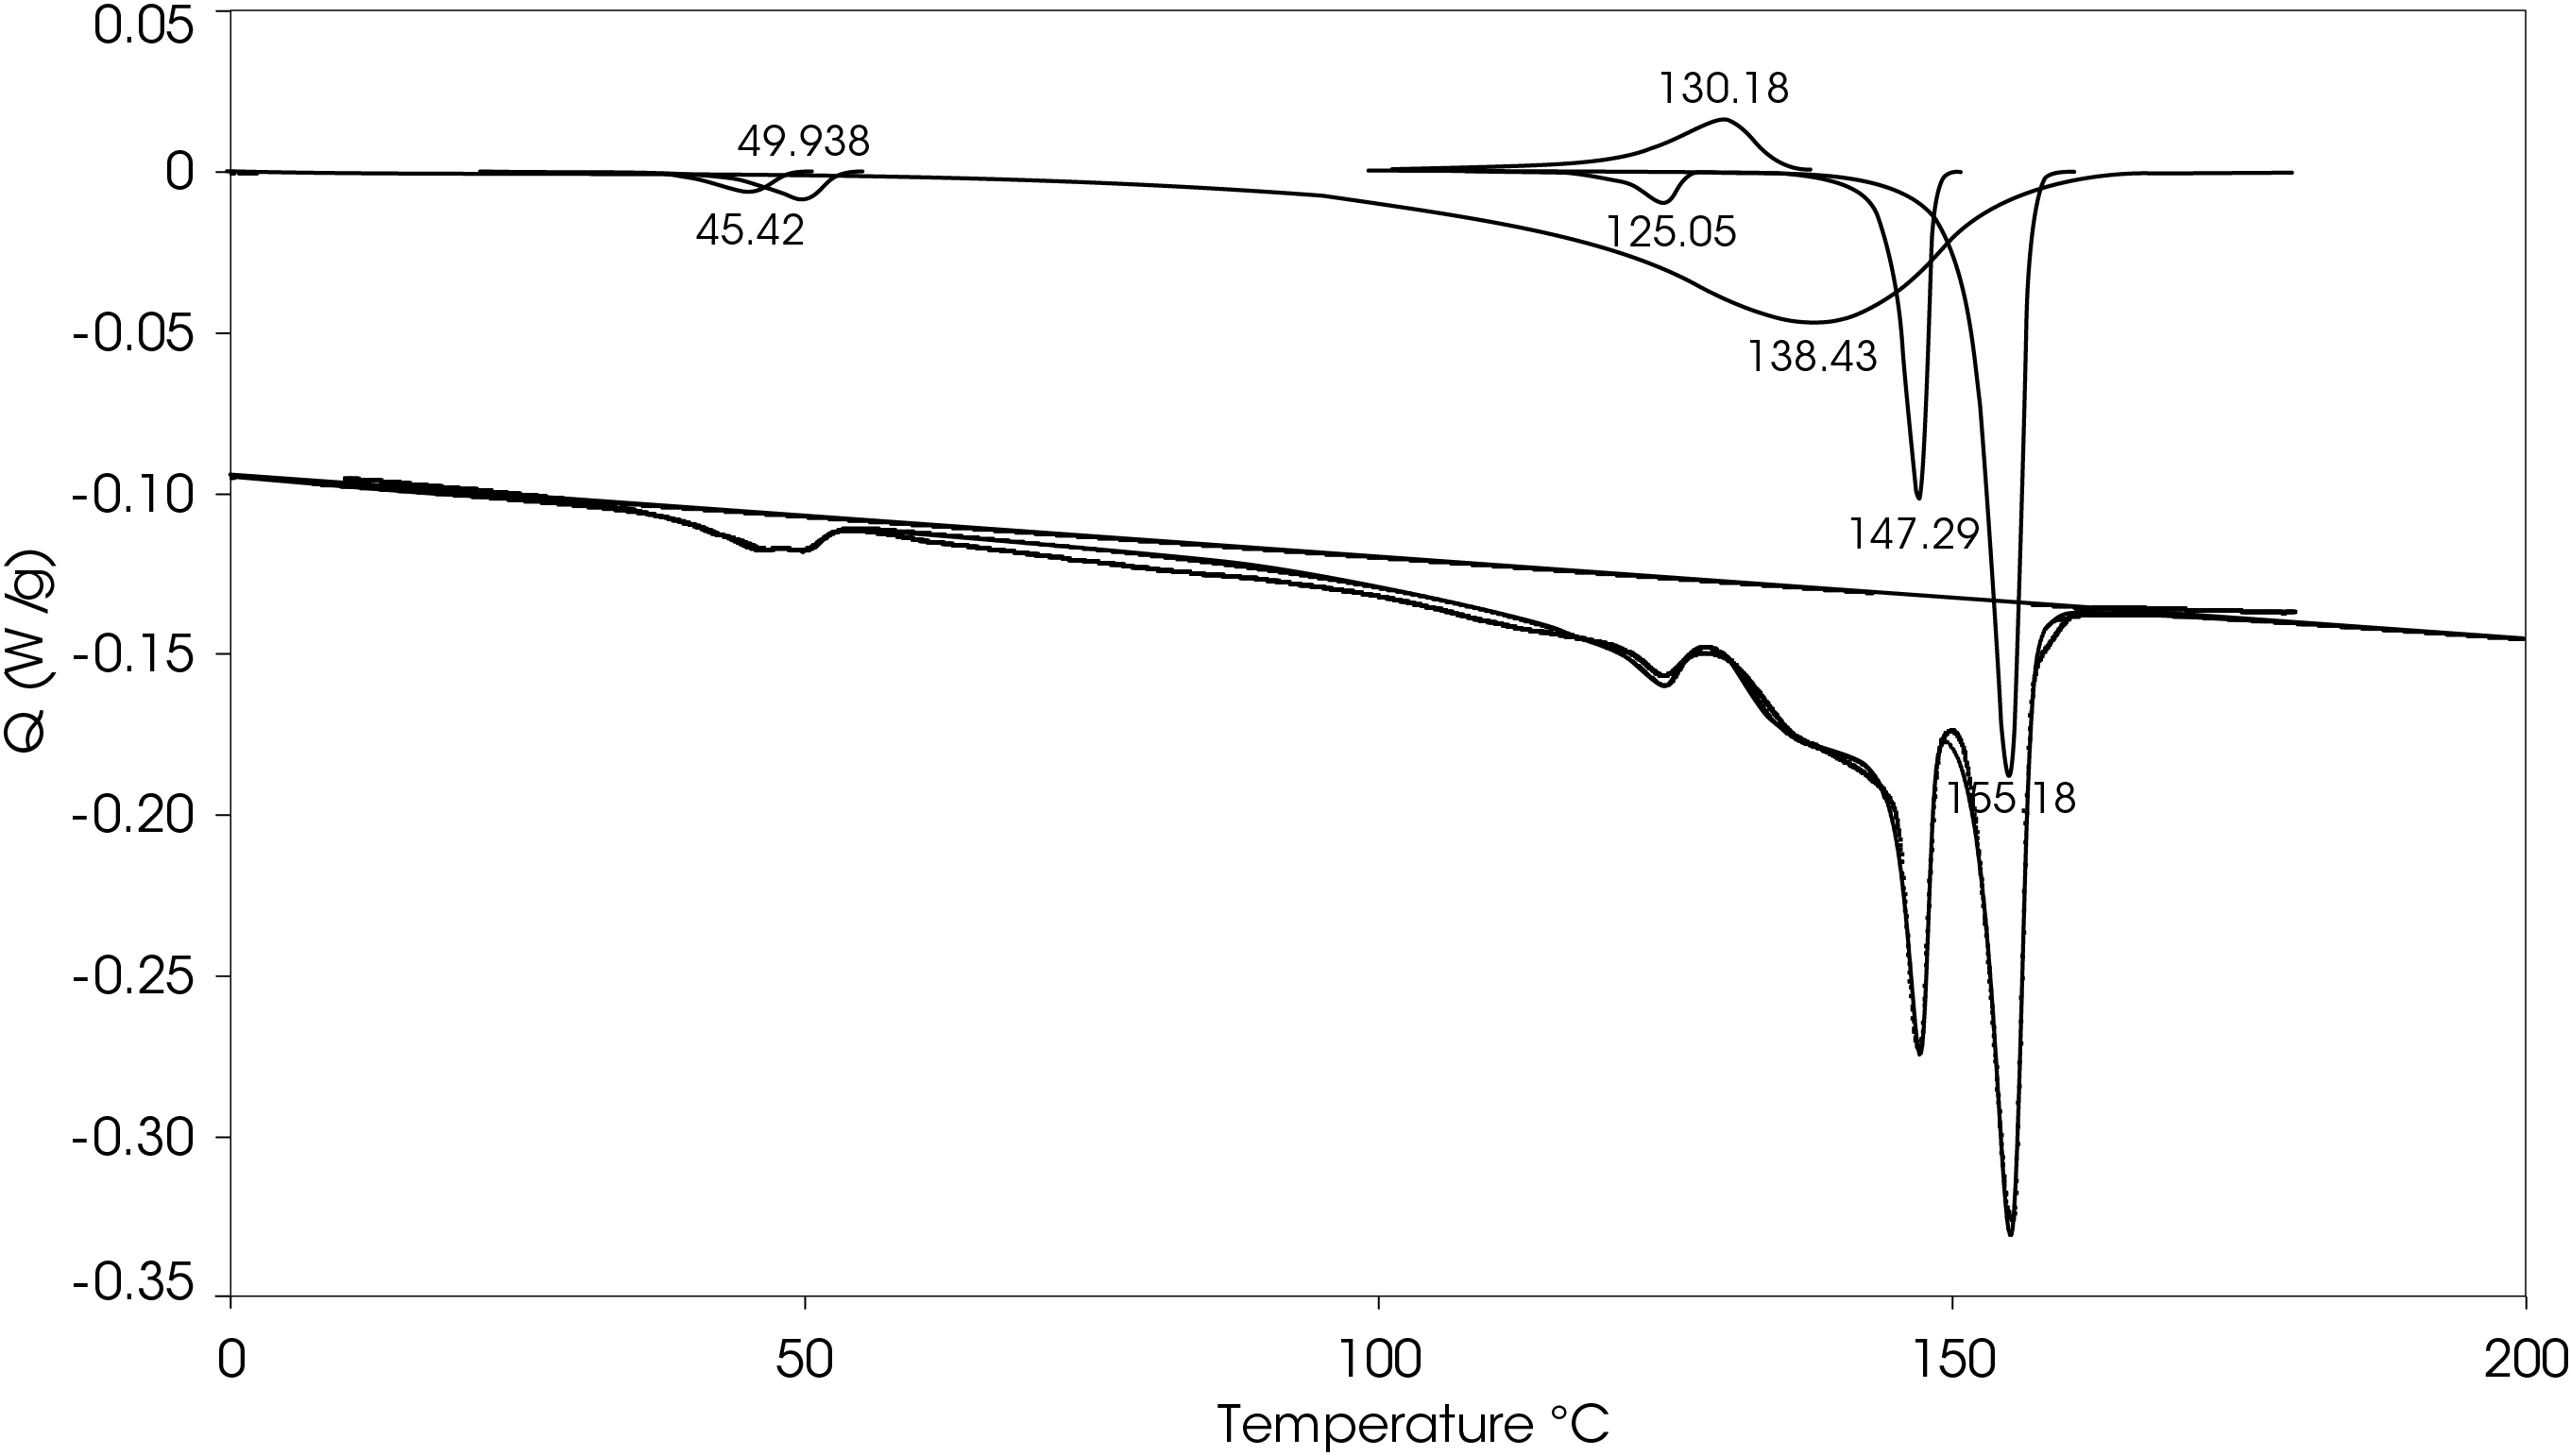
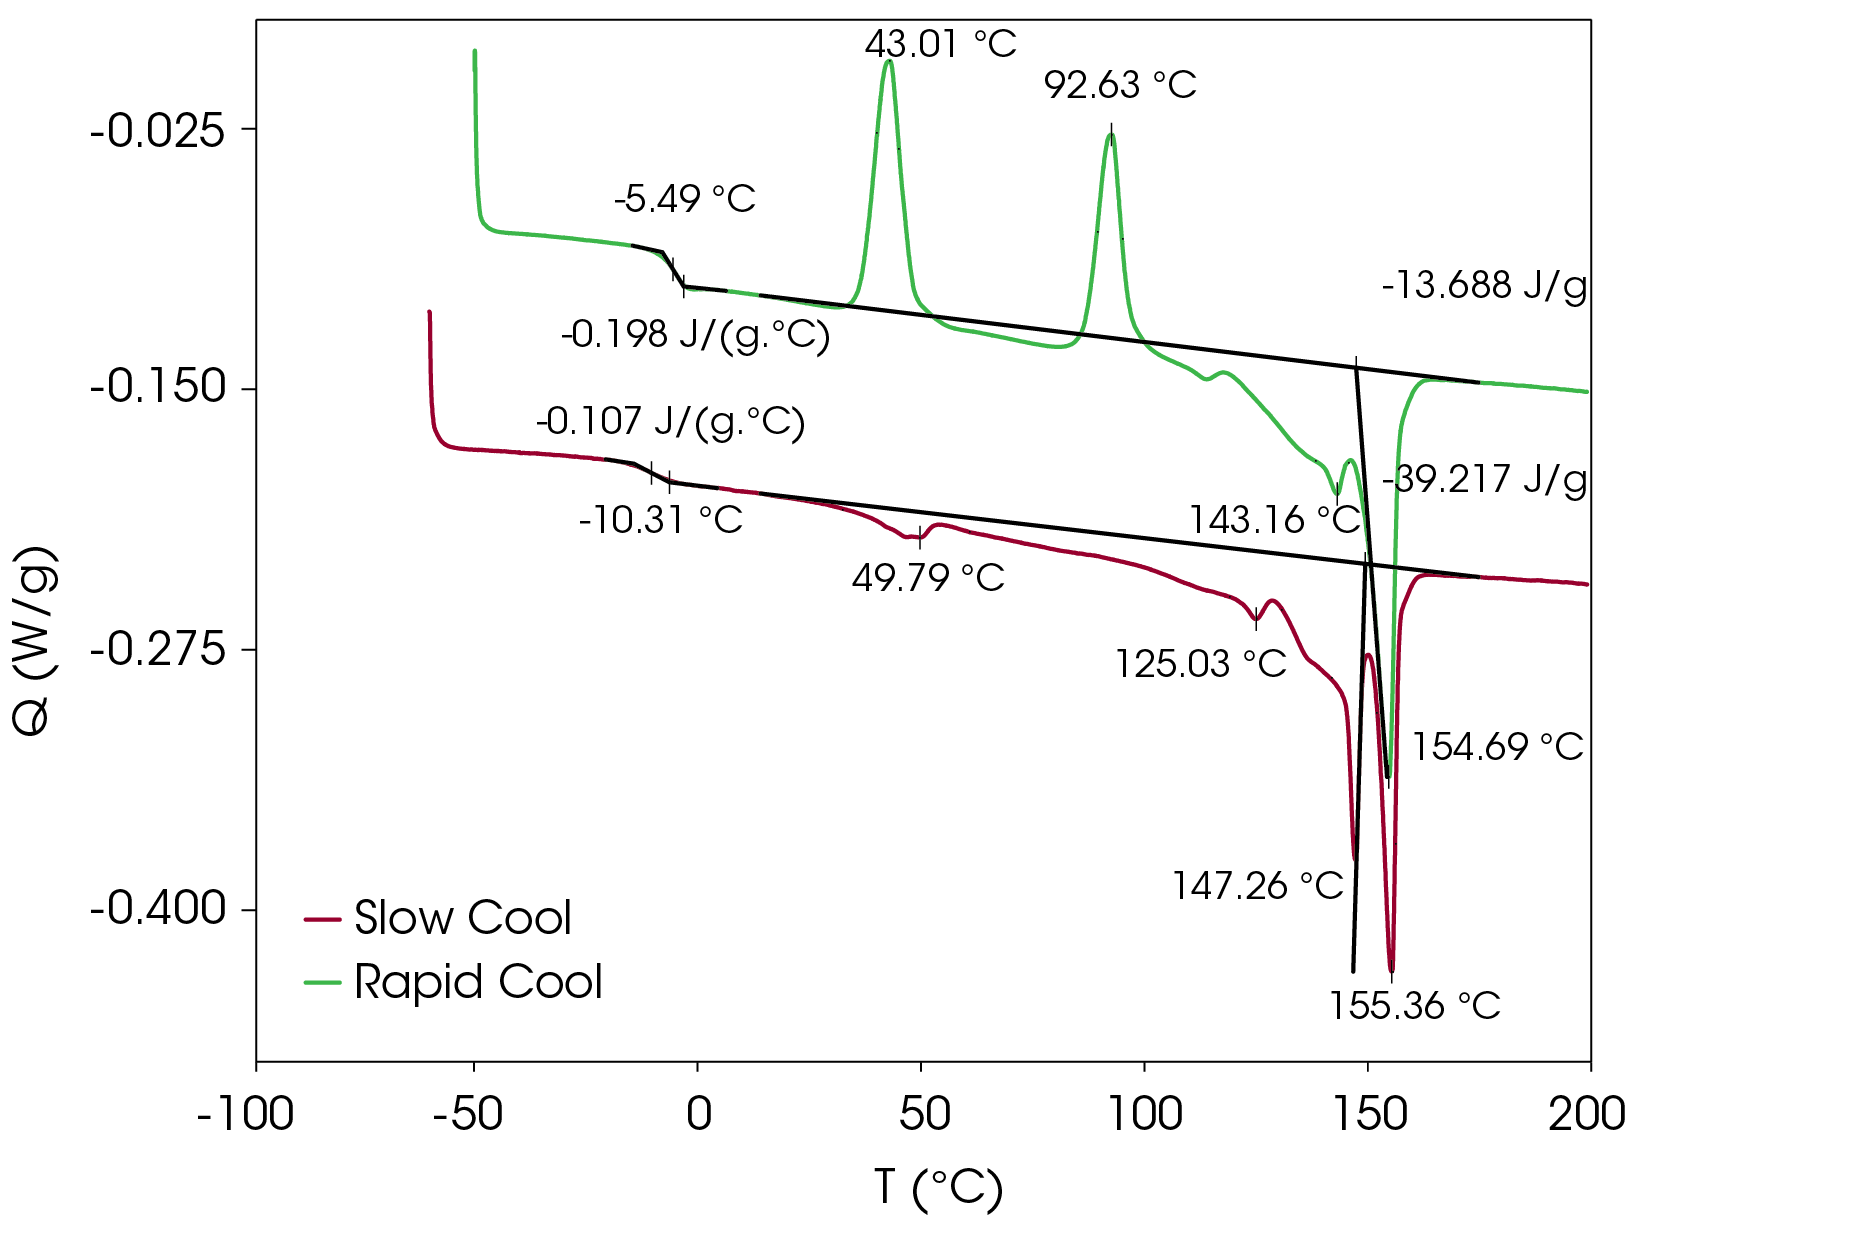
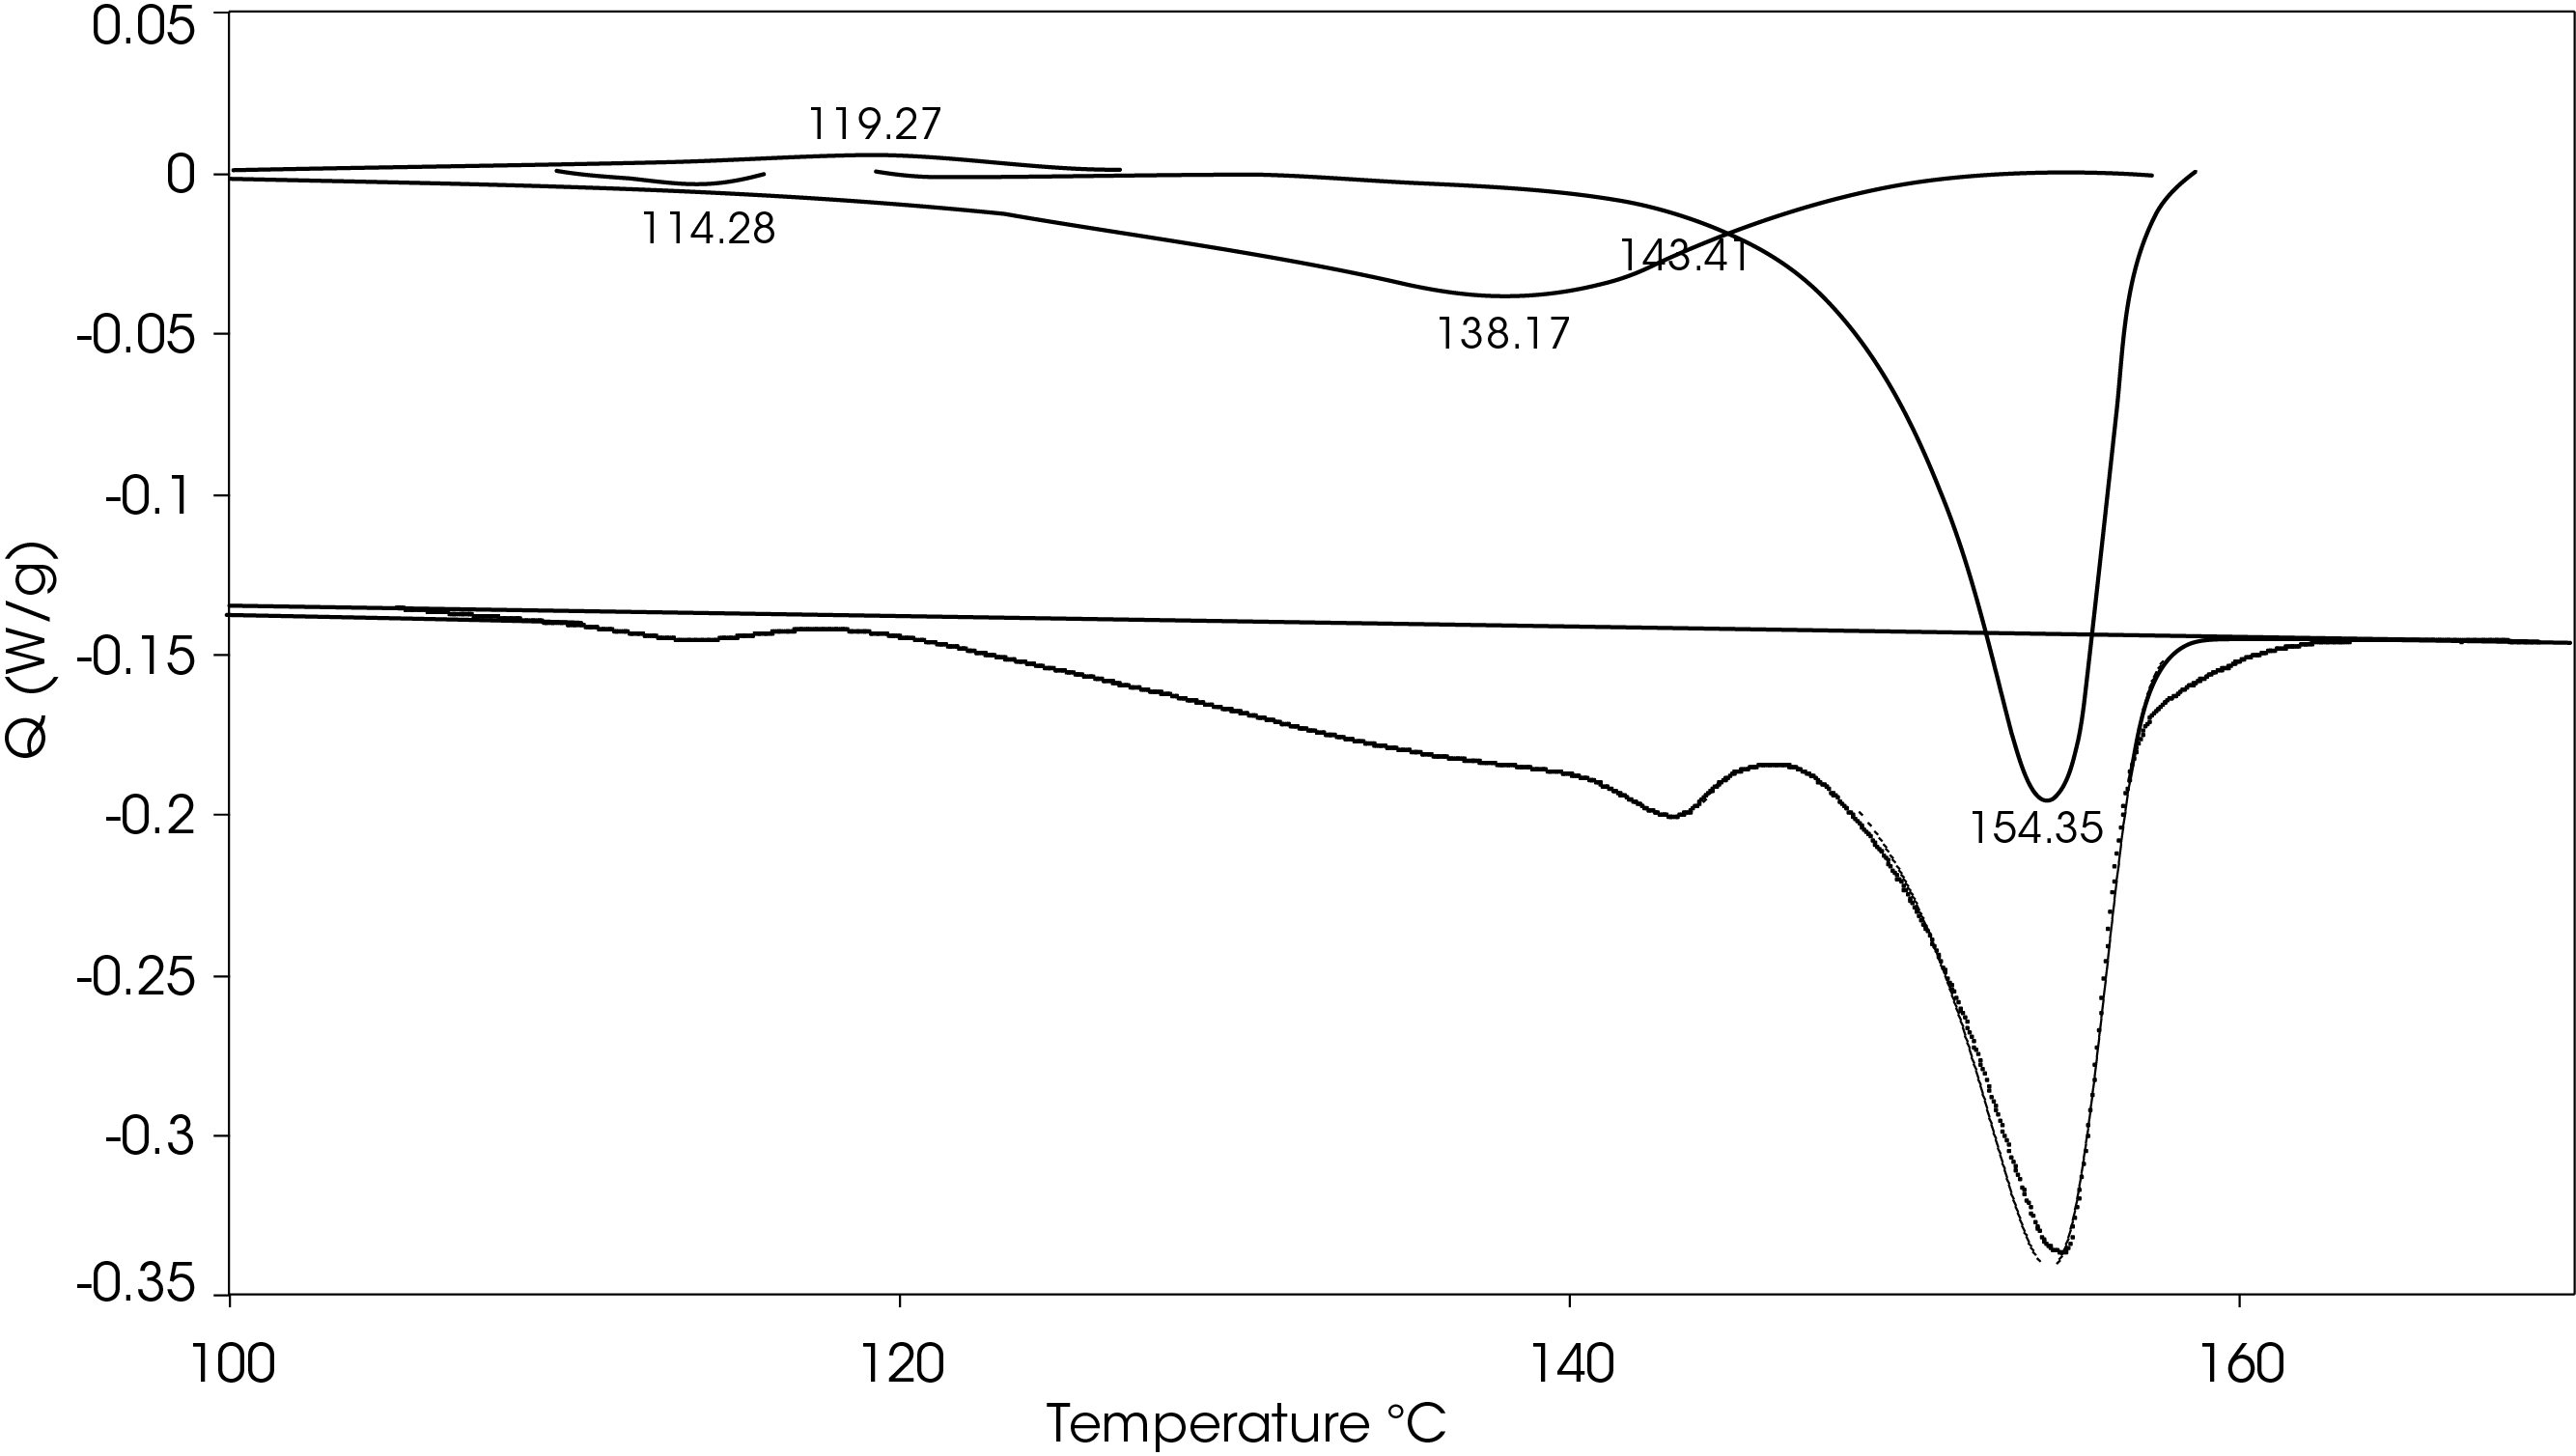
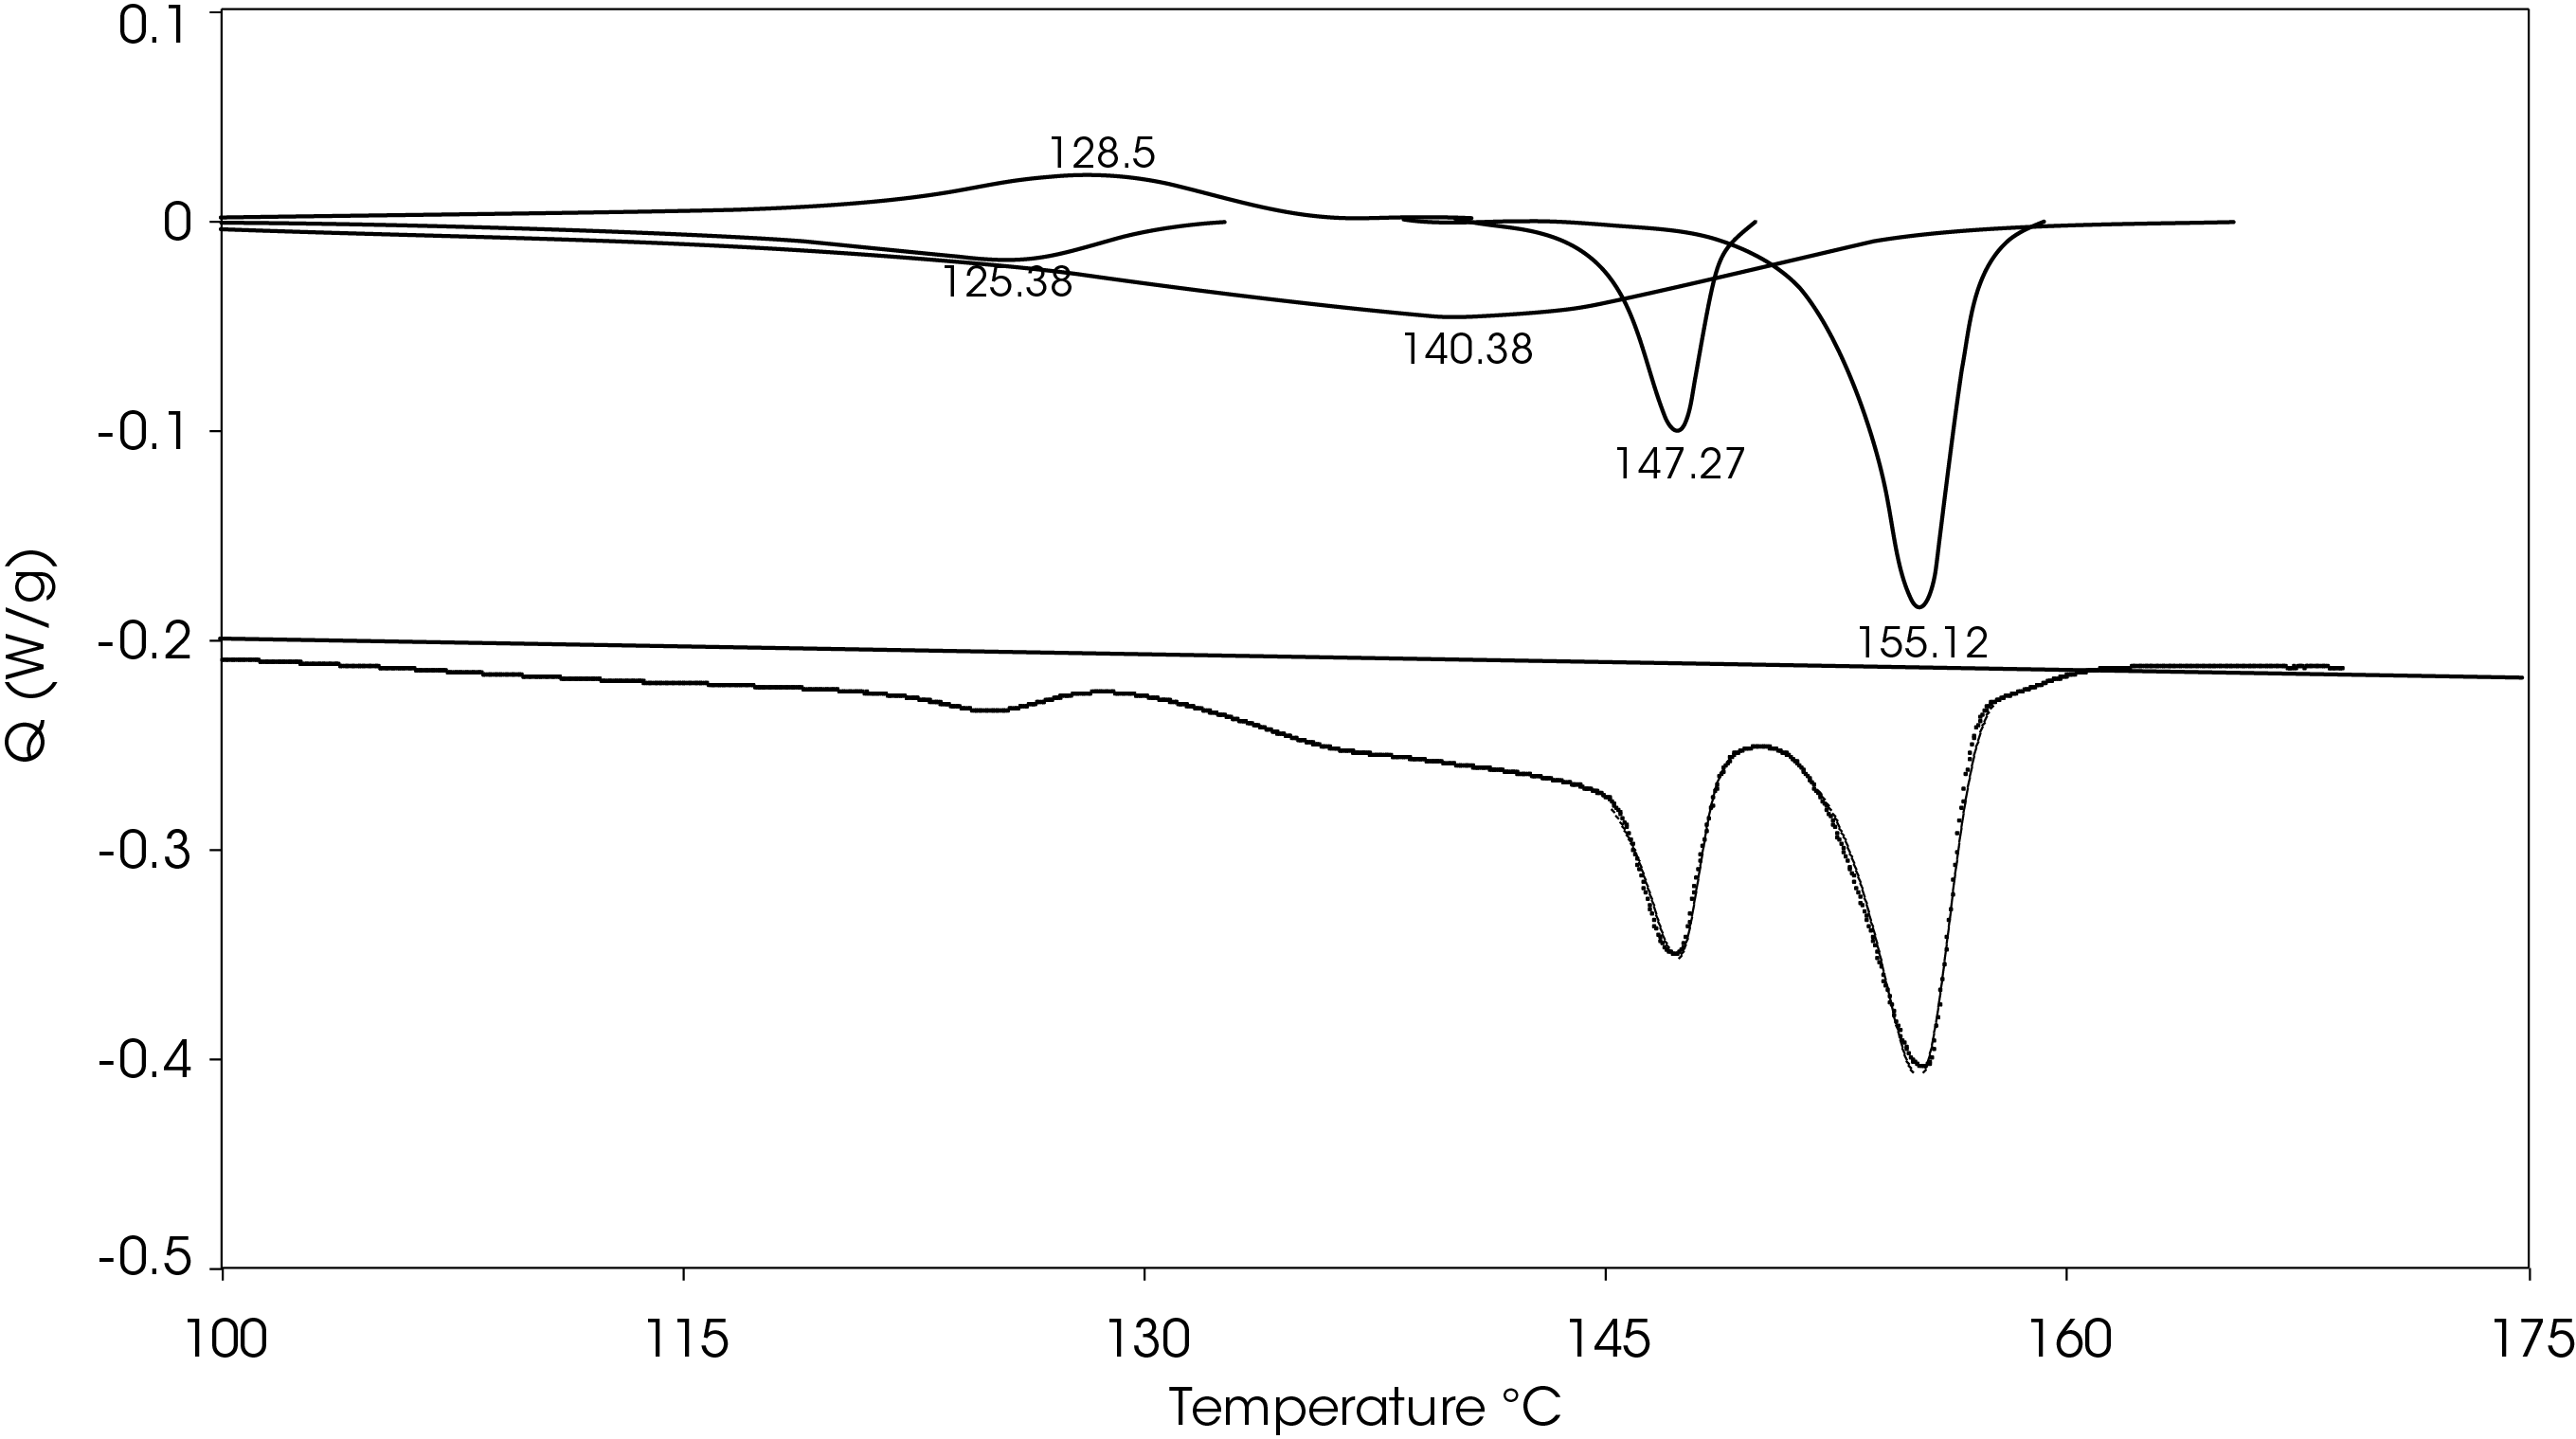
Figure 17 shows a comparison of the sample rapidly cooled from the melt (green) and slow cooled from the melt (red) and then heated at 5 °C/min. The main difference is that two cold crystallization transitions (43.01 and 92.63 °C) are present in the rapid cooled sample and no evidence of cold crystallization is apparent in the slow cooled sample. The predominant melting transitions are at ~145 °C and ~155 °C. The higher melting fraction is higher in the rapidly cooled sample, accounting for about 60% of the total heat of fusion contrasted with the higher melting fraction accounting for 30% of the total heat of fusion. This ratio changes as the heating rate is increased, as is observed in Figure 8. These approximations were made by curve fitting the endothermic part of the thermal transitions and are shown in Figure 18 for the rapid cooled and Figure 19 for the slow cooled PHB sample. The heat of fusion for the rapid cooled sample is -13.69 J/g and 39.22 J/g for the slow cooled sample (Figure 17). The heats of fusion at standard conditions are calculated by subtracting heats of cold crystallization from the heat of fusion.
MDSC Results of Slow Cool PHB Sample
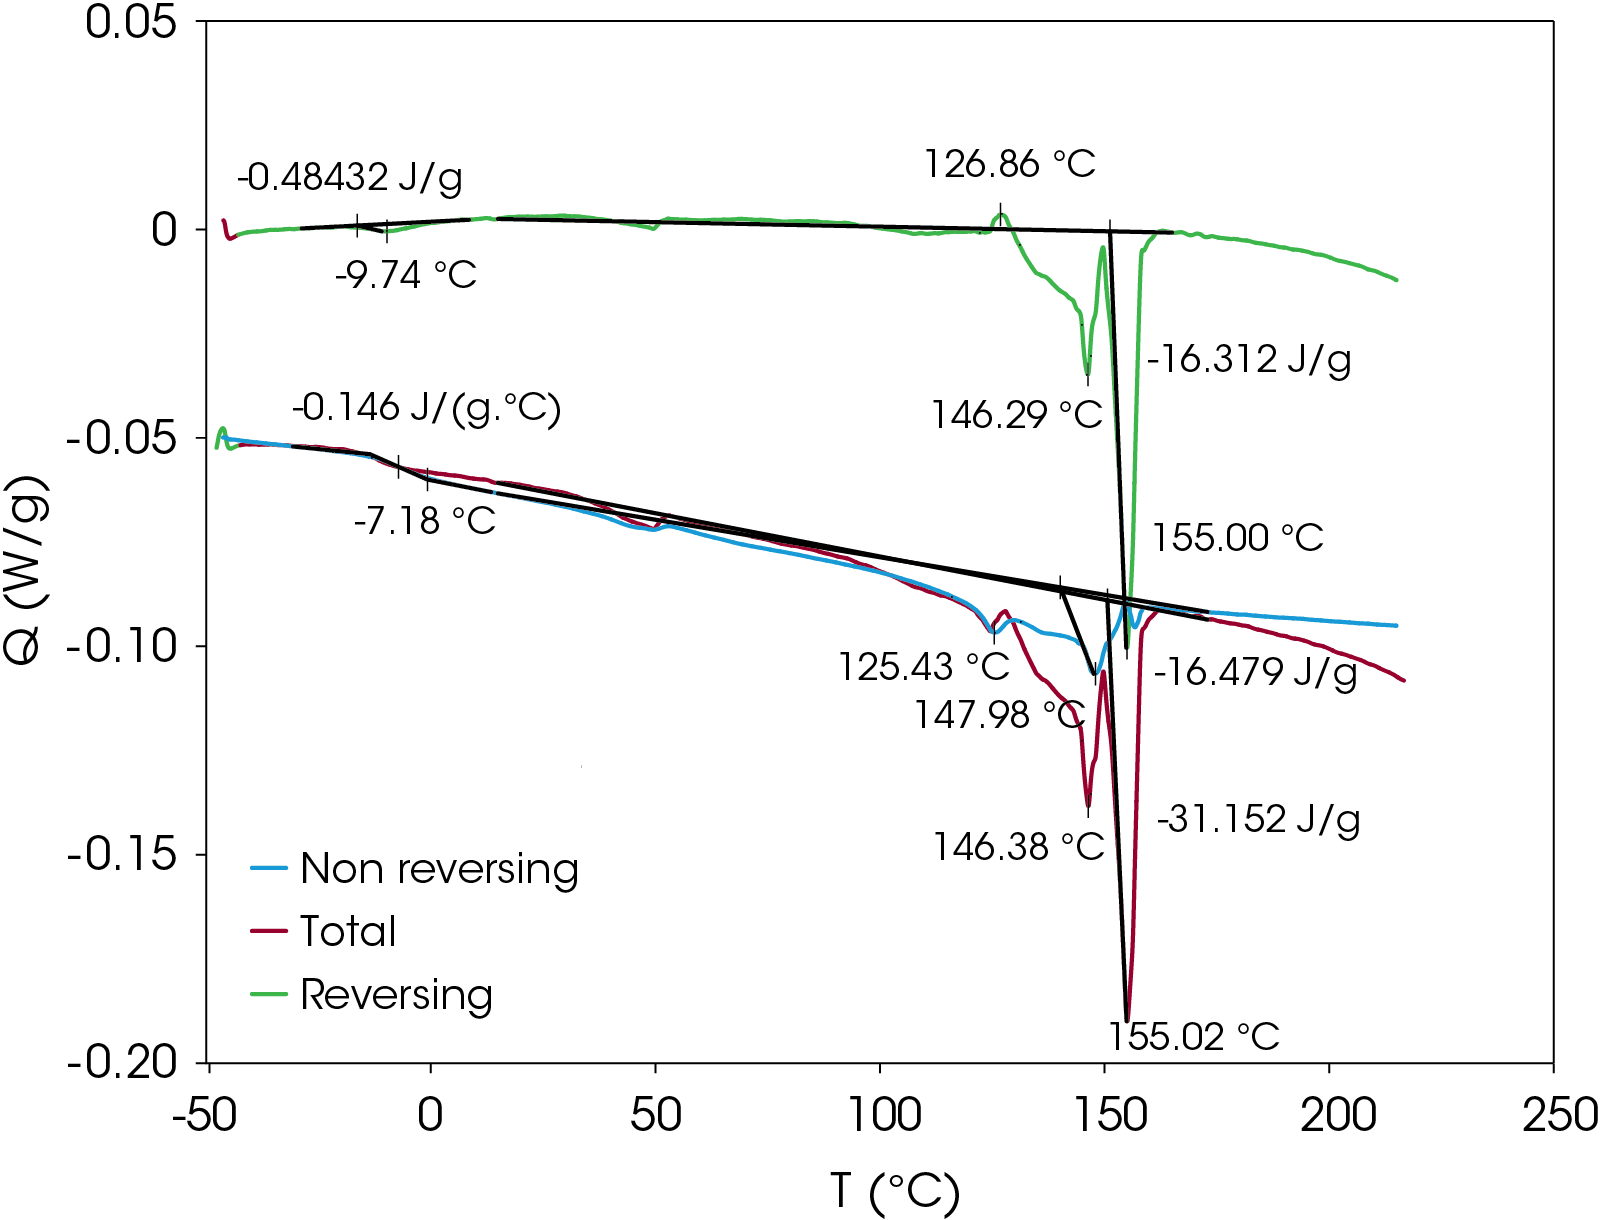
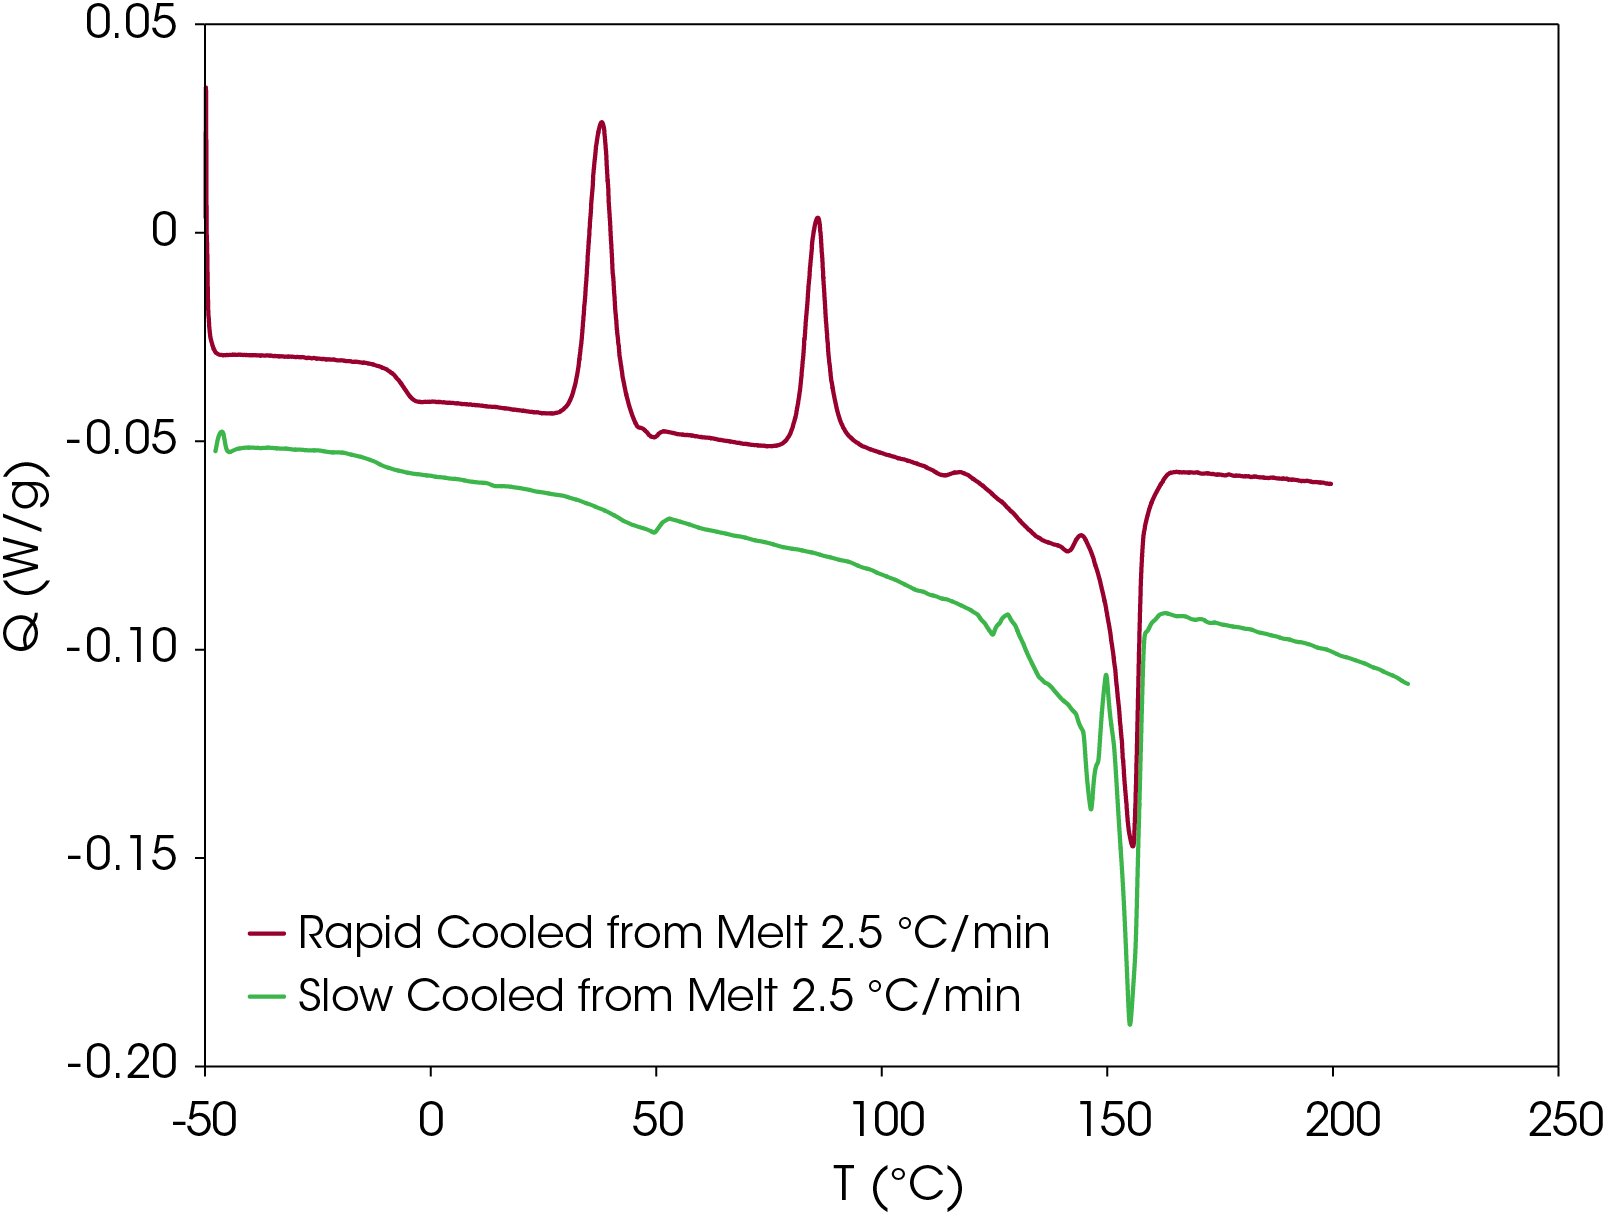
To verify that the two main melting transitions are not the result of superimposed melting and crystal perfection transitions, MDSC was also done on a second sample prepared using the slowcooling protocol. Results appear in Figure 20. The non-reversing heat flow (red) shows some crystal perfection at 126.9 °C, but prominent melting endotherms occur at 146.3 and 155.0 °C. This confirms that two stable crystal forms occur on slow cooling from the melt contrasted with rapid cooling from the melt where the lower melting species is not as prevalent when cold crystallized from the partially amorphous solid as shown in Figure 21. Both samples shown in Figure 21 are run at a heating rate of 2.5 °C/min.
The DSC provides valuable information about this sample and the potential effects that processing will have on the properties of this resin. Under typical processing conditions, this resin will be mainly amorphous. The low Tg and relatively low onset of cold crystallization (~36 °C) suggests that at storage or service temperatures, crystallization will occur followed by changes in properties. If properties of a crystalline polymer are needed, it may be necessary to add a nucleating agent to crystallize the resin under processing conditions or add an annealing step. If properties of an amorphous polymer are needed, it may be necessary to choose a use a co-monomer that may be less likely to crystallize under service or storage conditions.
Conclusions
As renewably sourced polymers are developed and are incorporated into the marketplace for the purpose of displacing petroleum-based polymers, the need for analytical characterization – particularly DSC – becomes vital. Thermal transitions are often correlated closely with properties such as modulus, toughness, thermal and oxidative stability, optical properties, etc. and DSC is the primary analysis tool for evaluating thermal properties.
This note demonstrates the workflow that may be used as part of the analytical characterization of a polymer utilizing standard and modulated DSC. In this sample of PHB with a wood filler, complex melting and crystallization transitions were found, including two sequential cold crystallizations when the sample was rapidly crystallized from the melt. The low glass transition and low onset of the first cold crystallization indicate that this resin will likely begin to crystallize at service or storage temperatures. MDSC experiments on the sample show enthalpic recovery due to enthalpic relaxation of the amorphous phase. Both the crystallization and tendency for enthalpic relaxation indicate that the properties of the resin are likely to change over time at service and storage temperatures. The MDSC experiment also shows that most of the melting occurs in the non-reversing heat flow, which is likely due to hydrogen bonding between the PHB and wood flour. On slow cooling from the melt, no cold crystallization is observed, implying that more stable crystal structures are formed. The effect of annealing, other fillers, nucleators, polymer blends, alternative co-monomers, and other additives would effectively be evaluated by DSC.
References
- R. Sehgal and R. Gupta, “Polyhydroxyalkanoate and its efficient production: an eco-friendly approach toward development,” Biotech, pp. 1-14, November 2020.
- Browne, J, “TA478: TGA, EGA, and MTGA Analysis of a Polyhydroxyalkanoate (PHA) with Wood Flour,” Waters TA Instruments, New Castle, 2023.
- Leonard Thomas, “Modulated DSC Paper #5 – Measurement of Glass Transitions and Enthalpic Recovery,” TA Instruments, New Castle.
- D. Panaitescu, “Thermal and mechanical properties of poly(3-hydroxybutyrate) reinforced with cellulose fibers from wood waste,” Industrial Crops and Products, no. 145, 2020.
- T. Volova, “The Physiochemical Properties of Polyhydroxyalkanoates with Different Chemical Structures,” Polymer Science, vol. 55, no. 7, pp. 427-437, 2013.
- V. Kumar, “Blends and Composites of Polyhydroxyalkanoates and their Applications,” European Polymer Journal, vol. 161, 2021.
- J. Tian, “Additive Manufacturing of wood flour / Polyhydroxyalkanoates (PHA) Fully Bio-based Composites based on Micro-Screw Extrusion System,” Materials and Design, vol. 199, no. 109418, 2021.
Acknowledgments
This note was written by James Browne, Senior Applications Scientist at TA Instruments.
For more information or to request a product quote, please visit www.tainstruments.com to locate your local sales office information.
Discovery, Modulated DSC, MDSC, TA Instruments, and TRIOS are a trademark of Waters Technologies Corporation. SURLYN is a trademark of Dow Inc.
Click here to download the printable version of this application note.

