Keywords: TGA, DSC, rheology, polyolefins, polyethylene, LLDPE, recycled polymers
RH138
Abstract
Polyolefins are among the most widely used polymers today. Recycling these materials and utilizing the recycled feedstock is increasingly important to reduce waste and environmental impact. To process recycled polymer feedstock, the primary component of the material must be identified. Differential scanning calorimetry and thermogravimetric analysis can be used to determine the type of polyolefin, as well as the percent of additives or contamination present. Rheology can be used to understand the performance and behavior of the recycled feedstock under various processing conditions, allowing manufacturers to optimize their workflow for efficiency and quality.
Introduction
Polyolefins are the most ubiquitous thermoplastics utilized in the world today. Polyethylene is a prominent polyolefin that accounts for approximately a third of the plastics market resin production annually [1]. Due to its extensive use, the environmental impacts of these petroleum-based polymers are being increasingly realized and scrutinized. Non-biodegradability and inclusion of toxic additives have shown negative impacts on marine life, human life, and contribute to the current climate crisis. [2] Significant effort is being put forth to find environmentally friendly alternatives to polyolefins, but this is a long-term endeavor. While these alternatives are being developed, short term solutions are needed. Highest among these explorative alternatives is the recycling of polyolefins to eliminate single-use production and dumping of plastic waste.
Recycling of polyolefins can lead to contamination and degradation of the polymers, which leads to the use of additives and fillers for property modification. This presents a challenge in re-processing the material, as the thermal and rheological properties of the specific recycled resins should be known to optimize processing. Thermal and rheological analysis can provide an understanding of the major polyolefin component, amount of additives and filler, and insights into the parameters needed for processing the recycled material.
In this note, a thermo-rheological analysis of three recycled polyethylene materials is presented. The results show how thermal analysis can be used to identify the major polyolefin component in the resin, as well as filler content. The rheology results can be used to identify properties of the recycled resins that can be applied to processing time scales. The challenges of analyzing recycled polymers with unknown filler content is also discussed.
Experimental
Three polyethylene resins made with recycled, low-density polyethylene were analyzed. It was not known if the samples were low-density polyethylene (LDPE) or linear low-density polyethylene (LLDPE). The filler content of the three resins was also unknown. The samples will be referred to as P1, P2, and P3. The color scheme used is in reference to the resin pellet colors, which are blue, yellow, and black, respectively. Reference LDPE and LLDPE samples from Sigma Aldrich were also measured.
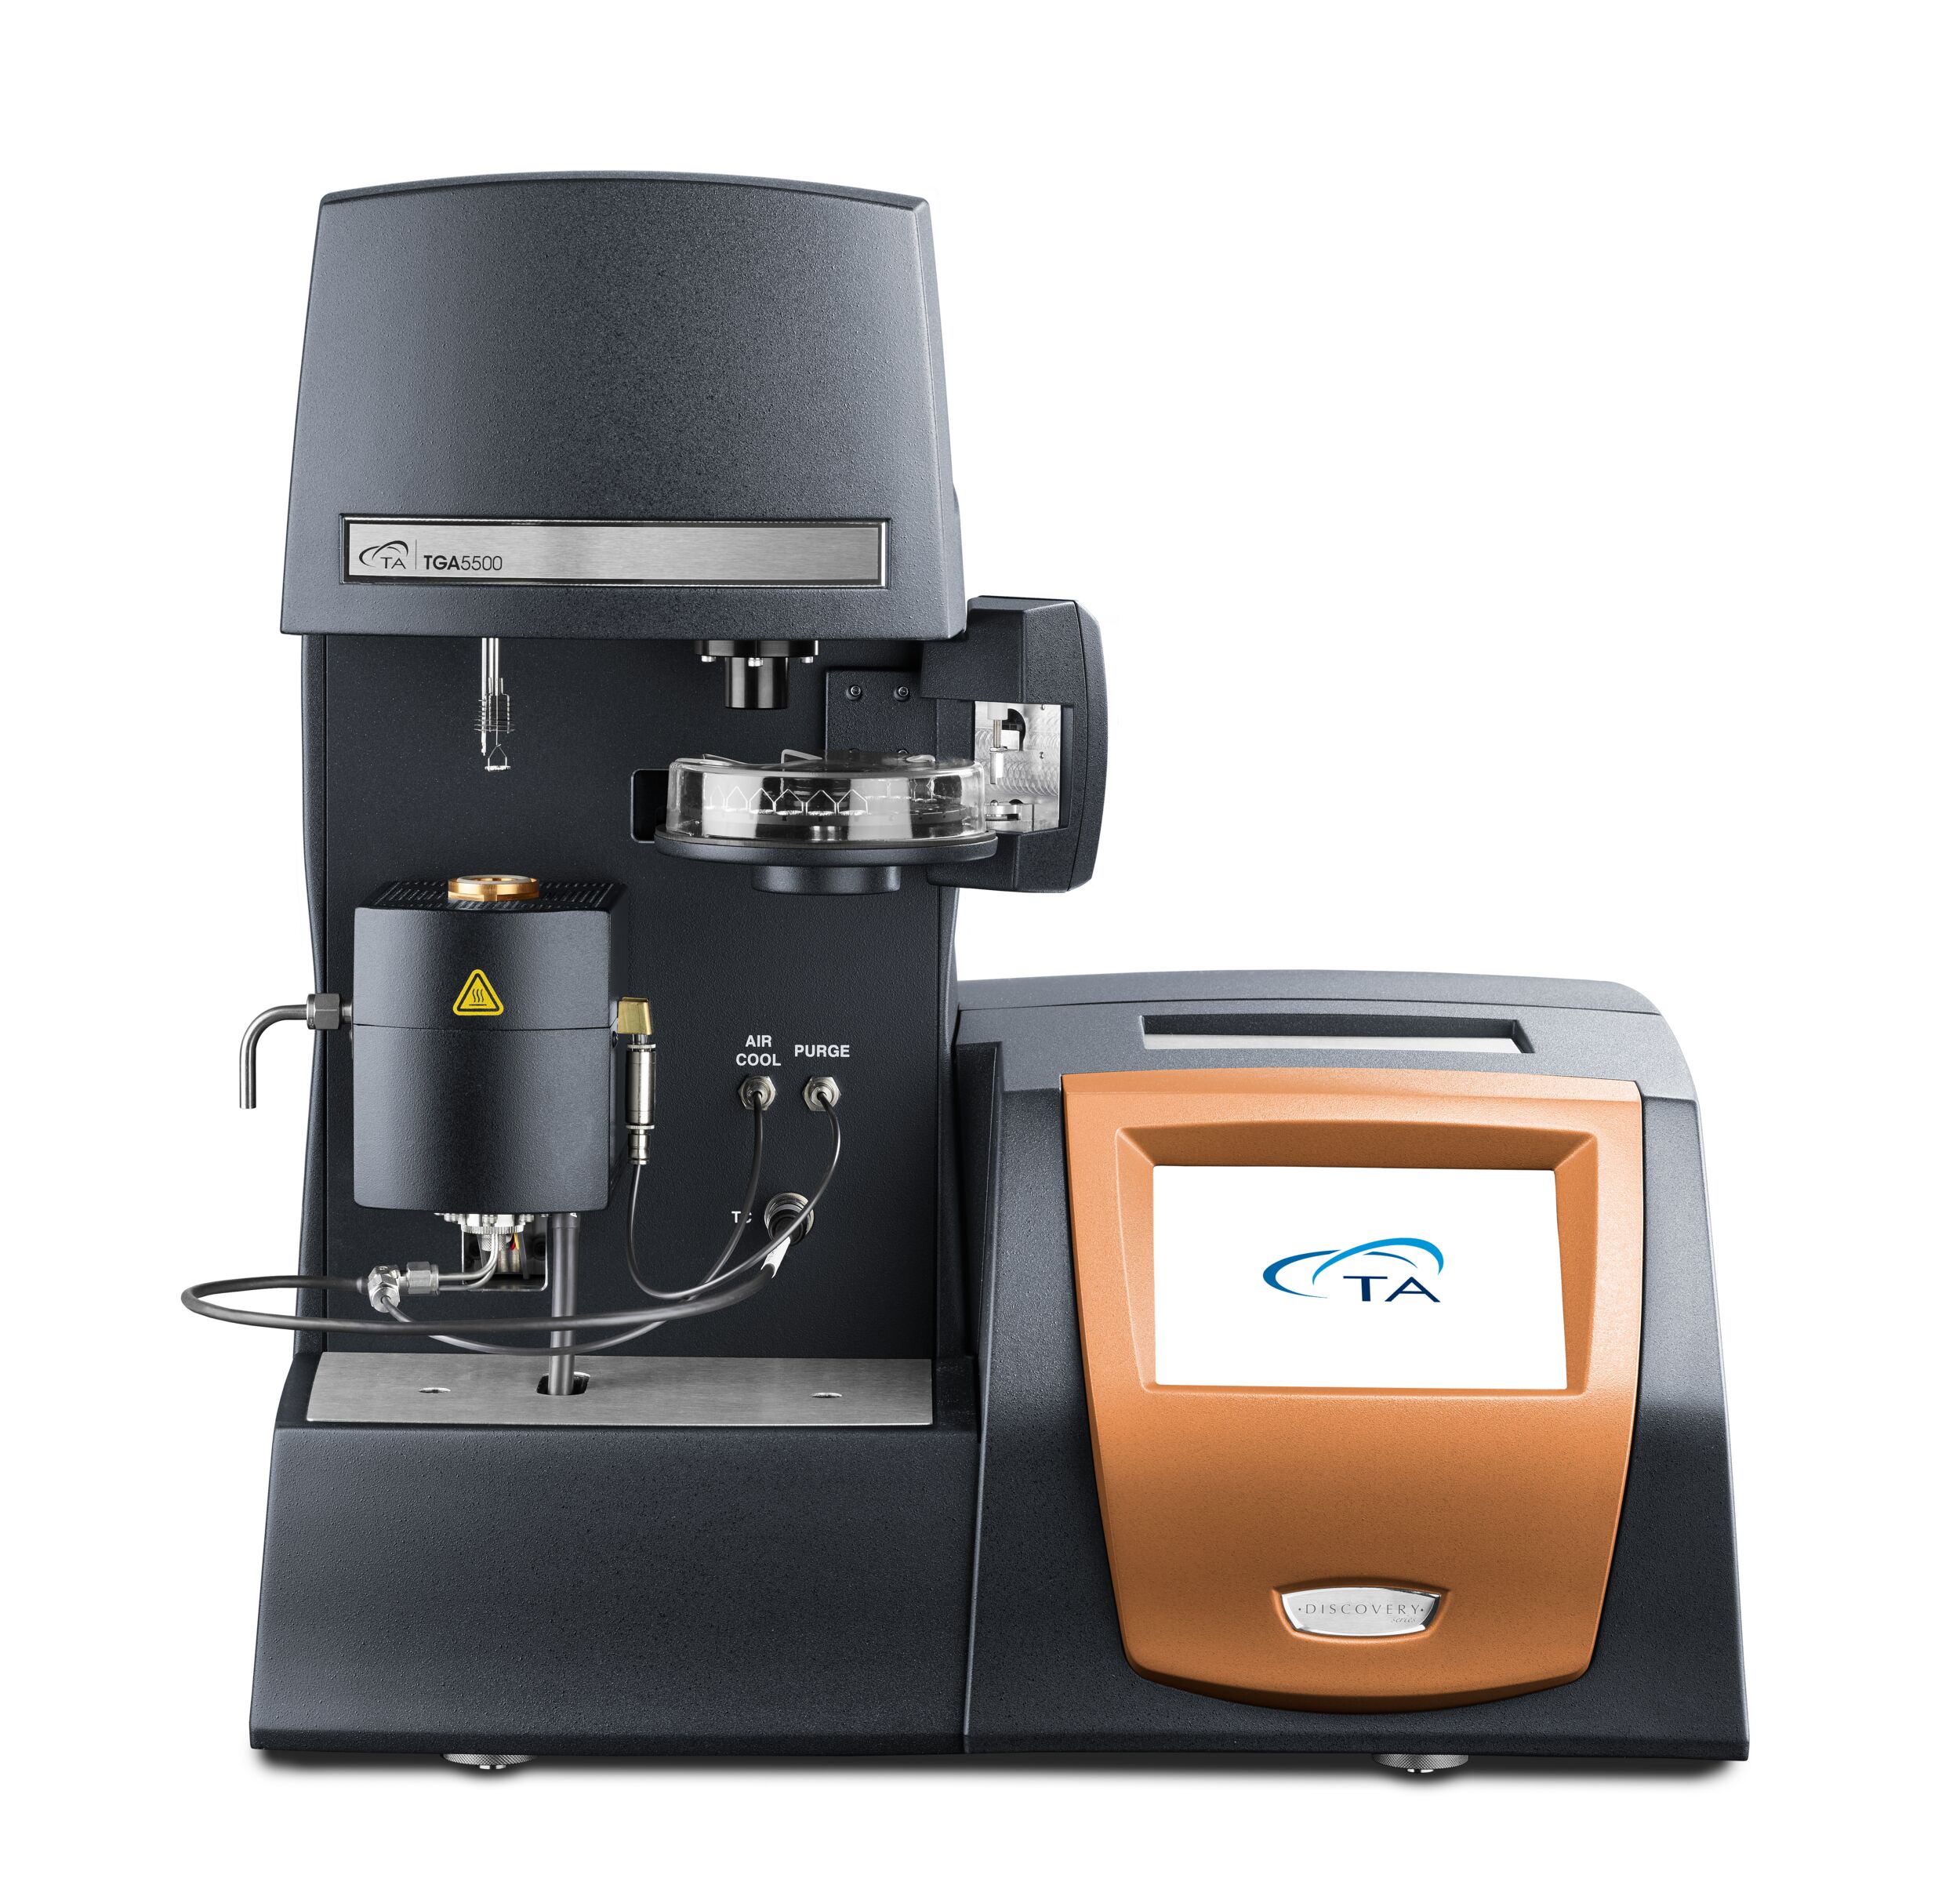
Thermal analysis was conducted using thermogravimetric analysis (TGA) and differential scanning calorimetry (DSC). A TA Instruments™ Discovery™ TGA5500 Thermogravimetric Analyzer, shown in Figure 1, was used to determine the decomposition temperature and filler content of the samples. TGA heating ramps were run at a 10 °C/min rate from room temperature to 1000 °C in a nitrogen atmosphere.
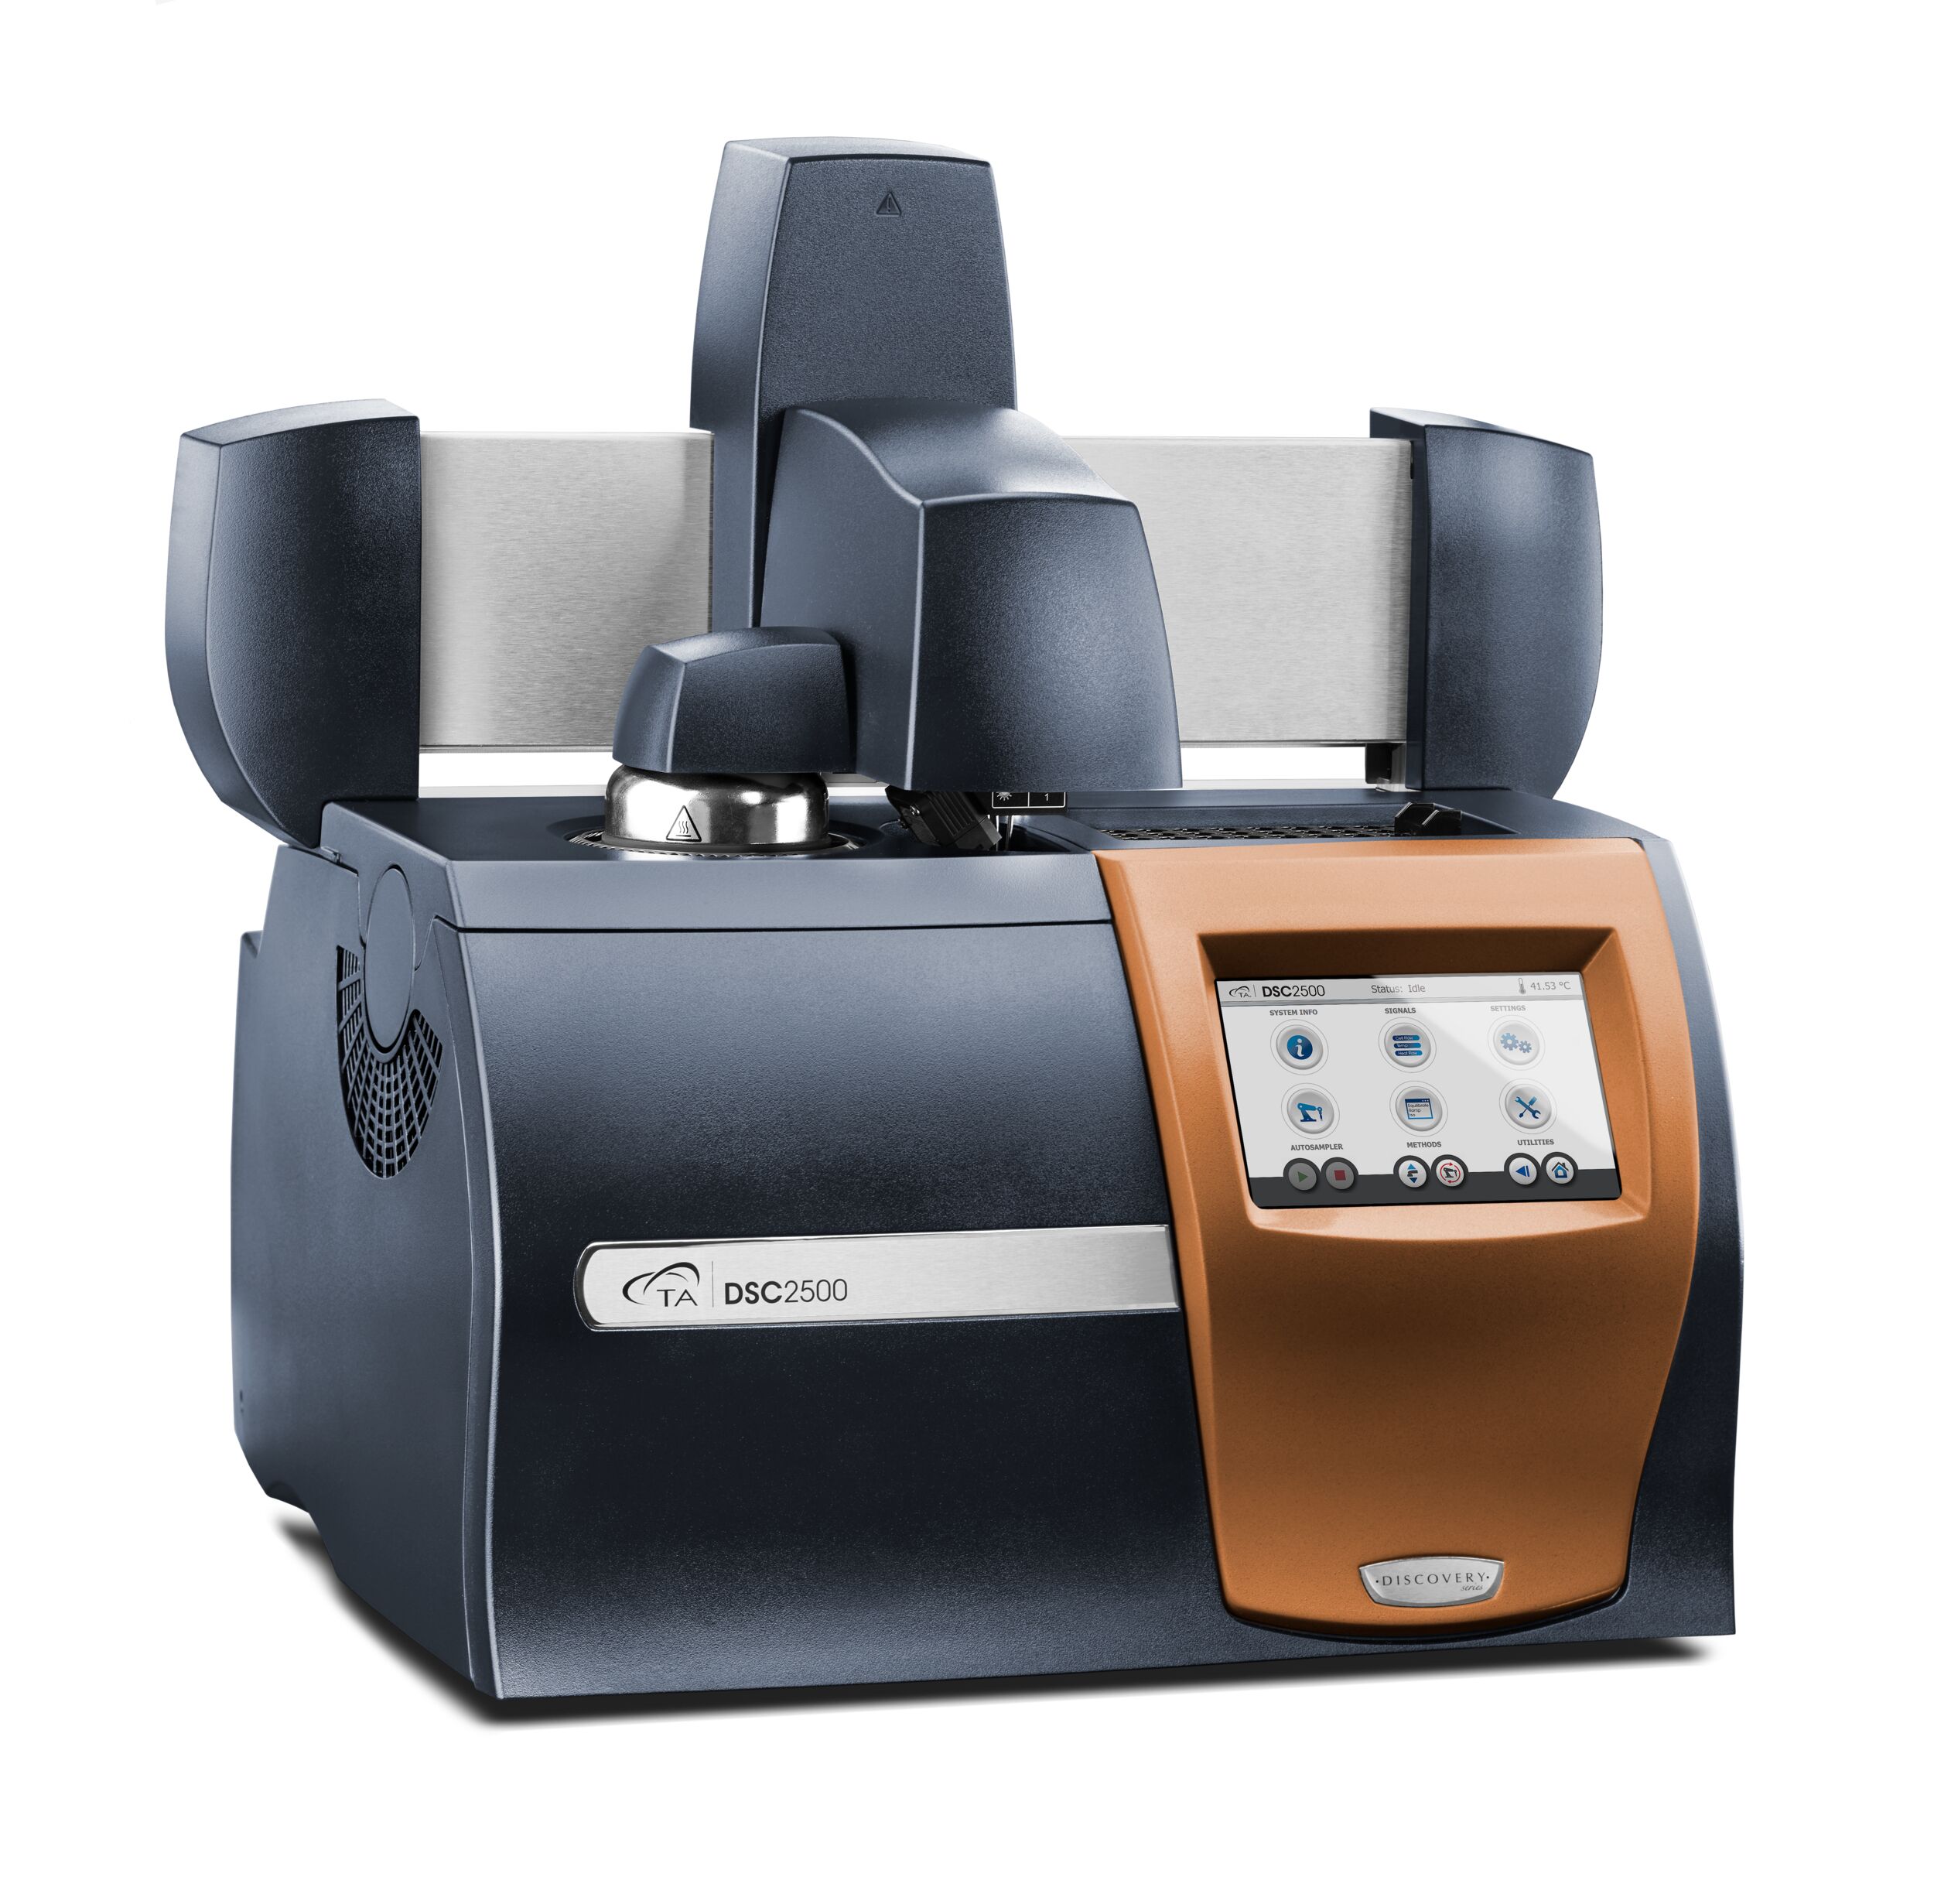
Heat/cool/heat DSC traces were run on a Discovery DSC2500 Differential Scanning Calorimeter (Figure 2) from 0-180 °C to identify the primary material component and respective melting temperatures.
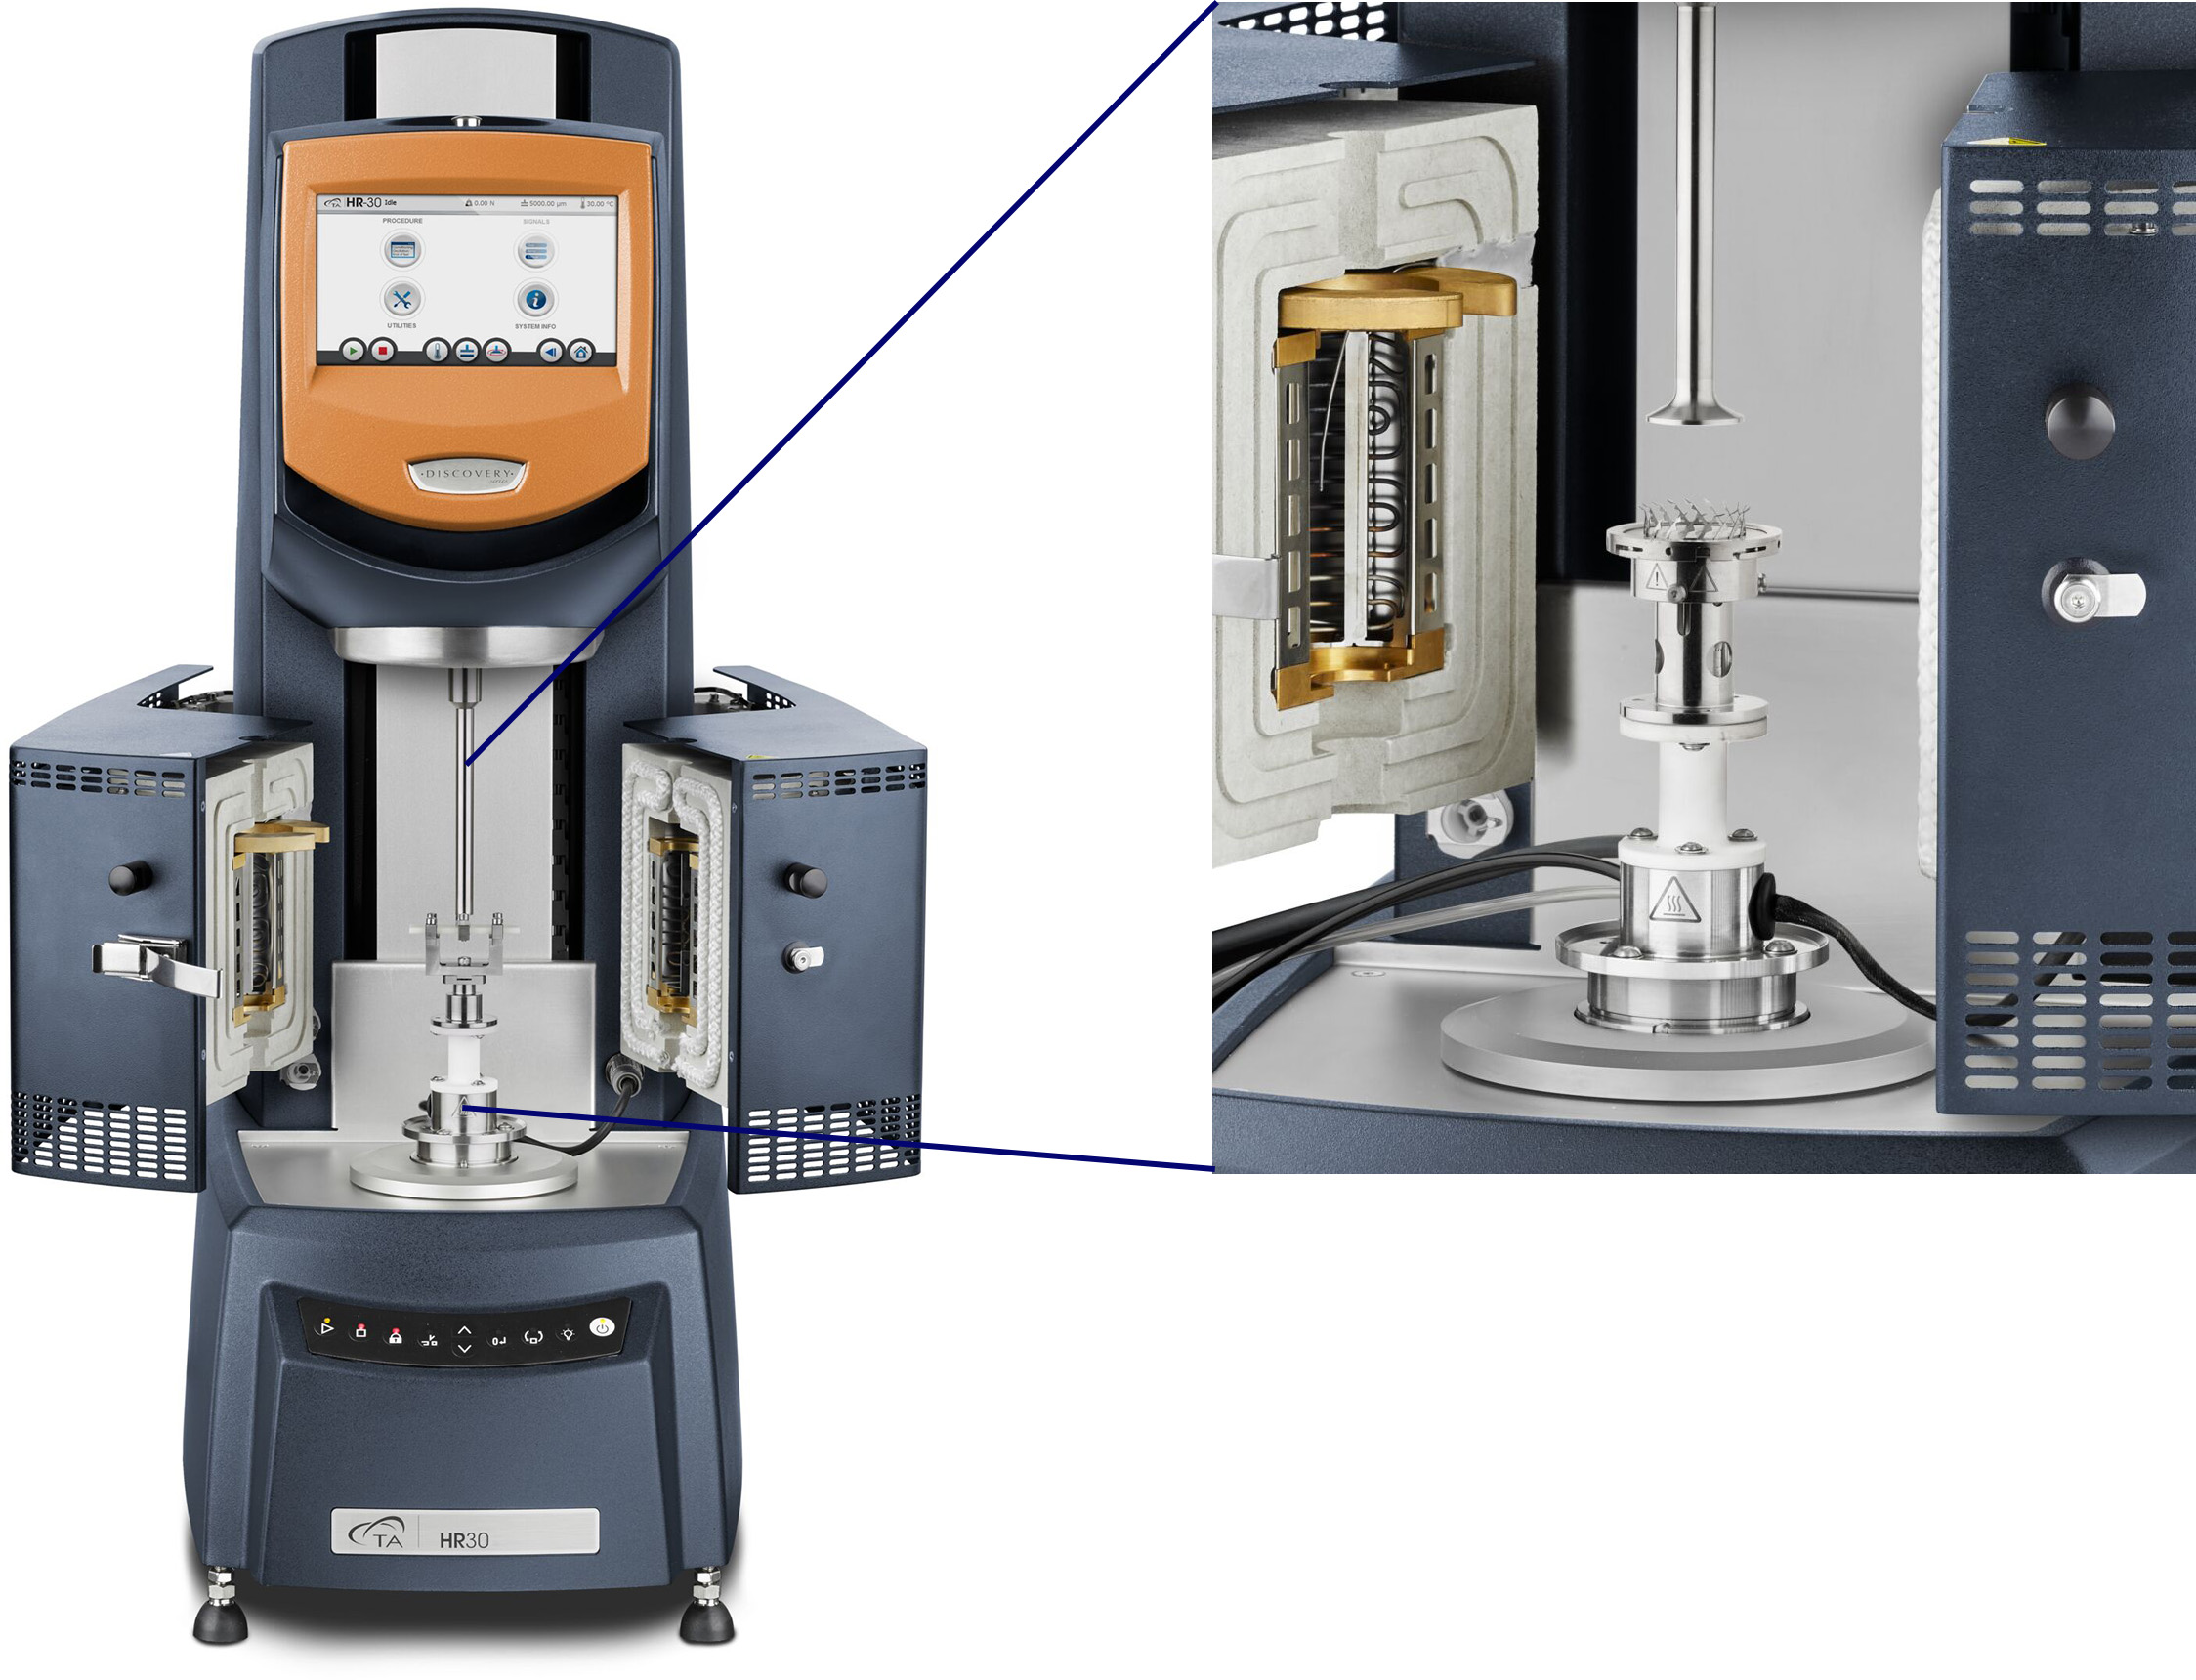
Melt rheology frequency sweeps were utilized to investigate the viscoelastic properties and processability of the materials. The experiments were run at 180 °C on a TA Instruments Discovery HR‑30 Rheometer with the Auto-Trim accessory, shown in Figure 3. The sweeps were run with a frequency range of 628-0.1 rad/s at 0.1 % strain with a 25 mm parallel plate geometry. Flow sweeps were run to examine the shear dependent viscosity of the melt and to demonstrate the challenge that polymer melts, especially filled, pose in flow testing. The flow sweeps were run from 0.01-100 s-1 using steady state sensing with the same geometry and auto-trim setup as the oscillatory testing.
Results and Discussion
TGA
The TGA results for all three polyolefin samples are shown in Figure 4.
The temperatures at which the onset of degradation occurs are 437.0 °C, 448.5 °C, and 468.5 °C for samples P3, P2, and P1, respectively. This degradation temperature gives an absolute upper limit on possible processing temperatures, showing that all the resins require below 400 °C for processing.
The residual content was taken as the weight loss after the polymer decomposition. The composition of this content may include contamination, or additives added to the feedstock. From the weight loss results after the first major decomposition event, P1 had the highest residual content, with roughly 11 wt%. P3 contains less than 4 wt% residual content, and P2 contains around 1 wt% residual content.

DSC
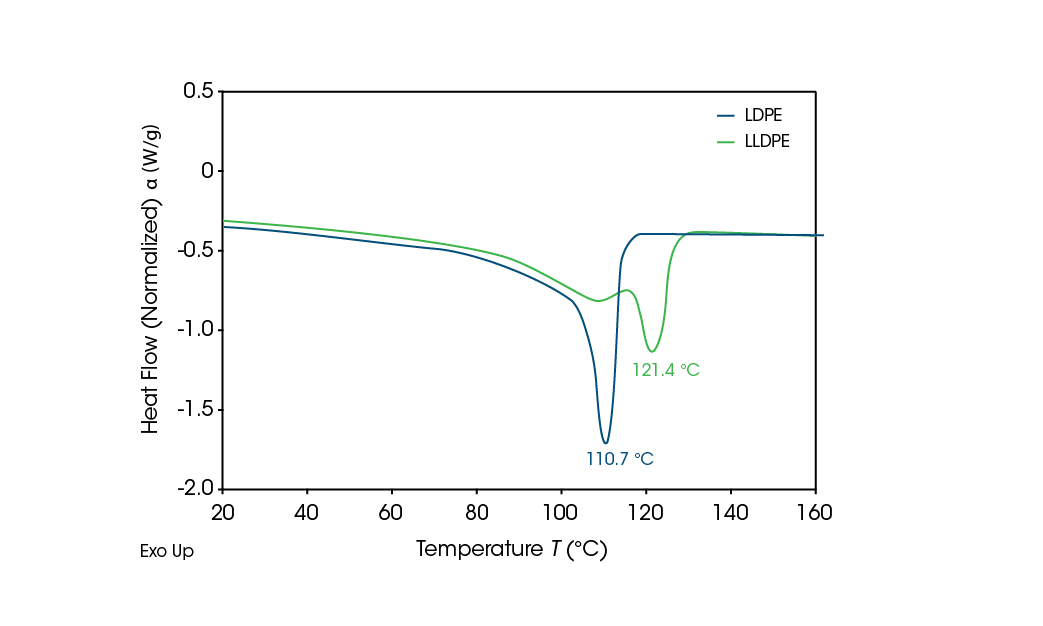
Reference LDPE and LLDPE second heating results are shown in Figure 5. The melting point of LDPE is 110.7 °C. LLDPE has a higher melting point of 121.4 °C and shows a higher main melting point peak with a characteristic shoulder near the LDPE main melting peak. [3]
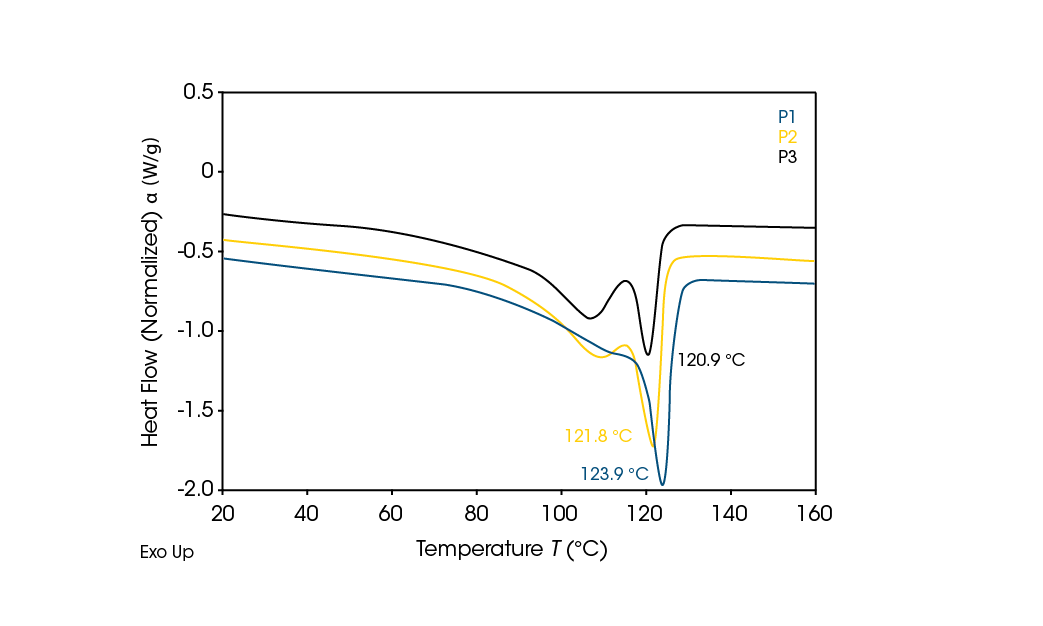
The unknown recycled polyethylene samples were then run using the same DSC parameters. The second heat curves in Figure 6 show that these samples are LLDPE. P1, which contains the highest amount of additives, has a slightly shifted curve and somewhat higher melting point than the less filled P2 and P3 curves.
No melting occurs in the range of LDPE, which has an upper limit of 114.2 °C. The main peaks for the samples fall in the range of 114.2 °C – 126.5 °C, the known melting limits of LLDPE. [4]
Rheology
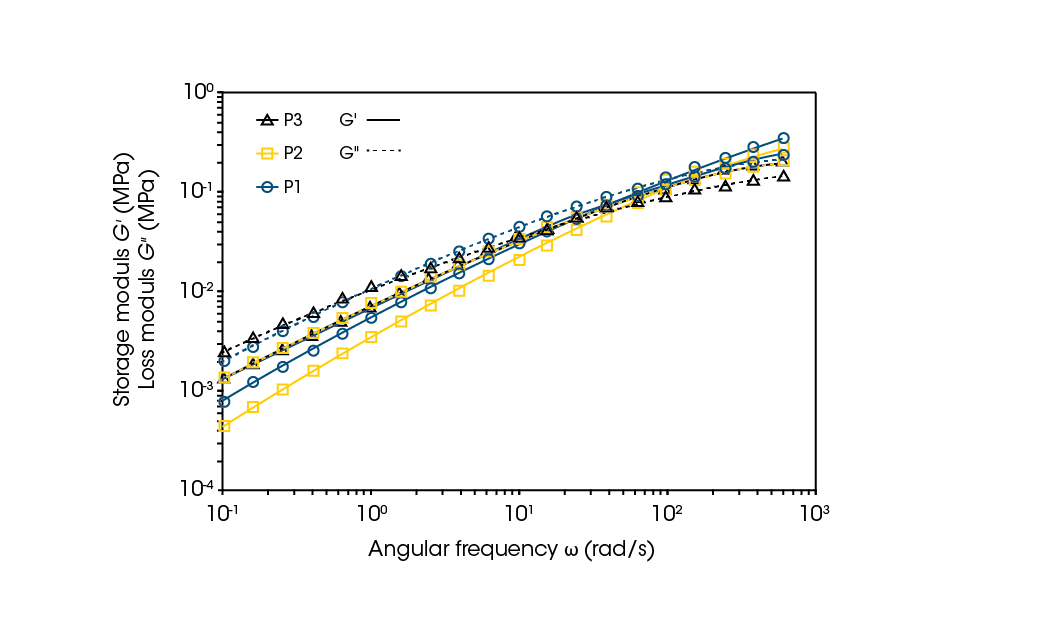
Frequency sweeps can be used to understand the relationship between fillers and rheological properties. The results can also help determine optimal processing conditions of the filled polymer melts. Knowing that the material is LLDPE guides the temperature for melt processes, but how the material will behave under different processing time scales, such as slower compression molding versus faster extrusion processes, can be seen through rheological testing of the material. Frequency sweep results of the samples are shown in Figure 7 and summarized in Table 1.
The angular frequency crossover gives insight into when the sample behavior changes from solid-like to liquid-like and its reciprocal can be considered the characteristic relaxation time of the polymer [5]. A higher crossover frequency can translate to easier flow at lower shear rates and a faster relaxation time indicates easier flowability. Table 1 provides the values for the various samples and the modulus crossover decreases from P2 to P1, to P3, respectively. A trend observed in filled melts is a shift in crossover frequency to lower values when filler is added. P2 with a very low filler content has a crossover frequency that is more than double the next P1 sample. This is an expected result.
From the TGA analysis, P3 would be expected to have the second highest crossover and P1 to have the lowest; however, P3 has the lowest crossover frequency. This is due to the filler content only being one of the factors in determining a filled polymer’s viscoelastic behavior. Other factors include the particles’ size and shape and extent of interactions between the particles. [6] As was observed from TGA, there were at least two different fillers for P1 while P3 shows evidence of only one. The size, shape, and identity of the unknown fillers contribute to how the polymer matrix is behaving upon deformation. Notably, rheology is sensitive enough to determine the differences and give guidance into the melt processability of the polymers.
Table 1. Summary of TGA, DSC, and rheology results.
| Sample | Decomposition onset temperature (°C) | % Filler | DSC peak melting temperature (°C) | Angular frequency crossover (rad/s) |
|---|---|---|---|---|
| P1 | 468.5 | 10.8 | 123.9 | 63.8 |
| P2 | 448.5 | 0.9 | 121.8 | 129.2 |
| P3 | 437 | 4.3 | 120.9 | 23.2 |
Inapplicability of Cox-Merz Relationship
When performing rheology on polymer melts, a very popular analysis is the Cox-Merz transformation of the complex viscosity versus frequency into viscosity versus shear rate. [7] This is performed because of the importance of understanding the flow behavior of the melt under specific shear rates that are related to certain processing conditions.
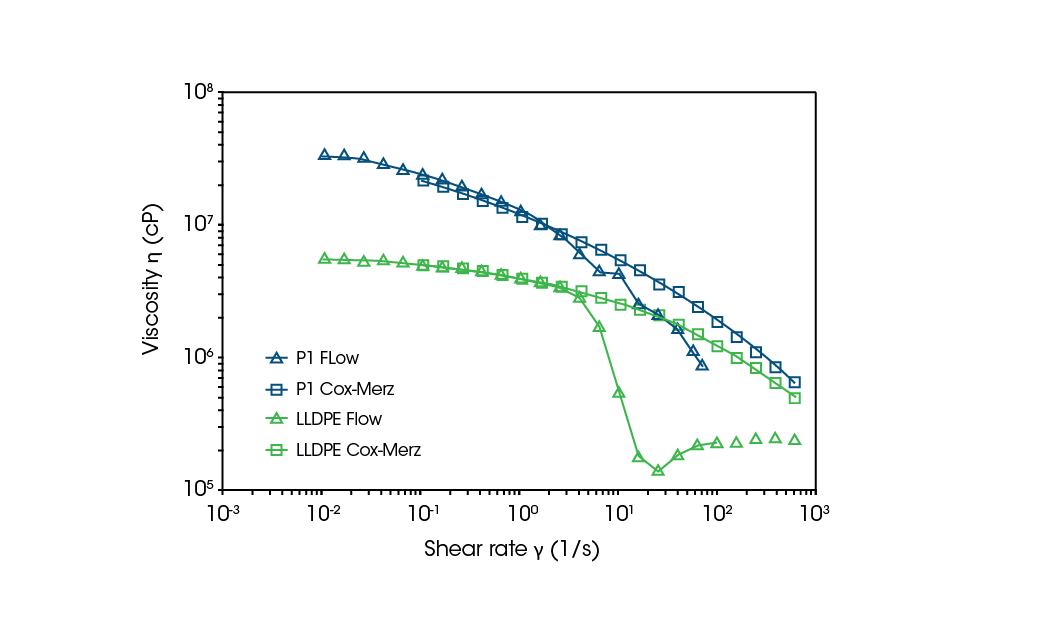
Converting frequency data to shear is performed because of the difficulty in obtaining complete flow curves on melts due to phenomena such as edge fracture occurring at high shear rates. This can be observed in the control LLDPE flow curve in Figure 8 where a significant drop in viscosity is found when approaching higher shear rates. The Cox-Merz relationship allows for a more complete flow curve and, subsequently, model fitting can be used to identify the zero-shero viscosity (η0) or Newtonian plateau at low shear. The η0 can then be related to the Molecular Weight (MW) of the polymer by the Mark-Houink equation. [8]
Despite the popularity of the Cox-Merz transformation, it does have limitations on validity regarding specific systems. It is known to fail for filled polymer systems such as the samples used in this work. The applicability of the transformation can be validated by plotting the transformation from the oscillation test with the flow curve from the shear test. Figure 8 compares a flow curve from shear testing and a Cox-Merz transformed frequency sweep curve for sample P1 and the control LLDPE. At low shear, prior to fracture, the data should overlap. The two curves should appear as one with only the edge fracture portion of the shear test deviating. This is observed for the control LLDPE, but the P1 sample does not overlap completely. The Cox-Merz transformation underestimates the viscosity compared to the flow data, as well as the pronounced shear-thinning in the low shear region that is expected for a filled polymer. This identifies how the Cox-Merz rule suffers for these systems. Using the Cox-Merz transformation will lead to incorrect viscosity calculations, which could affect the processing of the polymer, causing defects and equipment downtime. While it is not a complete overlap for P1 the near overlap does give qualitative data on high shear before. However, at higher additive content, this qualitative correlation can be lost.
Conclusions
Processing materials made of recycled polymers can prove challenging due to possible contamination and degradation that may occur. It is important to be able to identify the specific recycled materials and how they will behave under various processing conditions. Thermal analysis through TGA and DSC enables identification of the main polymer component of recycled feedstock, as well as the amount of additives or contaminants present. Rheological testing can be used to understand the melt processing behavior. In this note, recycled polyolefin samples of unknown material were identified as LLDPE. The amount of additives was determined by TGA and the impact of the additive amount was seen in the increased melting point of the material. The frequency sweeps provide information on how the filler content influences the melt behavior of the resins. The results also demonstrate how the presence of fillers can invalidate common rheological analysis performed on neat polymer melts. Using transformations like Cox-Merz can result in modeling of data that yields incorrect processing parameters for the filled polymer melts. By combining thermal and rheological analysis on recycled materials, the resin’s primary component can be identified, the filler content quantified, and behavior during processing can be understood.
References
- D. Sauter, M. Taoufik and C. Boisson, “Polyolefins, a Success Story,” Polymers, vol. 9, no. 6, p. 185, 2017.
- D. El-Sherif, M. Eloffy, A. Elmesery, M. Abouzid, M. Gad, H. El-Seedi, M. Brinkman, K. Wang and Y. Naggar, “Environmental risk, toxicity, and biodegradation of polyethylene: a review,” Environmental Science and Pollution Research, vol. 29, pp. 81166-81182, 2022.
- A. Prasad, “A quantitative analysis of low density polyethylene and linear low density polyethylene blends by differential scanning calorimetery and fourier transform infrared spectroscopy methods,” Polymer Engineering and Science, vol. 38, no. 10, pp. 1716-1728, 2004.
- J. Lynch, R. Corniuk, K. Brignac, Jung M.R., K. Sellona, J. Marchiani and W. Weatherford, “Differential scanning calorimetry (DSC): An important tool for polymer identification and characterization of plastic marine debris,” Environmental Pollution, vol. 346, p. 123607, 2024.
- A. Franck, “Viscoelasticity and dynamic mechanical testing,” TA Instruments, Germany.
- A. Frank, “Introduction to Polymer Melt Rheology and Its Application in Polymer Processing,” TA Instruments, New Castle, DE, p. RH135.
- “The Principles and Applications of the Cox-Merz Rule,” TA Instruments, New Castle, DE.
- T. Chen and J. Saelens, “Using Rheology and Thermal Analysis to Help Optimize Processing Conditions of Recycled PET,” TA Instruments, p. RH122.
- “Rheology Software Models (Flow),” TA Instruments, New Castle, DE.
Acknowledgement
For more information or to request a product quote, please visit www.tainstruments.com to locate your local sales office information.
This paper was written by Mark Staub, PhD.
TA Instruments and Discovery are registered trademarks of Waters Technologies Corporation.
Click here to download the printable version of this application note.

