Keywords: Viscosity, intrinsic viscosity, polymer solutions, flow models
RH143
Abstract
To optimize the processing of polymer solutions, it is necessary to understand the flow properties of the solution, such as the intrinsic viscosity. Viscosity measurements can quantify the influence of altering concentration or additive inclusion and be used in quality control and formulation optimization. A stress-controlled rotational rheometer was used to explore the rheological properties of a series of polyethylene-oxide (PEO) (600 kDa) aqueous solutions with different concentrations. Model fitting was utilized to quantify the concentration-dependent rheological properties along with extracting important parameters such as the zero-shear viscosity [η0] and a critical shear rate for onset shearing thinning. The former parameter was then used with a multi-concentration procedure and two regression models (Kraemer and Huggins) to determine the intrinsic viscosity [η] of this specific system. The merits and limitations of using a rotational rheometer for this type of analysis are discussed in this note.
Introduction
Polymer solutions are utilized across many industries such as pharmaceuticals, food, cosmetics, and batteries [1]. Understanding the viscosity of polymer solutions is critical as it influences material processing, product performance, and is utilized in quality control [2]. Without a thorough understanding of the solution’s viscosity, it becomes difficult to optimize materials processing involving polymer solutions.
For complex fluids such as polymer solutions, there are several factors that contribute to viscosity. These include the polymer molecular weight, concentration, and polymer/solvent interactions. Several other “viscosities” have been introduced to better define the molecular and bulk properties of polymer solutions. These values are termed “viscosities” but are instead parameters based on viscosity, using ratios and variations of the true measured viscosity. These include the relative viscosity, reduced viscosity, and inherent viscosity, which are defined in Table 1. Of these parameters, the most important is the intrinsic viscosity [η], which is derived from the previous mentioned viscosities. In its simplest definition, intrinsic viscosity is a solute’s contribution to the viscosity of a solution. For polymer solutions, [η] is the truest measure of a polymer’s influence on the viscosity of a given polymer/solvent system. Once determined, [η] can be used for determination of polymer molecular structure, to reflect important physical properties, and be used in quality control and process optimization [3]. As a result, intrinsic viscosity is an important parameter in several areas such as polymer chemistry, protein research, and materials properties optimization. Typically, intrinsic viscosity is determined using a capillary viscometer, also known
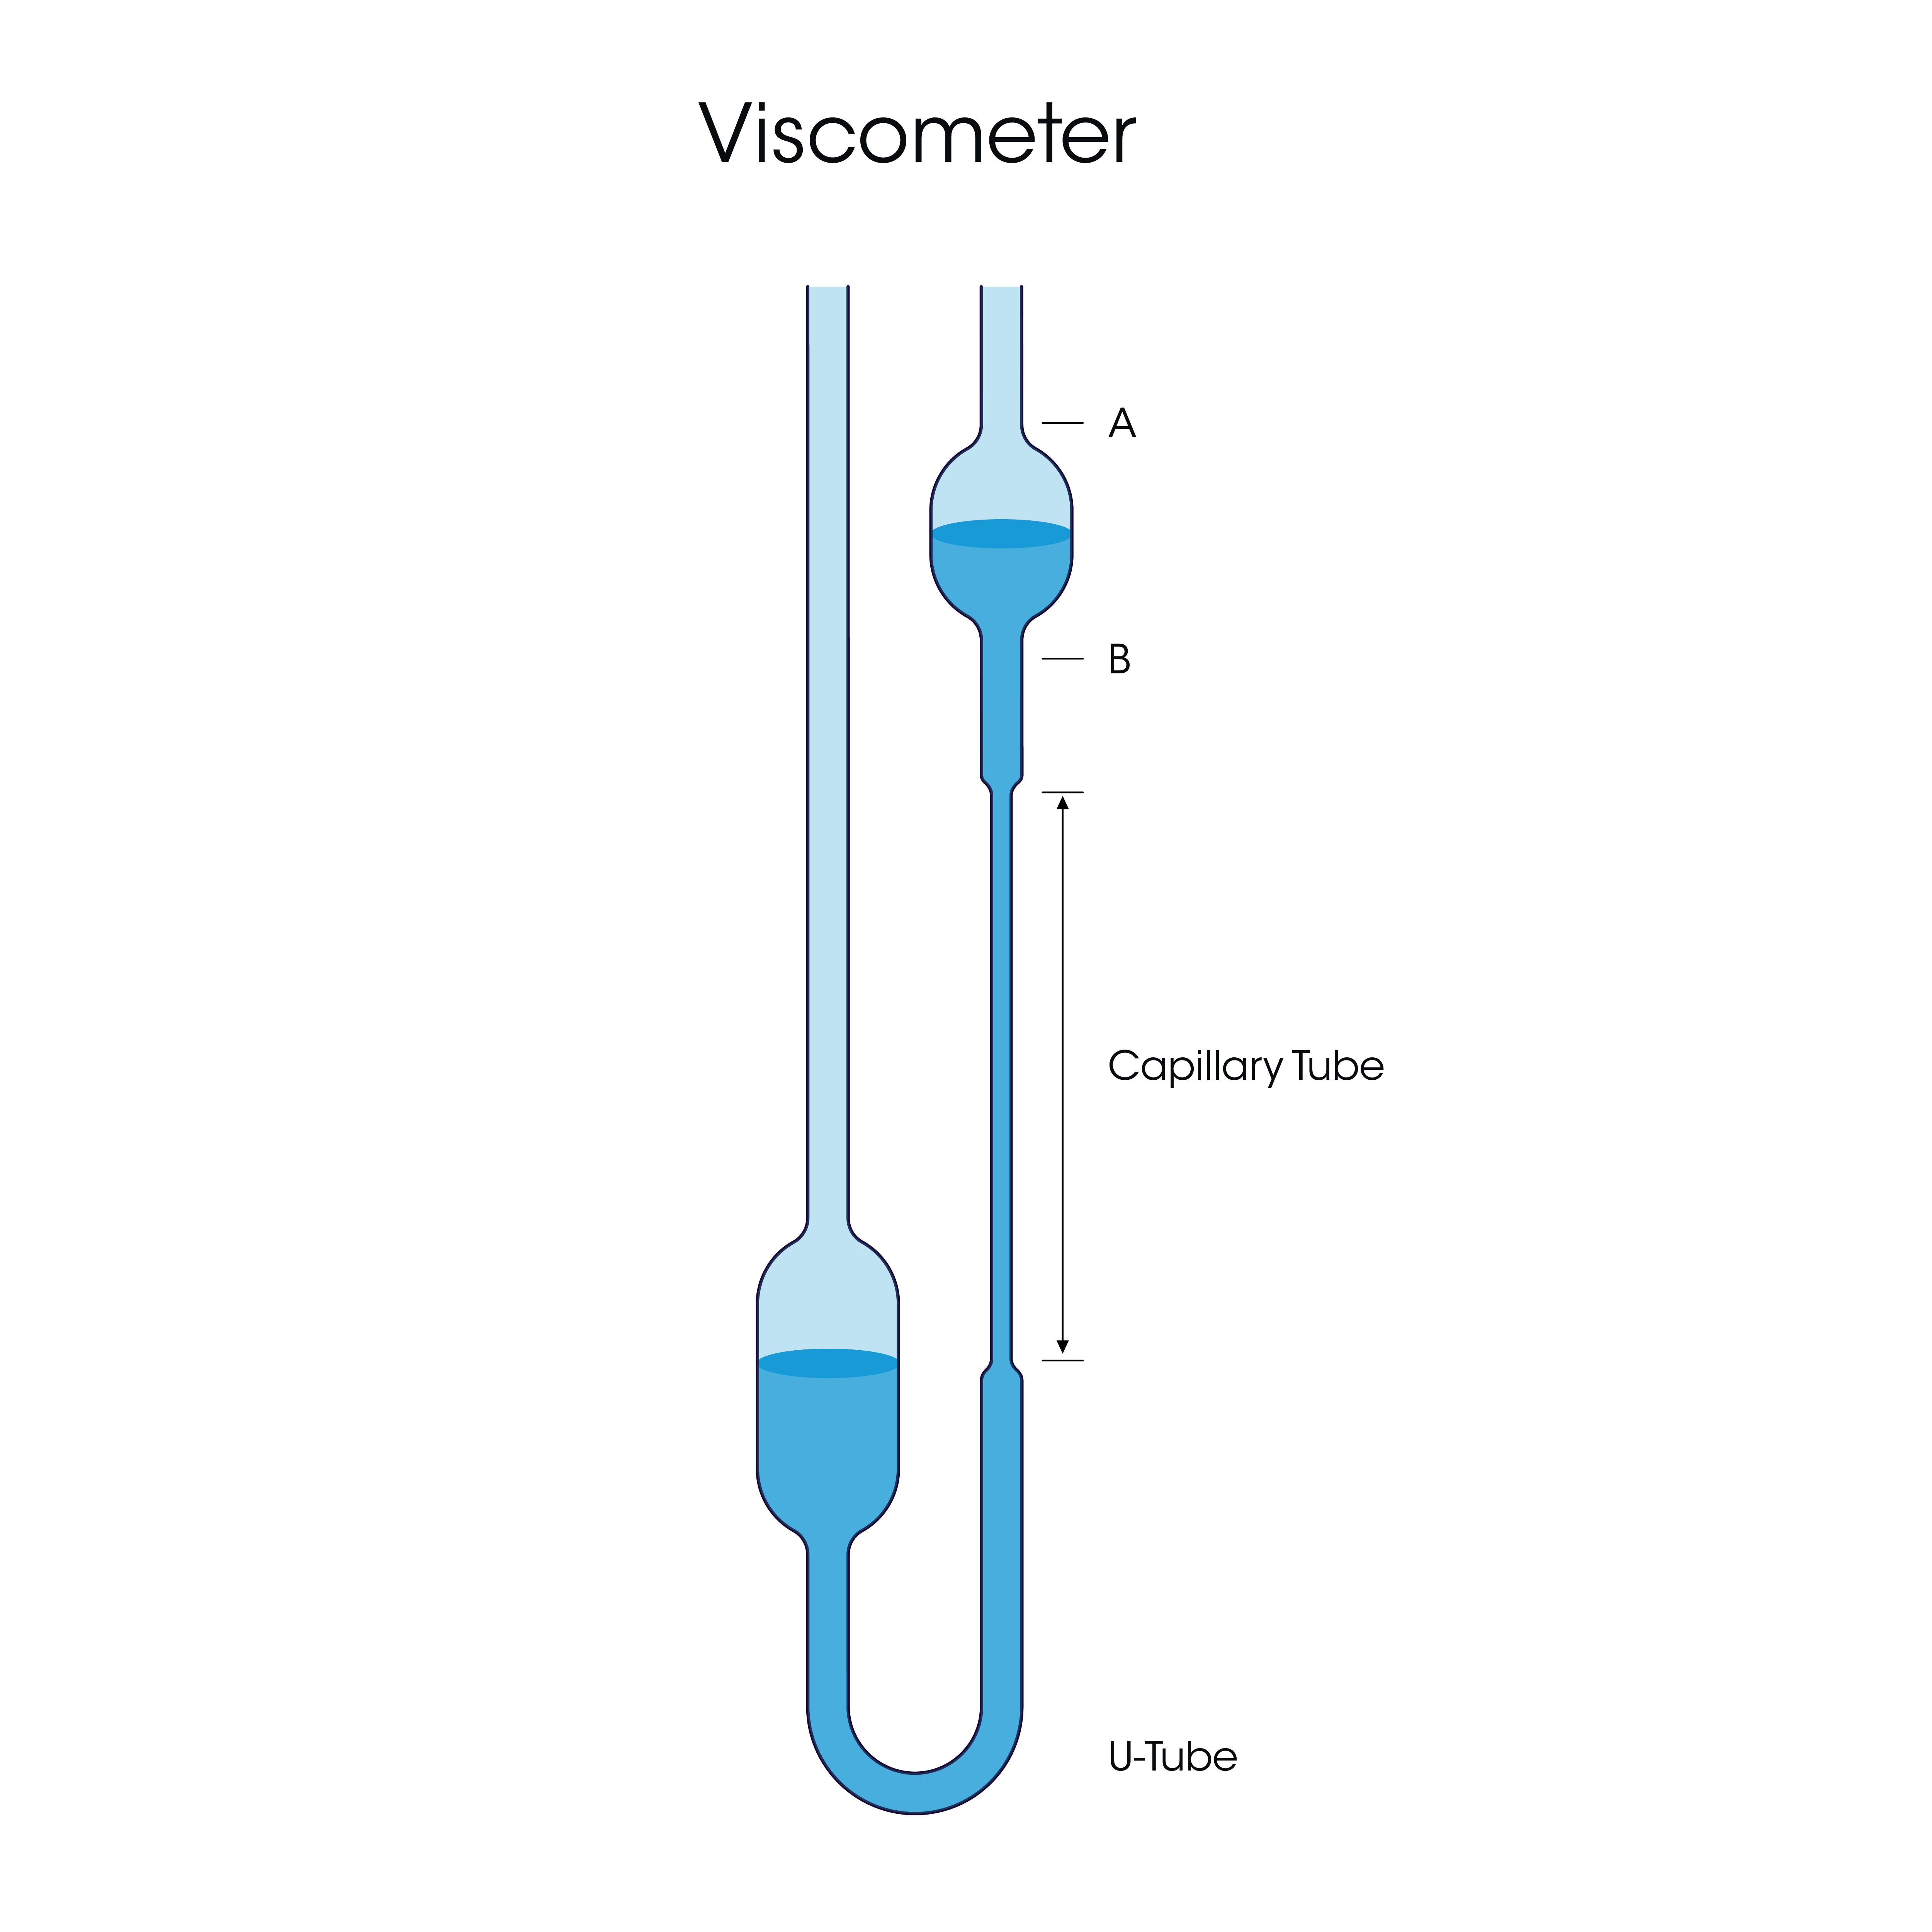
as a ubbelohde (U) viscometer. This is schematically shown in Figure 1. This type of instrument is limited in scope and does not allow for measurement of other key polymer solution properties, such as complete flow curves and viscoelasticity. These measurements can be made by a rheometer, which also has the benefit of measuring the absolute viscosity over a large shear rate range. Rheometers provide the ability to make additional measurements such as determining the viscoelastic parameters of the solutions. Furthermore, rheometers can more easily handle high throughput and offer easier cleanup than capillary viscometers; when running a multi-solution study such as the one performed for this note, there is significant time value added by using the rheometer. Therefore, the rheometer is a complete solution to characterize a multitude of polymer solution properties with a single instrument and simple setup.
The properties of poly (ethylene oxide) (PEO) (600 kDa) aqueous solutions with different concentrations were analyzed on a stresscontrolled rotational rheometer. Flow curves were obtained for solutions with a concentration range of 4 to 0.1 wt% PEO in deionized (DI) H2O. A flow model was used to extract important information such as the zero-shear viscosity (η0) and critical shear rates for shear-thinning. These measurements are discussed in relation to the intermolecular interactions of the polymer chains at different concentrations. Data from the model fitting was then used to calculate the intrinsic viscosity using a multi-concentration method with the dilute regime solutions. Two regression models were used for the analysis. Further oscillatory testing of strain and frequency sweeps were performed on the two highest concentrations samples. This enabled the solutions viscoelastic properties to be determined.
Experimental
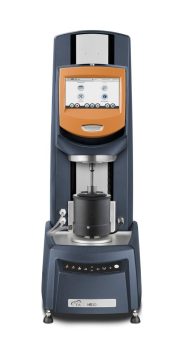
Eight dilutions were prepared with 600 kDa polyethylene oxide (PEO) (Sigma-Aldrich) from 4 to 0.1 wt%. The solutions were prepared in de-ionized water and stirred for 24 hours to ensure complete dissolution. The sample viscosities were determined using steady state flow sweeps from 1000 s-1 to their respective stability limits. Tests were performed with the Double Wall Concentric Cylinder accessory equipped with a solvent trap on the TA Instruments™ Discovery™ HR-30 Rheometer, shown in Figure 2. Data was then analyzed with a Cross model fit and subsequently those results were utilized for intrinsic viscosity determination based on the Huggins and Kraemer equations. Oscillatory experiments were then run to examine the viscoelastic behavior of the higher wt% solutions.
Results and Discussion
Concentration-Dependent Behavior and Flow Modeling
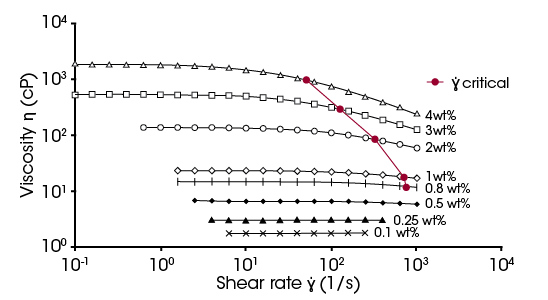
Figure 3 shows the flow curves of the eight dilutions of PEO. As the PEO concentration decreased, the viscosity of the solution also decreased. This is the expected result as dilution decreases polymer intermolecular interactions, as discussed in relation to the zero-shear viscosity and shear thinning behavior. Samples with concentrations of 1 wt% and below have truncated curves due to inherent artifacts of water flow emerging. These artifacts include surface tension showing artificial shear-thinning at low shear rates and secondary flows causing artificial shear thickening at high shear rates [4]. Using the Double Wall Concentric Cylinder reduced the appearance of the artifacts, allowing for testing a wider range of shear rates. The Newtonian portion was only considered for the lowest concentrations of 0.25 wt % and 0.1 wt%.
In addition to the expected viscosity change with concentration, the flow behavior changed as well. At the highest PEO concentrations there was a clear Newtonian plateau at low shear. This plateau was followed by shear thinning at higher shear rates. As the concentration of PEO was reduced, shear thinning began to occur at higher shear rates. Once a low enough concentration was reached, shear thinning was not present and only a Newtonian flow curve was observed.
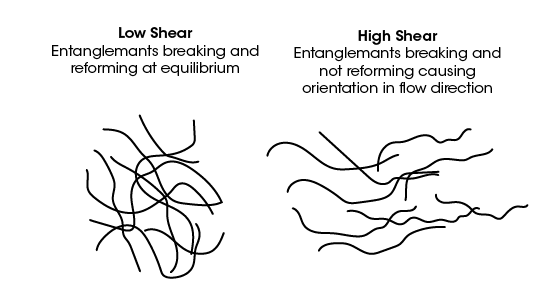
This phenomenon can qualitatively be understood by considering the intermolecular polymer interactions occurring at the different concentrations. At higher PEO concentrations, the PEO chains have a higher entanglement density compared to low concentrations. The shear thinning is caused by the disentanglement of the polymer chains, schematically shown in Figure 4. The disentanglement induces orientation of the molecules in the flow direction and a decrease in viscosity [5]. The Newtonian plateau followed by shear thinning can be understood as an equilibrium between disentanglement and re-entanglement. At low enough shear rates, the rate of disentanglement and formation of new entanglements is balanced. This presents as a shear independent viscosity and Newtonian plateau. Once a critical shear rate is reached, the rate of disentanglement exceeds that of entanglement formation and shear thinning begins. As the shear rate increases further there is increased disentanglement and orientation which causes further shear thinning.
The above behavior can be quantified by fitting flow models to the curves. For this system a Cross model was used to fit the higher concentration curves from 4 to 0.8 wt%. Below the above range, a Newtonian fit was sufficient to extract the needed parameters. The Cross model is given by Equation 1:

Where:
η is the measured viscosity
η0 is the Newtonian or zero-shear viscosity
η∞ is the infinite viscosity
k is the consistency
n is the power law index + 1
This model was chosen due to its simplicity and ability to quantify two important parameters when describing this systems behavior. First, it quantifies the zero-shear viscosity of the solutions. This value provides information on the polymer solution at rest and will be critical in determining the intrinsic viscosity. Second, the consistency is a time constant in this equation, with units of seconds. Taking the inverse of k corresponds to the critical shear rate of onset shear thinning [5]. The values of (1/k) are shown as the red points in Figure 3.
The trend in Figure 3 shows as the polymer concentration is increased, the shear rate of 1/k reduces. At higher polymer concentrations the polymer chains unentangle and orient at lower shear rates. As the concentration decreases, 1/k shifts to higher shear rates due to decreased entanglements. At the lowest concentrations of 0.25 and 0.1 wt% the shear thinning disappears due to the sufficient reduction or absence of entanglements in the dilute regime.
Intrinsic Viscosity Determination
To determine the intrinsic viscosity [η], the polymers contribution to the solutions viscosity, a multi-concentration method was used with the dilute samples from 0.8 to 0.1 wt%. The importance of model fitting from the previous section arises from the necessity for the measured viscosity values used in the calculations to be at zero shear. This avoids any shear dependency to influence the [η] determination. The η0 used here is from the Cross model previously discussed.
The multi-concentration method uses various “viscosities” or parameters that need to be calculated to obtain concentration dependent viscosity equations. Table 1 defines these equations, and the regression models used to determine [η].
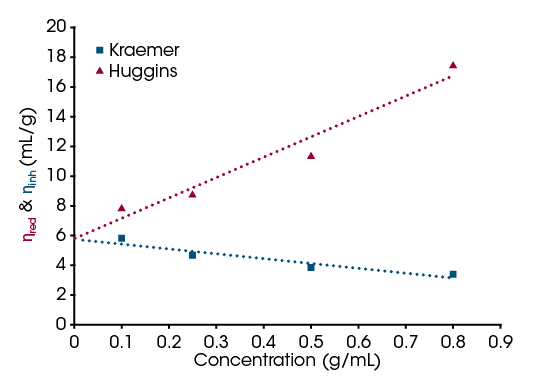
The relative viscosity is used to determine the concentration dependent reduced viscosity and inherent viscosity. The viscosities can then be plotted against concentration and regression models are used to extrapolate the concentration to zero [6]. This is done by running flow sweeps on the pure solvent and then a series of dilute polymer solutions at the same temperature. The ηrel can then be calculated for each concentration. From this, ηred and ηinh can be calculated to get concentration dependent viscosity terms. This is necessary as the [η] is defined as a concentration dependent ratio. The ηred and ηinh are then plotted on the same graph and linear fits are applied. The intersection at zero concentration value is taken as the [η].
For the analysis to be valid, the Kraemer and Huggins models must intersect at the same concentration point [6]. In Figure 5, the models both converge at 5.7 mL/g, showing that the analysis is valid, and this is the intrinsic viscosity for the PEO system used. Similar PEO aqueous solutions have shown values from 2 mL/g to 15 mL/g, so the results from the rheometer are in line with expectations and demonstrate the feasibility of such measurements on the instrument [7].
Table 1. Parameters used for intrinsic viscosity determination and regression models for intrinsic viscosity determination
| Viscosity Parameter | Equation | Definition |
|---|---|---|
| Relative Viscosity | Newtonian viscosity of solution over pure solvent viscosity | |
| Reduced Viscosity | Relative viscosity increment over concentration. Also referred to as viscosity number | |
| Inherent Viscosity | Natural logarithm of the relative viscosity over concentration. Also referred to as logarithmic viscosity number | |
| Intrinsic Viscosity (Huggins) | Huggins equation, linear approach to virial expansion | |
| Intrinsic Viscosity (Kraemer) | Kraemer equation, logarithmic approach to virial expansion |
Viscoelasticity
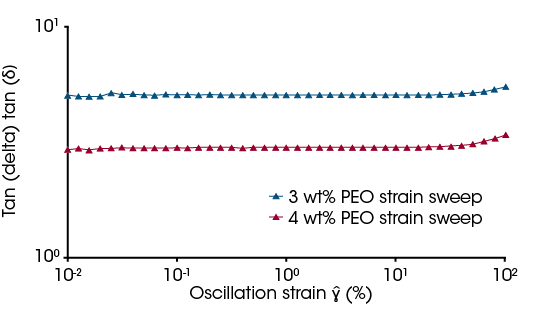
Not only can rheometers provide the flow curves required to calculate intrinsic viscosity, but they can also be used for viscoelasticity measurements. Viscoelasticity is the measure of how much a material acts as a viscous liquid and elastic solid. As discussed previously, entanglements at higher concentrations provide an almost network-like structure and therefore concentration-dependent viscoelastic properties are expected. For this PEO system, the 4 and 3 wt% samples were further tested in oscillatory measurements to investigate viscoelastic behavior. Figure 6 shows the tan delta of the two solutions from strain amplitude sweeps. The tan delta is the ratio of the Loss modulus (G”) over the Storage modulus (G’). A lower ratio refers to a more elastic material when examining comparable systems. As the 4 wt% solution has a higher entanglement density, as demonstrated by the higher viscosity at low shear in Figure 3, compared to lower concentrations it is expected to have a lower tan delta compared to a more dilute solution where the entanglements are reduced. Physically, this phenomenon occurs due to the entanglements acting as crosslinking points and giving the solution a network-type structure similar to increasing physical or chemical crosslinks in a hydrogel.
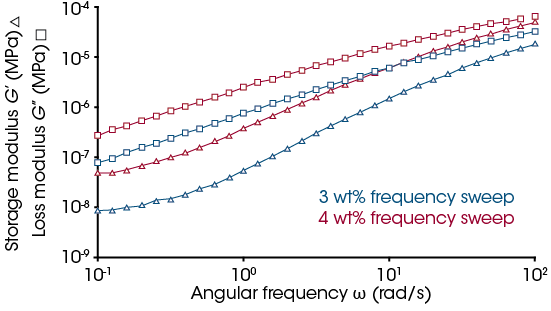
In addition to the strain sweeps, frequency sweeps can be run within the linear viscoelastic region (LVR) of the samples. [9] For these samples, the magnitude of this region is relatively large. This can be observed in Figure 6 where the upturn in tan delta does not occur until after ~10% strain. Figure 7 shows the frequency sweeps at 2% strain for the 4 and 3 wt% solutions. For both solutions, the Loss moduli is above the Storage moduli with a decreasing frequency dependency. This confirms a viscous solution with no permanent crosslinks. This quantitatively confirms no gelling of the solutions from 4 wt% or below.
Conclusions
The viscosity of complex polymer systems is influenced by several factors. This note examined the influence of concentration of PEO on viscosity and then determined the intrinsic viscosity of the solution. This note specifically focused on the influence of concentration for a PEO aqueous polymer solution. Flow curves were generated for eight different dilutions and a Cross model was fit to the curves. It was qualitatively discussed how the higher entanglement density led to earlier onset shear-thinning as the polymer concentration increased. This was then quantitatively explained using the Cross model where a critical shear rate of onset shear thinning (1/k) parameter was determined and identified the same behavior.
A multi-concentration method was used to determine the intrinsic viscosity of this specific PEO aqueous solution system. Intrinsic viscosity is an important parameter because of the physical quantities it can be related to that are key in several fields. The zero-shear viscosity from the Cross model was used to calculate the concentration dependent reduced and inherent viscosity. The Huggins and Kraemer regression models were used to extrapolate the reduced and inherent viscosities to zero, respectively. The coincidence of the regressions to the same value indicates an accurate analysis. This shows the ability for this type of technique to be performed on a rotational rheometer as opposed to capillary rheometer, which is the common practice.
The rotational rheometer can perform a diverse range of testing compared to a capillary rheometer and this adds to its utility. For the PEO system, the viscoelastic properties were measured, and the results identify a clear concentration dependence of this polymer solution. At higher concentrations there is a higher entanglement density. This manifests as a lower tan delta, which indicates a more elastic material. Frequency sweeps were then used and show both solutions were viscous liquids. This additional testing shows a clear concentration dependency where the higher concentration solutions are highly viscous, and not gelled mixtures.
References
- M. Krause, “Technologies and Innovations for the Plastics Industry: Polymer 2030,” in Innovative Technologies and Market Leadership, Cham., Springer, 2020, pp. 233-243.
- G. Marrucci and G. Ianniruberto, “Molecular Theories of Polymer Viscosity,” in Complex Flows in Industrial Processes, Boston, Birkhauser, 2000, pp. 3-24.
- S. Harding, “Intrinsic Viscosity,” in Encyclopedia of Biophysics, Heidelberg, Springer, 2013, pp. 1123-1129.
- R. H. Ewoldt, M. T. Johnston and L. Caretta, Experimental Challenges of Shear Rheology: How to Avoid Bad Data. In: Spagnolie, S. (eds) Complex Fluids in Biological Systems. Biological and Medical Physics, Biomedical Engineering, New York: Springer, 2015.
- M. Bahlouli, K. Bekkour, A. Benchabane, Y. Hemar and A. Nemdili, “The Effect of Temperature on the Rheological Behavior of Polyethylene Oxide (PEO) Solutions,” Applied Rheology, vol. 23, no. 1, 2013.
- M. Rubenstein and R. Colby, Polymer Physics, Oxford: Oxford Academic, 2003.
- S. Kawaguchi, G. Imai, J. Suzukit, A. Miyahara, T. Kitanoi and K. Ito, “Aqueous Solution Properties of oligo-and poly (ethylene oxide) by Static Light Scattering and Instrinic Viscosity,” Polymer, vol. 38, no. 12, pp. 2885-2891, 1996.
- J. Dealy and K. Wissburn, “Rotational and Sliding Surface Rheometers,” in Melt Rheology and Its Role in Plastics Processing, Boston, Springer, 1990, pp. 269-297.
- K. Whitcomb, “Determining the Linear Viscoelastic Region in Oscillatory Measurements,” TA Instruments, DE USA.
Acknowledgement
For more information or to request a product quote, please visit www.tainstruments.com to locate your local sales office
information.
This paper was written by Mark Staub, Ph. D
TA Instruments and Discovery are trademarks of Waters Technologies Corporation.
Click here to download the printable version of this application note.

