Keywords: DMA, Mechanical properties, NMC, Electrode sheets, Battery material
RH145
Abstract
Lithium-ion batteries are integral to modern technology, powering devices from mobile phones to electric cars. The performance of these batteries heavily relies on the quality of electrode sheets, which form the anode and cathode. Key mechanical properties, such as tensile strength and endurance limit of these sheets, are crucial for the durability and reliability of batteries under various conditions. Dynamic mechanical analyzers and dynamic mechanical analysis (both referred to as “DMA”) are powerful tools in the battery industry, providing detailed information on the viscoelastic properties of electrode sheets and other components under stress. This study examines the mechanical properties of lithium nickel-manganese cobalt (NMC) cathode sheet, including elastic modulus, tensile strength, and fatigue resistance. The TA Instruments™ Discovery™ DMA 850 offers valuable insights that aid in the development and optimization of battery materials, making it a key asset in improving battery component formulation and processing.
Introduction
Proper mechanical integrity and stability of electrodes are crucial for consistent electrochemical performance and the longevity of battery cells. Understanding the viscoelastic properties of electrode sheets through DMA aids in designing more robust and safer batteries [1]. DMA can determine the ultimate tensile strength of electrode sheets, indicating the maximum stress the material can withstand before fracture. This is critical for ensuring that electrode sheets can handle the mechanical stresses during battery assembly and operation [2]. During the winding process of manufacturing, the electrode is under tension. Sufficient tension is required to prevent wrinkles or misalignment, but the force must not be high enough to deform or damage the electrode.
Fatigue tests help determine the lifespan of electrode sheets under cyclic loading conditions, essential for applications where materials are subjected to repeated stress, such as in the automotive and aerospace industries [3].
DMA can also identify potential issues related to mechanical degradation during charge and discharge cycles, which is vital for applications like electric vehicles. During these cycles, lithium ions intercalate into and de-intercalate from the electrode materials, causing them to expand and contract. This cyclic volume change induces significant mechanical stresses on the electrodes [4, 5, 6, 7].
The TA Instruments Discovery DMA 850 is a high-precision Dynamic Mechanical Analyzer used for material characterization. It offers various clamps for different materials and testing modes, such as the tension clamp for films and fibers, the three-point bending clamp for rigid materials, and the shear sandwich clamp for soft materials. In this study, the Discovery DMA 850 was employed for a variety of dynamic oscillatory and transient tests to characterize electrode sheets.
Experimental
Material
An NMC811-006-LiNbO3 electrode sheet (see Figure 1) from NEI Corporation was used in this study and will be referred to as NMC811. It is approximately 0.08 mm thick, composed of 90% active material, 5% polyvinylidene fluoride (PVDF) binder, and 5% Super P™ Carbon Black. It is cast on 0.02 mm thick aluminum current collectors, serving as cathodes for lithium-ion batteries.
Methods
Various tests were conducted, including frequency sweep, strain ramps, creep-recovery, and fatigue tests. Some of these tests were performed in tension and some in bending modes, to investigate the mechanical properties of this NMC sheet. Table 1 below shows the tests methods in tension mode along with parameters used, while Table 2 shows the bending tests details. Details on best practices for testing thin sheets on the DMA 850 can be found in RH144 [8].
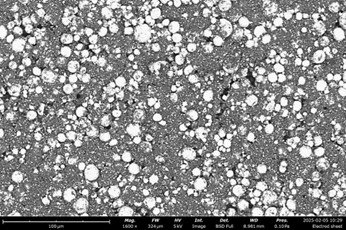
Table 1. Testing of the electrode sheet in tension – Two-screw film clamp
| Test | Parameters |
|---|---|
| Frequency sweep | Preload: 0.4 N Strain: 0.007% |
| Strain ramp | Strain: 0.001% – 5% Rate: 0.01%/min |
| Creep recovery | Stress: 100 kPa, 10,000 kPa |
Table 2. Testing of the electrode sheet in bending – 10 mm single cantilever
| Test | Parameters |
|---|---|
| Strain ramp | Strain: 0.001% – 5% Rate: 0.01%/min |
| Fatigue test | Frequency: 0.1 Hz Stress: 500,000 kPa, 400,000 kPa, 200,000 kPa, 100,000 kPa |
Results and Discussion
Tension
Frequency sweep
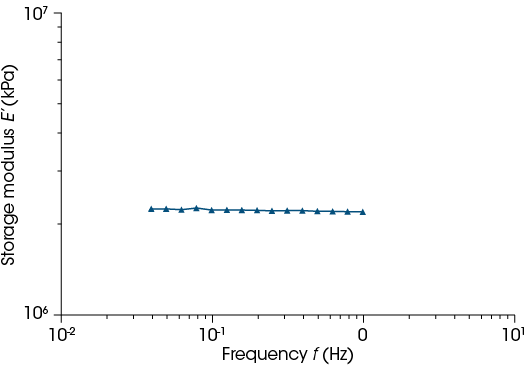
In Figure 2, a frequency sweep test was conducted at a strain amplitude of 0.007% within the linear-viscoelastic region, where the torque and displacement signals were optimally in phase. Across the tested frequencies, the elastic (storage) modulus was 2.2 × 10⁶ kPa and independent of frequency.
Tensile test (strain ramp)
A strain ramp or tensile test is a fundamental mechanical test to determine a material’s properties. These tests are simple and standardized. By pulling the material apart, its strength and elongation can be measured. The test typically plots stress (force per unit area) versus strain (elongation per unit length) [9, 10, 11].
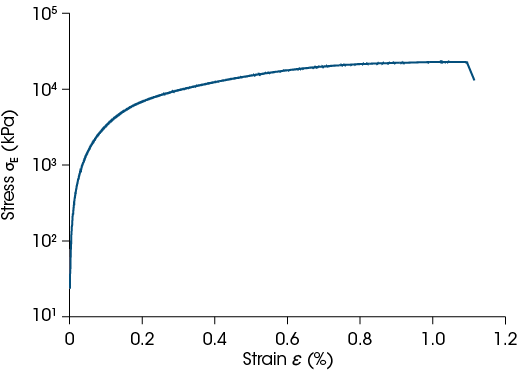
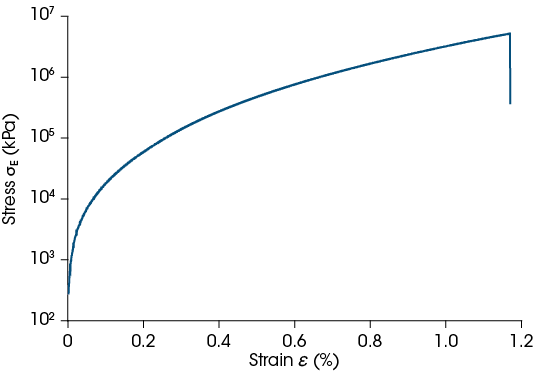
As shown in Figure 3, strain ramp (tensile) tests were conducted on the sheet, ranging from 0.001% to 5% strain at an increment rate of 0.01%/min.
Initially, many materials adhere to Hooke’s law, exhibiting a linear relationship between stress and strain. However, as strain increases, materials often deviate from this linearity due to plastic flow, where their internal structure rearranges. Materials that are unable to undergo this rearrangement, often because their internal structures block dislocation motion, tend to be brittle [11, 10, 2].
Materials can be classified into two groups based on their total strain (percent elongation) before breaking during a strain ramp (tensile) test. Ductile materials undergo more than 5% strain before breaking, while brittle materials break with less than 5% strain [12, 2, 11]. Thus, it can be concluded that the NMC811 electrode sheet is a brittle material.
The maximum tensile stress a material can carry, known as the ultimate tensile stress (maximum tensile strength), corresponds to the highest point on the stress-strain curve. The corresponding strain is the ultimate tensile strain [10, 11, 13]. The findings indicate that the ultimate tensile strength for the sheet is approximately 2×10⁴ kPa.
The area under the stress-strain curve up to the point of rupture represents the material’s toughness, or its ability to absorb energy (elastic & plastic). A more ductile material (with higher ultimate tensile strain) will generally have a larger area under the curve, indicating higher toughness [9, 10, 14].
Brittle materials like this sheet typically fracture with minimal plastic deformation, breaking abruptly and without significant elongation. They fail by rupturing, which involves the separation of atomic planes, at the ultimate stress point, without any noticeable yielding beforehand. Since it is difficult to pinpoint the exact stress at which plastic deformation begins, the yield stress is often taken as the stress needed to induce a specified amount of permanent strain, typically 0.2%. To determine the “offset yield stress,” an “imaginary” line with the same slope as the linear elastic region is drawn from the strain axis at 0.2% [13, 10].
It is important to clarify that the terms “stiffness” and “strength” are often used interchangeably, but they describe distinct material properties. Stiffness measures a material’s resistance to deformation under an applied force and is quantified by the material’s Young’s modulus (or elastic modulus). Strength, on the other hand, refers to the maximum stress a material can endure before failure or permanent deformation occurs. It indicates the material’s capacity to resist breaking under load. In essence, stiffness is about resistance to deformation, whereas strength is about resistance to failure [10, 2, 11].
Creep recovery
A creep-recovery test is a fundamental method for studying the relaxation of materials. Creep testing involves applying a constant stress to the sample and monitoring its deformation over time. Once the stress is removed, the material is allowed to relax, a process known as the recovery test. These two tests are often performed sequentially [10, 11, 4, 14]. During the recovery phase, the material’s ability to return to its original shape is measured. The extent of the total deformation that is recovered after the load is removed reflects the material’s elasticity and its ability to return to its original shape after deformation [11, 4, 14].
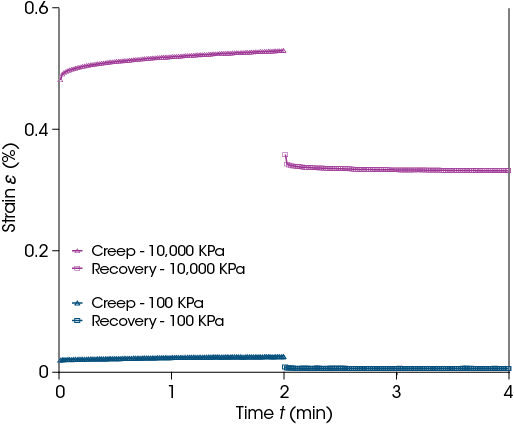
Figure 4 presents the results of creep-recovery tests conducted at two stress levels: 100 kPa and 10,000 kPa, based on the strain-stress curve obtained in Figure 3. At 100 kPa, the recovery strain returns to almost zero, indicating nearly perfect elastic deformation. Conversely, at 10,000 kPa, higher strain is measured, and the recovery strain does not return to zero, signifying some plastic deformation.
The mechanical stability of electrode materials is essential to prevent degradation during charge and discharge cycles. The charge and discharge cycles cause significant volumetric changes due to lithium intercalation and de-intercalation, leading to mechanical deformation. This deformation can result in particle cracking, fragmentation, and loss of contact between active materials and current collectors, ultimately reducing capacity and degrading overall battery performance [5, 1, 6, 12].
Creep-recovery tests have the potential to investigate this phenomenon. To achieve this goal, the test should be set up by selecting a stress value within the elastic region before initiating charging and discharging cycles, where zero strain recovery is expected from the initial creep-recovery test. After several cycles of charging and discharging, the same creep-recovery test is repeated. By continuing this process, it is possible to determine the number of cycles after which plastic deformations (nonzero strain recovery) begin to appear in the sheets. This method allows for the prediction of the lifespan of electrode sheets under mechanical deformation during charge and discharge cycles.
Bending
Fatigue test
Fatigue refers to the weakening of a material caused by repeated (cyclic) loading. Cyclic loading can lead to progressive, brittle, and localized structural damage. Once a crack forms, each loading cycle contributes to incremental crack growth. Despite the brittle nature of the fracture, its propagation can be gradual, influenced by the intensity and frequency of the stress cycles. The number of cycles needed to cause fatigue failure at a specific stress level is typically high but decreases as the stress increases [13, 15, 16]. The American Society for Testing and Materials (ASTM) defines fatigue life (Nf) as the number of stress cycles a specimen can sustain before a specified type of failure occurs. Fatigue life is affected by various factors, including material properties, cyclic stresses, residual stresses, internal defects, design geometry, and surface quality [3, 13, 16]
For some materials, there is a theoretical stress amplitude below which the material will not fail, regardless of the number of cycles. This is known as the fatigue limit or endurance limit [3, 17, 12, 18].
There are several methods to determine the fatigue life of a material, with one of the most useful being the stress-life method, commonly represented by an S-N curve (Figure 6A). This method plots the applied stress (S) against the number of cycles to failure (N). If the S-N curve does not level off, the material does not have a distinct fatigue limit [15, 16].
For this thin, brittle, and easily buckled sheet, bending is the more feasible mode for running fatigue tests. First, the strain ramp test procedure shown in Figure 3 needs to be repeated to determine the ultimate strength (see Figure 5).
Oscillation stress values below the rupture point for NMC811 were selected based on the stress-strain curve in Figure 5. These levels were chosen to ensure they are within or close to the elastic region of the material.
At a frequency of 0.1 Hz, 10,000 cycles took roughly 24 hours to complete.
At the fatigue limit, the S-N curve becomes horizontal at higher values of N, indicating that the material can theoretically endure an infinite number of cycles without failing. From Figure 6B, we observe that at 100,000 kPa and above 10,000 cycles, the S-N curve becomes almost horizontal. Therefore, this stress amplitude could be very close to the fatigue limit or endurance limit of the NMC811 sheet.

Conclusions
DMA can characterize a variety of mechanical properties in battery electrode sheets. These properties include the strength, toughness, and fatigue life of the sheets. Measuring these properties can help identify performance of the sheets, as well as be used for quality control.
Experiments run on an NMC811 cathode sheet found the following:
- The NMC811 sheet exhibits an endurance limit, indicating its ability to withstand a repeated limit stress without failure.
- The sheet is a brittle material, fracturing with minimal plastic deformation and breaking abruptly without significant elongation.
- The potential for conducting creep-recovery tests on this sheet and similar ones to assess the influence of charging and discharging cycles on their mechanical deformation was demonstrated.
References
- A. Etiemble, N. Besnard, A. Bonnin, J. Adrien, T. Douillard, P. Tran-Van, L. Gautier, J. Badot, E. Maire and B. Lestriez, “Multiscale morphological characterization of process induced heterogeneities in blended positive electrodes for lithium–ion batteries,” Journal of Materials Science, pp. 3576-96, 2017.
- D. Roylance, “Stress-strain curves,” Massachusetts Institute of Technology study, Cambridge, 2001.
- A. H. Ertas and M. Akbulut, “Experimental study on fatigue performance of resistance spot-welded sheet metals,” The International Journal of Advanced Manufacturing Technology, pp. 1205-1218, 2021.
- P. Sudeshna, P. M. Ajayan and T. N. Narayanan, “Dynamic mechanical analysis in materials science: The Novice’s Tale.,” Oxford Open Materials Science, p. itaa001, 2021.
- L. A. Román-Ramírez, . G. Apachitei and . M. Faraji-Niri, “Effect of coating operating parameters on electrode physical characteristics and final electrochemical performance of lithium-ion batteries,” International Journal of Energy and Environmental Engineering, pp. 943-953, 2022.
- J. Liu, W. Lin, Z. Wang, Y. Wang, T. Chen and J. Zhen, “Elastic Mechanics Study of Layered Li (Ni x Mn y Co z) O 2,” PRX Energy, p. 013012, 2024.
- G. Vegh, A. Madikere Raghunatha Reddy, X. Li, S. Deng, K. Amine and K. Zaghib, “North America’s Potential for an Environmentally Sustainable Nickel, Manganese, and Cobalt Battery Value Chain,” Batteries, p. 377, 2024.
- TA Instruments, “RH144: Best Practices for Testing Thin Sheets on the DMA 850,” TA Instruments, New Castle, DE, 2025.
- https://www.tainstruments.com, “TRIOS (Version 5.8),” [Software documentation]. TA Instruments-Waters LLC, 2024.
- D. Roylance, “Engineering viscoelasticity,” Massachusetts Institute of Technology, Cambridge, 2001.
- J. W. Callister and D. Rethwisch , Materials science and engineering: an introduction, New York: John wiley & sons, 2020.
- D. Roylance, “Introduction to fracture mechanics,” Massachusetts Institute of Technology, Cambridge, 2001.
- D. F. Handbook, Mechanical Science, Volume 1 of 2, Washington, DC: US Department of Energy, 1993.
- K. P. Menard and N. Menard, Dynamic mechanical analysis, CRC press, 2020.
- G. Tolf and C. Per, “Comparison between flexural and tensile modulus of fibre composite,” Fibre Science and Technology, pp. 319-326, 1984.
- P. Gupta, M. Streb, A. Siddiqui, M. Klett and G. Lindbergh, “Layer-Resolved Mechanical Degradation of a Ni-Rich Positive Electrode,” Batteries, p. 575, 2023.
- S. A. Naga and T. A. El-Sayed, “Fatigue Failure in Polymeric Materials: Insights from Experimental Testing,” Journal of Failure Analysis and Prevention, pp. 922-935, 2024.
- TA Instruments, “Tensile and Fatigue Properties of Additively Manufactured Polyamides,” 2023. [Online]. Available: https://www.tainstruments.com/pdf/literature/EF037.pdf.
Acknowledgement
For more information or to request a product quote, please visit www.tainstruments.com to locate your local sales office information.
This paper was written by Behbood Abedi, PhD.
TA Instruments and Discovery are trademarks of Waters Technologies Corporation. Super P is a trademark of Imerys Graphite & Carbon Switzerland SA.
Click here to download the printable version of this application note.

