Keywords: DSC, Solid-solid transitions, Memory-shaped alloys
TA346
Abstract
The nitinol shape-memory alloy solid-solid transition is studied using differential scanning calorimetry (DSC), which reveals the reversible and hysteretic nature of this transition. This can be used to provide information on the composition of the nitinol alloy. It also serves as a tool to detect the existence of, and changes in, the intermediate R-phase.
Introduction
Nitinol is an acronym for alloys of nickel and titanium (1). These alloys display what is termed a shape-memory effect (2), which is the ability of certain materials to be deformed at low temperature and then upon heating return to their original shape. Because of this, and since their shape-memory effect can be tailored by altering either the nickel / titanium percentages or alloying with a third metal, nitinol alloys have a wide variety of applications from drug stents to orthodontic braces. The shape-memory property is related to a solid-solid transition that the material goes through. A solid-solid transition is a transformation from one crystal structure to another upon heating and / or cooling. There are many different types of solid-solid transitions, but all are characterized by a latent heat and are thus first order transitions detectable by DSC. The transformation in nitinol is characterized by a conversion from an Austenitic (cubic) to a Martensitic (monoclinic) form upon cooling and the reverse transformation upon heating (1). In some instances upon cooling, an intermediate R (rhombohedral) phase precedes the formation of the monoclinic phase (3). Much DSC work has been performed on nitinol (3-5), as it is an excellent technique for studying the solid-solid phase transition, and there are numerous ASTM International documents related to determining its properties including one on thermal analysis (6).
Experimental and Results
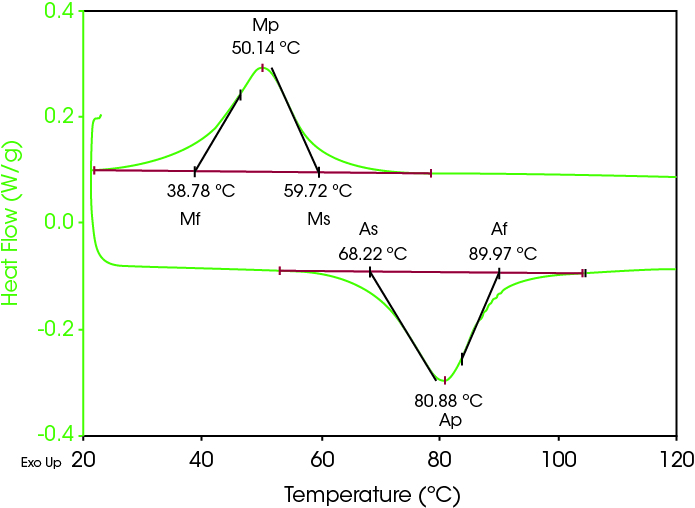
Figure 1 shows a typical DSC scan on a sample of nitinol. Data was collected on a Q2000 DSC equipped with a Refrigerated Cooling System (RCS90). The sample was encapsulated in an aluminum Tzero pan, scanned at 10 °C/min in both heating and cooling modes and the data analyzed to report the Austenitic start, peak and finish (As, Ap, Af) plus the Martensitic start, peak and finish (Ms, Mp, Mf) in accordance with ASTM International Standard F2004 (6). The data show that the transition is both reversible and hysteretic. The transformation temperature hysteresis in the transition on heating and cooling depends very sensitively on the exact percentages of nickel and titanium in the alloy. In fact, DSC is one of the most sensitive tools for measuring the percentage of nickel and titanium in nitinol samples (7) through its measurement of this hysteresis. Typically, the magnitude of the hysteresis is reported as the difference between Ap and Mp (8) and in this case is 30.14 °C. Typical values of the hysteresis for binary nitinol samples are between 25-50 °C (8).
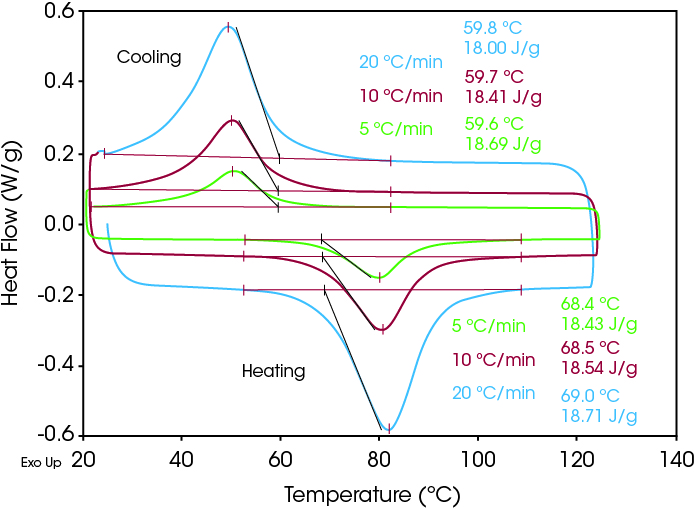
Figure 2 shows multiple DSC scans of the same sample performed at different heating and cooling rates respectively. Analysis of onset temperatures show the nitinol solid-solid transition to be rate independent in both heating and cooling modes. This is similar to other solid-solid transitions such as those found in tolbutamide and adamantane.


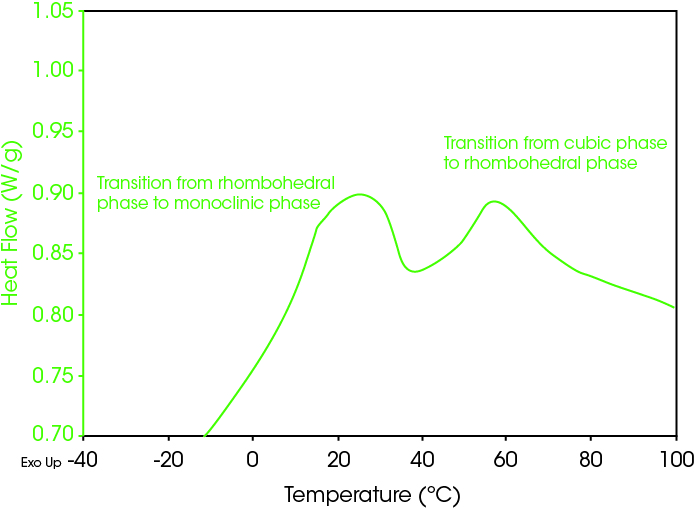
The cubic high temperature to the monoclinic low temperature phase transition can occur in a single or double step. The latter is characterized by an intermediate rhombohedral phase, which DSC can easily detect and monitor changes therein. Figure 3 shows an initial cooling scan on a nitinol wire sample, where the appearance of two peaks indicates that the formation of the R-phase on cooling is a stable part of this sample’s transformation from the cubic to the monoclinic form.
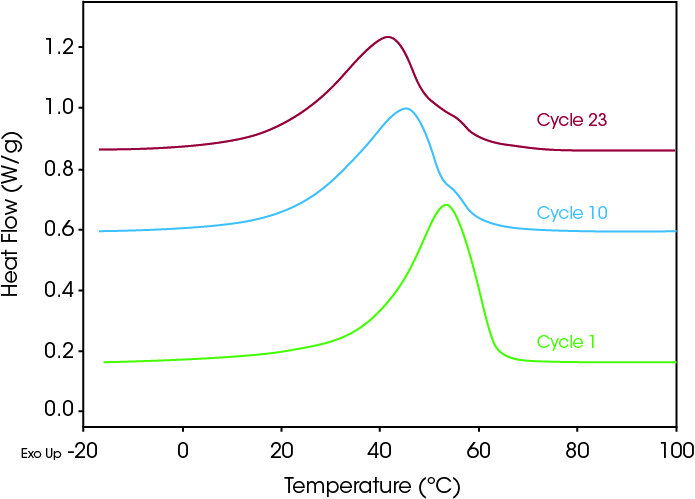
The R-phase can be induced in nitinol by thermal cycling and aging (3). Figure 4 shows cooling curve results of a thermal cycling experiment on the sample shown in Figures 1 and 2, where the sample was cycled numerous times from –25 to 150 °C and back to –25 °C at 20 °C/min. On the first cooling cycle, a single exothermic peak characterizes the transition. At cycle 10, a noticeable shoulder appears on the left side of the peak that is further pronounced by cycle 23. (Note: The curves are shifted in the Y-axis direction for easier viewing). The shift in peak temperature of the final transition to lower temperatures is also characteristic as the R-phase grows (4).


Conclusions
DSC is an excellent technique for examining the solid-solid transition in nitinol shape-memory alloys. This transition is a first order transition that shows no dependency on heating rate. DSC provides a quick way to determine the ratio of nickel to titanium in the sample by measuring the hysteresis between the peak temperatures on heating and cooling. It is also is a very sensitive way to probe the structural transformation and changes that occur due to further alloying, thermal cycling and aging through the size of the transformation temperature hysteresis and/or the existence of the R-phase.
References
1. W.J. Buehler, J.W. Gilfrich and R.C. Wiley, Journal of Applied Physics, 1963, 34, p.1475.
2. M. Fremond, Shape Memory Alloys, (Springer-Verlag Wien, New York), 1996, p.71.
3. G. Airoldi and B. Rivolta, Physica Scripta, 1987, 37, p.891.
4. Hitoshi Matsumoto, Physica B, 1993, 190, p.115.
5. Su-Young Cha, et al., Journal of the Korean Physical Society, 2006, 49, S580.
6. F2004, Standard Test Method for Transformation Temperature of Nickel-Titanium Alloys by Thermal Analysis, ASTM International, West Conshohocken, PA.
7. Measuring Transformation Temperatures in NiTi Alloys, Johnson Mathey Technical Application Note, http://www. jmmedical.com/html/transformation_temps.html
8. Transformation Temperature Hysteresis in NiTi Alloys, Johnson Mathey Technical Applications Note, http://www. jmmedical.com/html/hysteresis.html.
Acknowledgement
Click here to download the printable version of this application note.

