Keywords: Cheese, DSC, TGA, Food, self-heating, Tzero® technology
TA428
Abstract
Cheese is a dairy product that has been manufactured since olden times and its consumption has been increasing throughout the years. A large variety of cheeses are available, in which the composition and manufacturing process are the differentiation factors. Thermal processes are crucial in the cheesemaking industry in order to reach the optimal quality and safety; two useful techniques to consider when analyzing composition and structure behavior in materials are TGA and DSC. Commercial Cheddar and Mozzarella cheeses showed three main weight losses when tested in TGA and melting and crystallization events when tested in DSC. Test methods and results are discussed in this study.
Introduction
Humankind has enjoyed cheese since the earliest civilizations, when the domestication of dairy animals such as cattle, goats, and sheep allowed the consumption of milk and the exploration of its different products. Cheese production occurred only at an artisanal level until the mid- nineteenth century, it spread initially throughout Europe and the Middle East, and later to the Americas and Oceania. More than 1500 cheese varieties are produced and although much cheese is still artisanal produced, the main varieties are produced in large highly mechanized factories with developed technology [1][2].
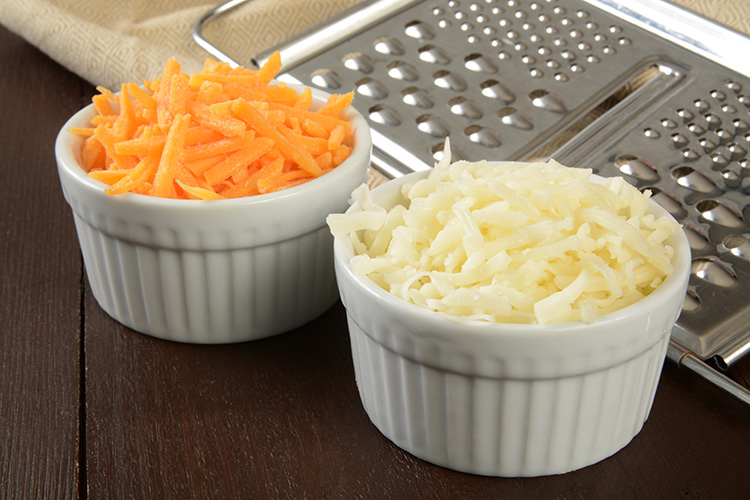
Among the most popular variety of cheeses are Cheddar and Mozzarella cheeses. Cheddar cheese was originally produced around the village of Cheddar, in Somerset, England; mozzarella cheese originated in southern Italy and was made from buffalo milk. Mozzarella is still made in Italy, but the world-wide manufactured type of mozzarella cheese is made from pasteurized and partly skimmed cows’ milk and is often known as Pizza cheese. Cheddar (American) cheese has a composition of 32% fat, 63% total solids, 25% total protein, 1.5% salt and 4.1% ash. Mozzarella cheese contains 18% fat, 46% total solids, 22.1% total protein, 0.7% salt and 2.3% ash [1]. The moisture content in cheeses varies and determines their classification, firm cheeses may have a moisture content as low as 30%, whereas moisture content in soft or fresh cheeses may be as high as 80% [4].
Cheesemaking process involves several thermal and mechanical steps. Studying and understanding the thermal behavior in cheesemaking have led to some factors such as improved and consistent quality, and storage and consumption safety. Thermogravimetric analysis and differential scanning calorimetry are important tools for measuring cheese composition and structure properties and will be the topic of this paper.
Experimental
Commercial cheddar and mozzarella cheeses were used as example samples for all tests. TA Instruments TGA 5500 and DSC 2500 equipped with a Refrigerated Cooling System (RCS) 120 were the chosen instruments to study the thermal properties of these cheeses.
The TGA tests were conducted using a temperature ramp at 10 °C/min heating rate from room temperature to 1000 °C. The sample atmosphere (purge gas) used was nitrogen using a flow rate of 25 ml/min. A sample size of around 30 mg and a platinum pan were used.
The DSC tests were conducted using a heat-cool-heat procedure, in which the sample was subject to a temperature ramp at 10 °C/min from -60 °C to 70 °C (heating) and 70 °C to -60 °C (cooling). The sample atmosphere used was nitrogen using a flow rate of 50 ml/min. A sample size of around 5 mg and Tzero hermetic pans were used.
All tests were done in duplicate.
Results & Discussion
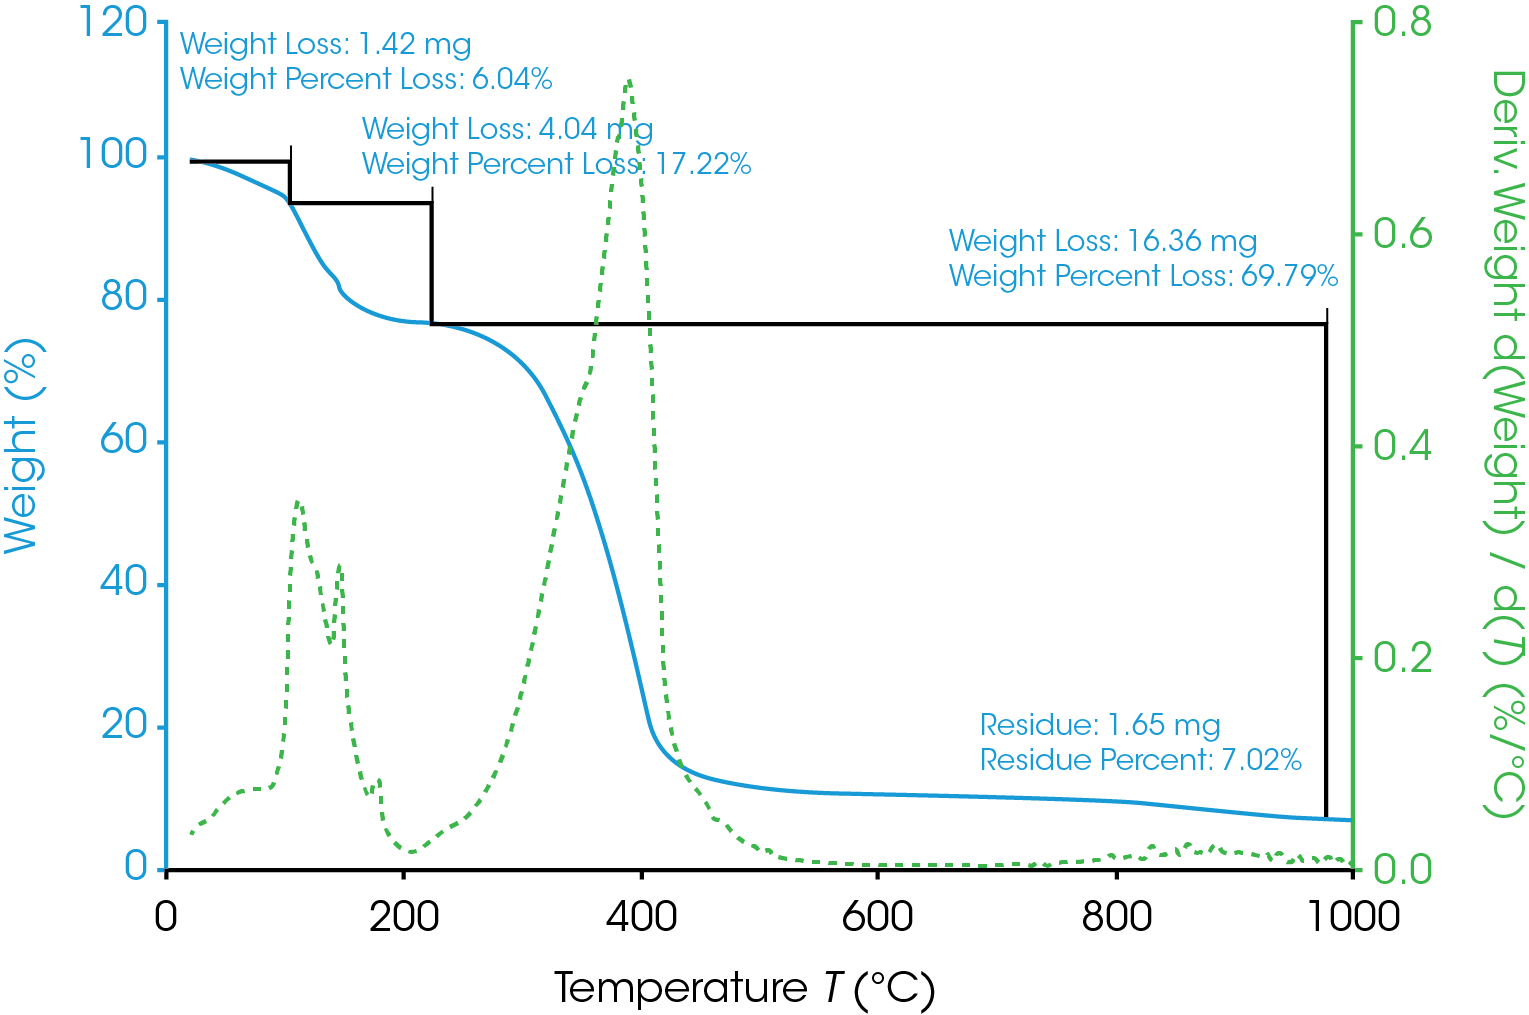
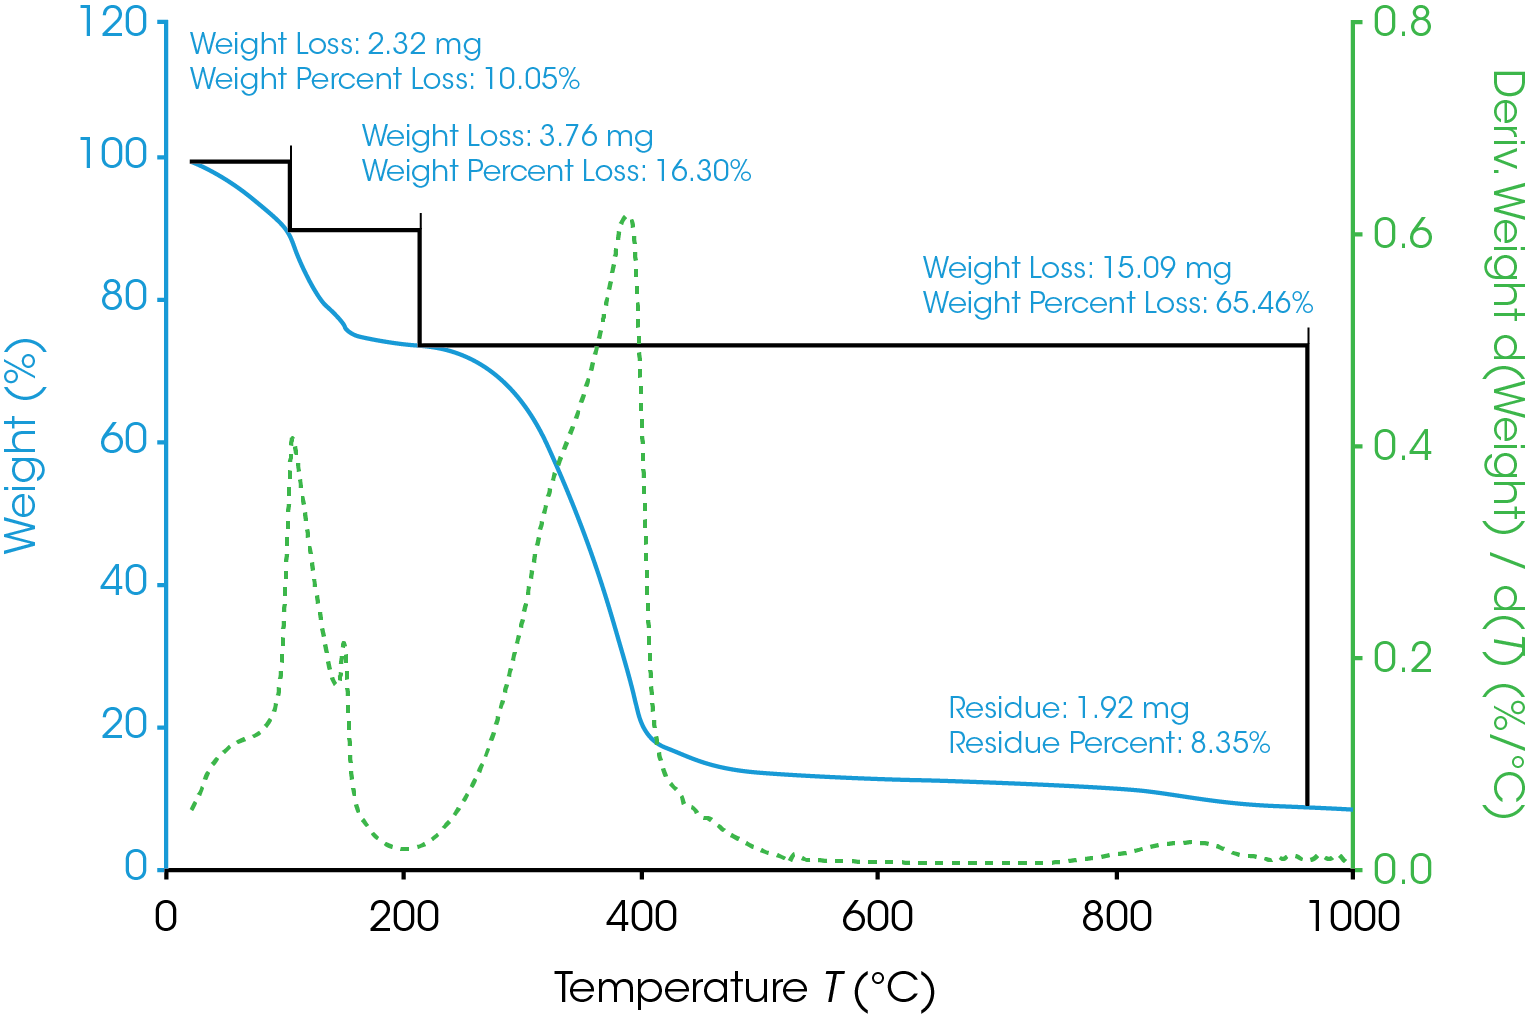
Evaluation of the thermogravimetric curves and their first derivatives shows that over the temperature range of 20 – 200 °C, water loss occurs in two overlapping steps corresponding to a series of interactions between the water and other components present in the matrix [3]. Free and bound water are therefore present, free water is bound with less energy to the matrix and evolves between 30 to 100 °C. Bound water is strongly linked to the matrix and is released over the temperature range of 100 – 200 °C. The decomposition of the anhydrous sample until ash occurs then beyond 200 °C up to 1000 °C (Figure 1 and 2).
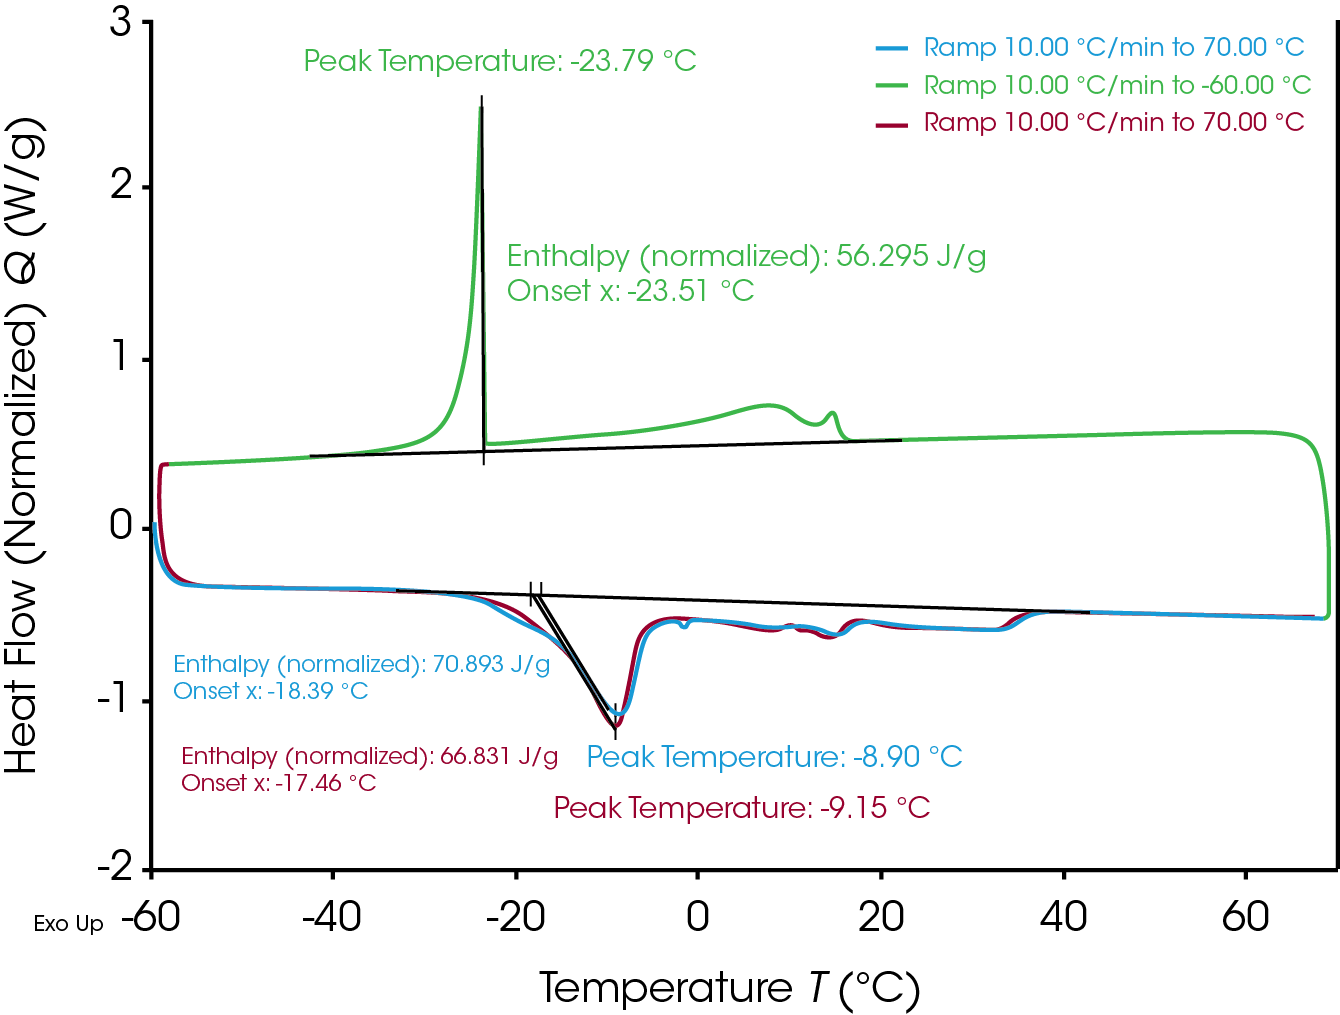
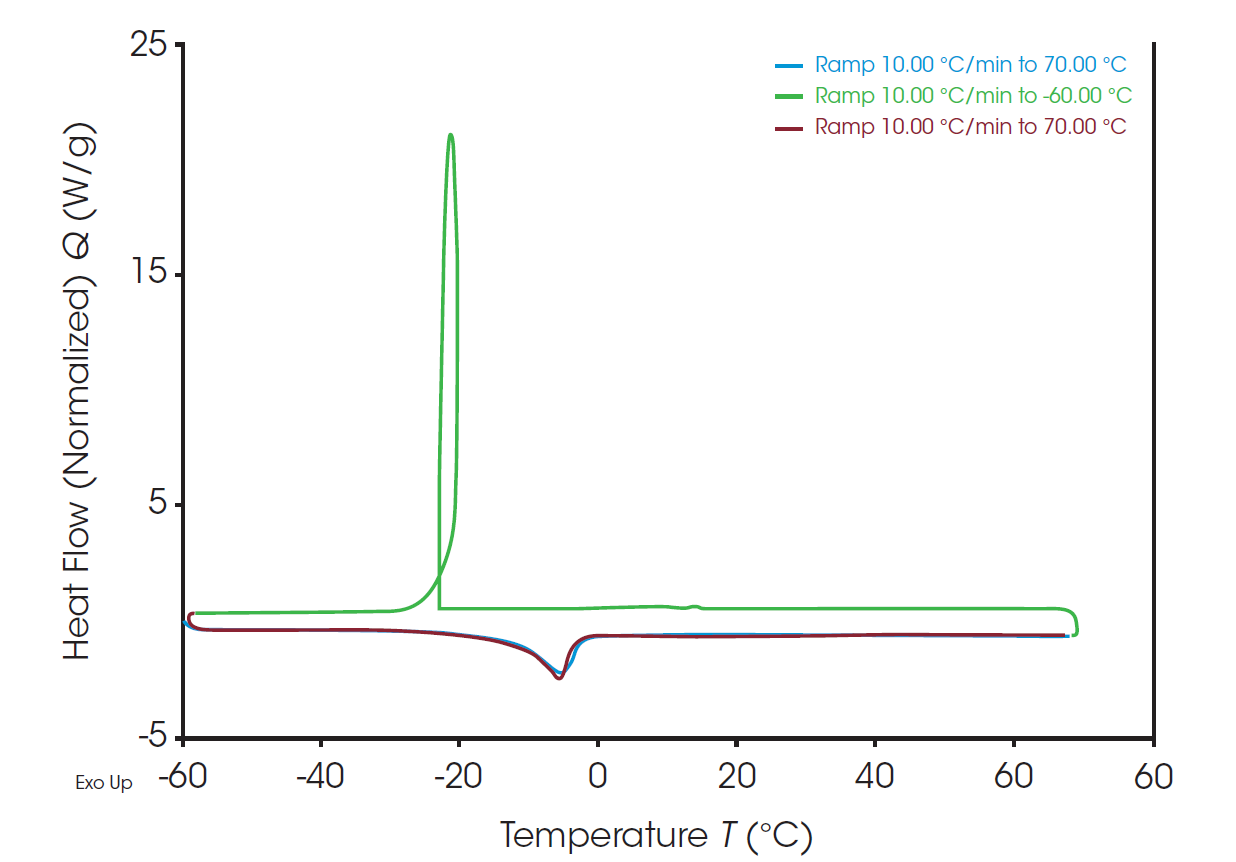
The DSC thermograms for cheddar and mozzarella cheeses are presented in figures 3 and 4 respectively. Cheddar cheese shows an endothermic peak over the temperature range -30 °C to 40 °C that occurs on heating, and an exothermic peak at a temperature range of -40 °C to 20 °C that occurs on cooling. These peaks may correspond to melting and freezing of water and fat. Melting of fat in cheddar cheese can be attributed to the endothermic area between 0 to 50 °C [5].
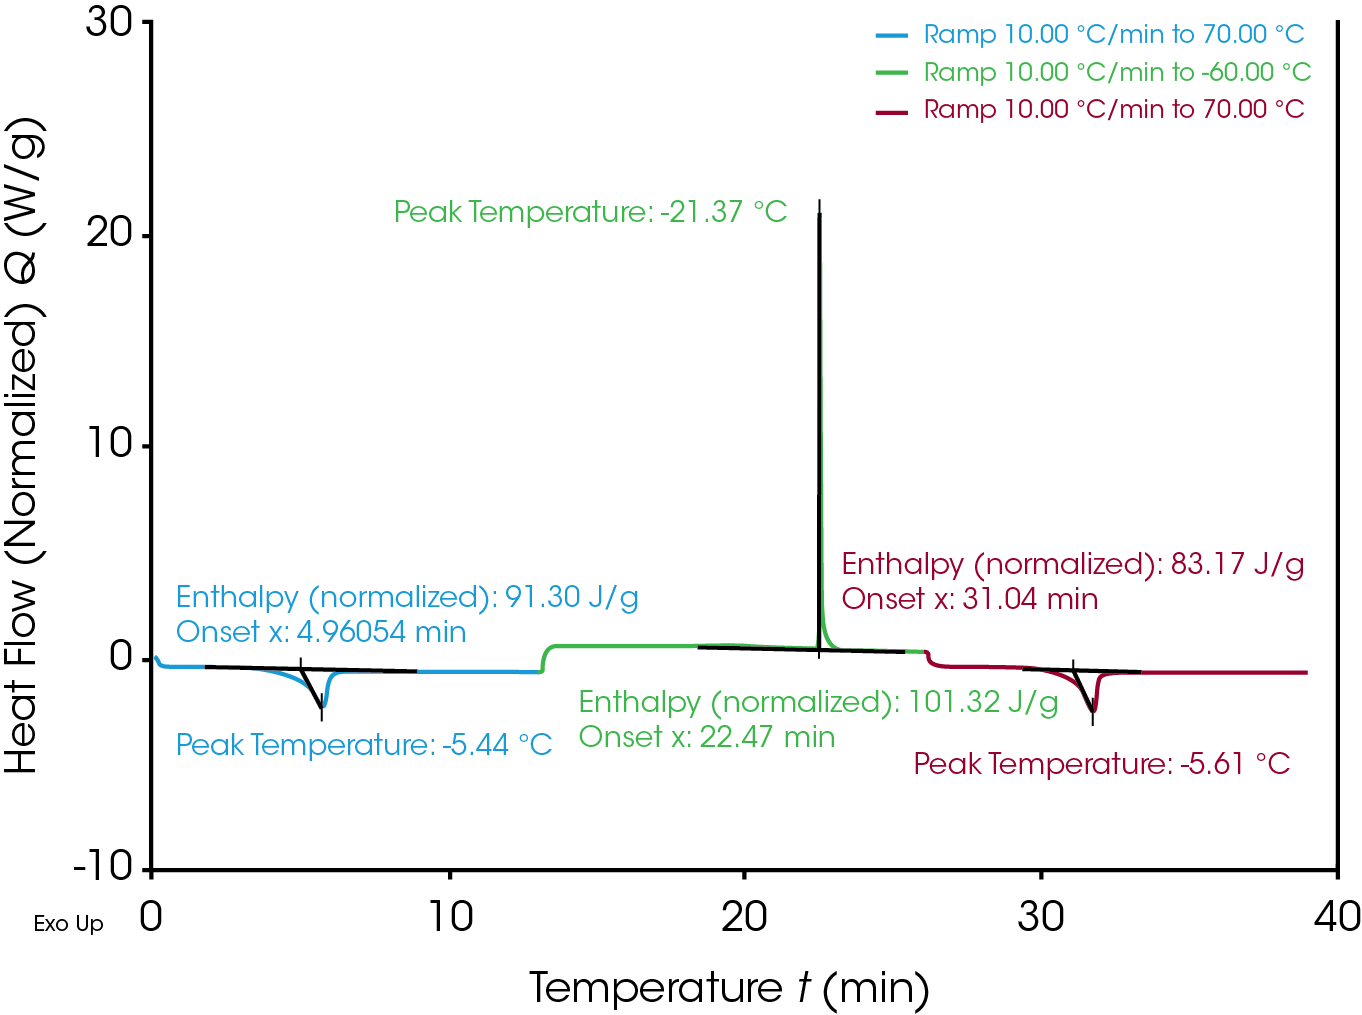
The DSC thermogram for mozzarella cheese showed a self-heating effect on the cooling cycle, which is due to the fast-energetic crystallization of water. The loop observed occurs when the sample generates heat faster than it can be removed, the sample therefore self-heats. Crystallization is an exothermic, kinetic, multi-step process that comprises two major steps, the initial crystal formation known as nucleation and crystal growth [7]. For water, once the nuclei forms, the crystal growth is so fast that the energy cannot be conducted away from the sample to maintain the desired cooling rate. In order to calculate the enthalpy of the crystallization, the thermogram must be plotted vs time instead of vs temperature (Figure 4a).
Conclusions
Thermoanalytical techniques such as TGA and DSC provide detailed information on materials composition and physicochemical structure, and can aid for modeling and defining factors such as optimal temperature for storage conditions, cheese retention of quality and safety. The Tzero technology of TA Instruments DSC’s allows the detection and quantification of fast-energetic processes such as self-heating and self-cooling events in materials.
References
- Fox, P.F.; Guinee, T.P.; Cogan, T.M.; and McSweeney, P.L.H.(2017). Fundamentals of Cheese Science, 2nd edition. Boston, MA, USA: Springer.
- McHugh, T. (2017). How Cheese is processed. Food Technology, 27(2). Retrieved from https://www.ift.org/news-and-publications/food-technology-magazine/issues/2017/february/ columns/processing-how-cheese-is-processed
- De Angelis Curtis, S.; Curini, R.; D’Ascenzo, G.; Sagone, F.; Fachin, S.; and Bocca, A. (1999). Grana Padano cheese: thermoanalytical techniques applied to the study of ripening. Food Chemistry, 66, 375-380.
- Visual dictionary (2019). The classification of cheeses. Retrieved from http://www.ikonet.com/en/visualdictionary/static/us/classification_cheeses
- Le Dean, A.; Mariette, F.; Lucas, T.; & Marin, M. (2001). Assessment of the state of water in reconstituted milk protein dispersions by nuclear magnetic resonance (NMR) and differential scanning calorimetry (DSC). Lebensm.-Wiss. u.-Technol., 34, 299 -305.
- Marschoun, L. T.; Muthukumarappan, K. & Gunasekaran, S.(2001). Thermal properties of cheddar cheese: experimental and modeling. International Journal of Food Properties, 4(3),383- 403.
- Aubuchon, S.R. Interpretation of the Crystallization Peak of Supercooled Liquids Using Tzero® DSC. TA Instruments Technical Paper (TA 344). Cheeses Photo retrieved from https://www.123rf.com/photo_47887732_Grated_cheddar_ and_mozzarella_cheese_in_white_bowl_over_wooden_ background.html
Acknowledgement
This paper was written by Yaritza Sanchez, Applications Support Engineer at TA Instruments.
Click here to download the printable version of this application note.

