Keywords: Isothermal crystallization, polypropylene, kinetics, Avrami, Malkin, Friedman, Activation energy, differential scanning calorimetry, DSC
TA425
Abstract
One of the most common applications of differential scanning calorimetry (DSC) is obtaining crystallization kinetics data for semi-crystalline thermoplastics. In this work, we obtain isothermal crystallization kinetics data for two samples of polypropylene, one containing a chemical nucleator to increase crystallization rate and one non-nucleated control using two common macrokinetic models for isothermal crystallization; Avrami and Malkin.
Introduction
Polypropylene is one of the more important thermoplastics used today in many applications from automotive, food packaging, medical parts, packaging film, carpet fibers, and many others. One important property of thermoplastics is crystallization behavior which is correlated with physical properties as well as processing or cycle time. Differential scanning calorimetry (DSC) is used to evaluate crystallization performance in several ways:
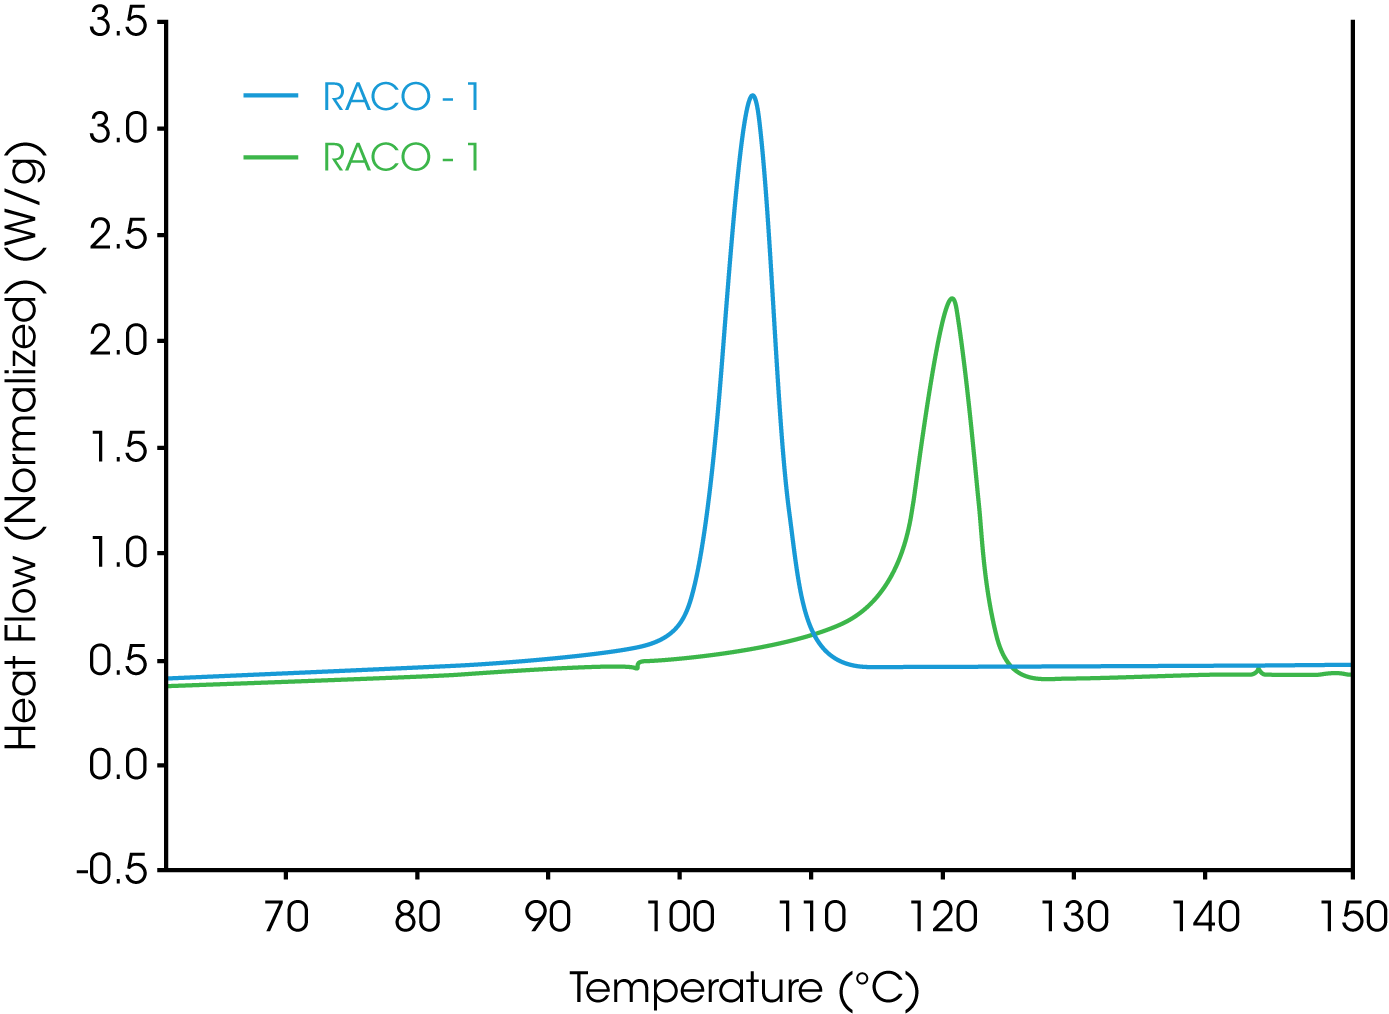
1. Simple evaluation of crystallization temperature – this is accomplished by heating the sample above the equilibrium melting temperature (TM0) [1,5,8], cooling at a steady cooling rate (typically 10 °C / min), and determining the crystallization temperature or onset of crystallization sometimes referred to as the nucleation temperature. Two random propylene ethylene copolymers are compared in Figure 1.
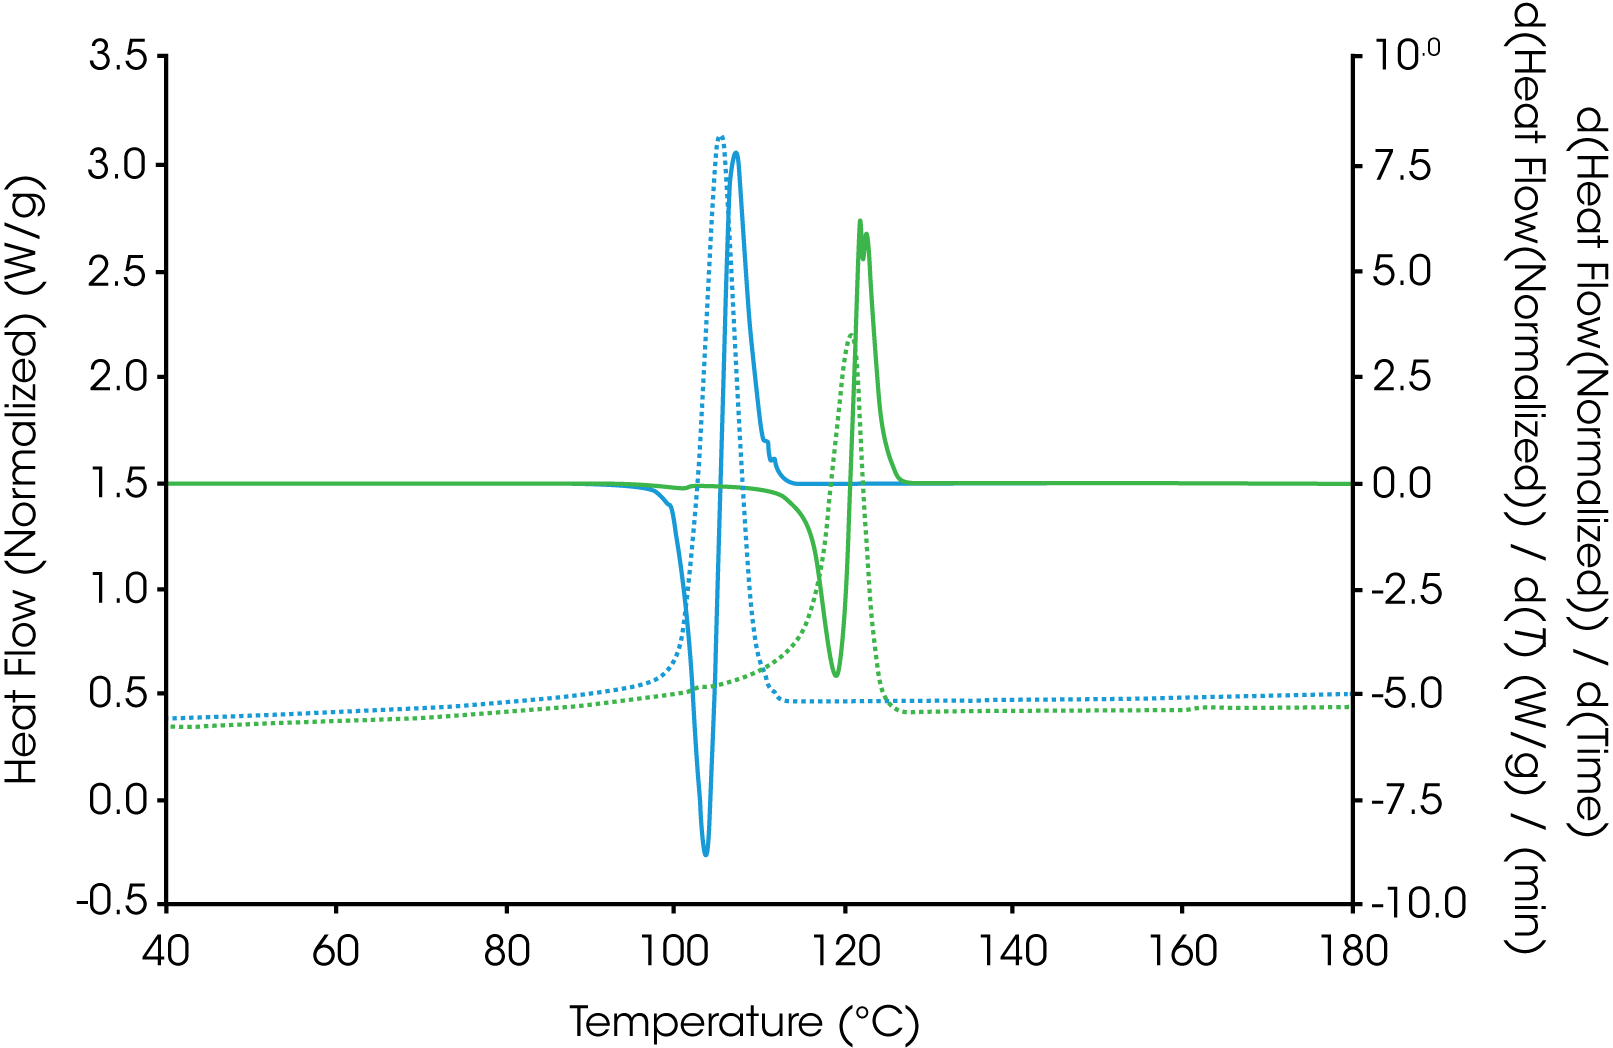
Plotting the derivative (shown in Figure 2) of heat flow with respect to time or temperature of the cooling cycle and comparing the exothermic peak height often will provide a good empirical comparison of the crystallization rate and can serve as an indicator as to whether further kinetic studies should be performed. This is especially useful if the crystallization temperatures of the samples of interest are very close.
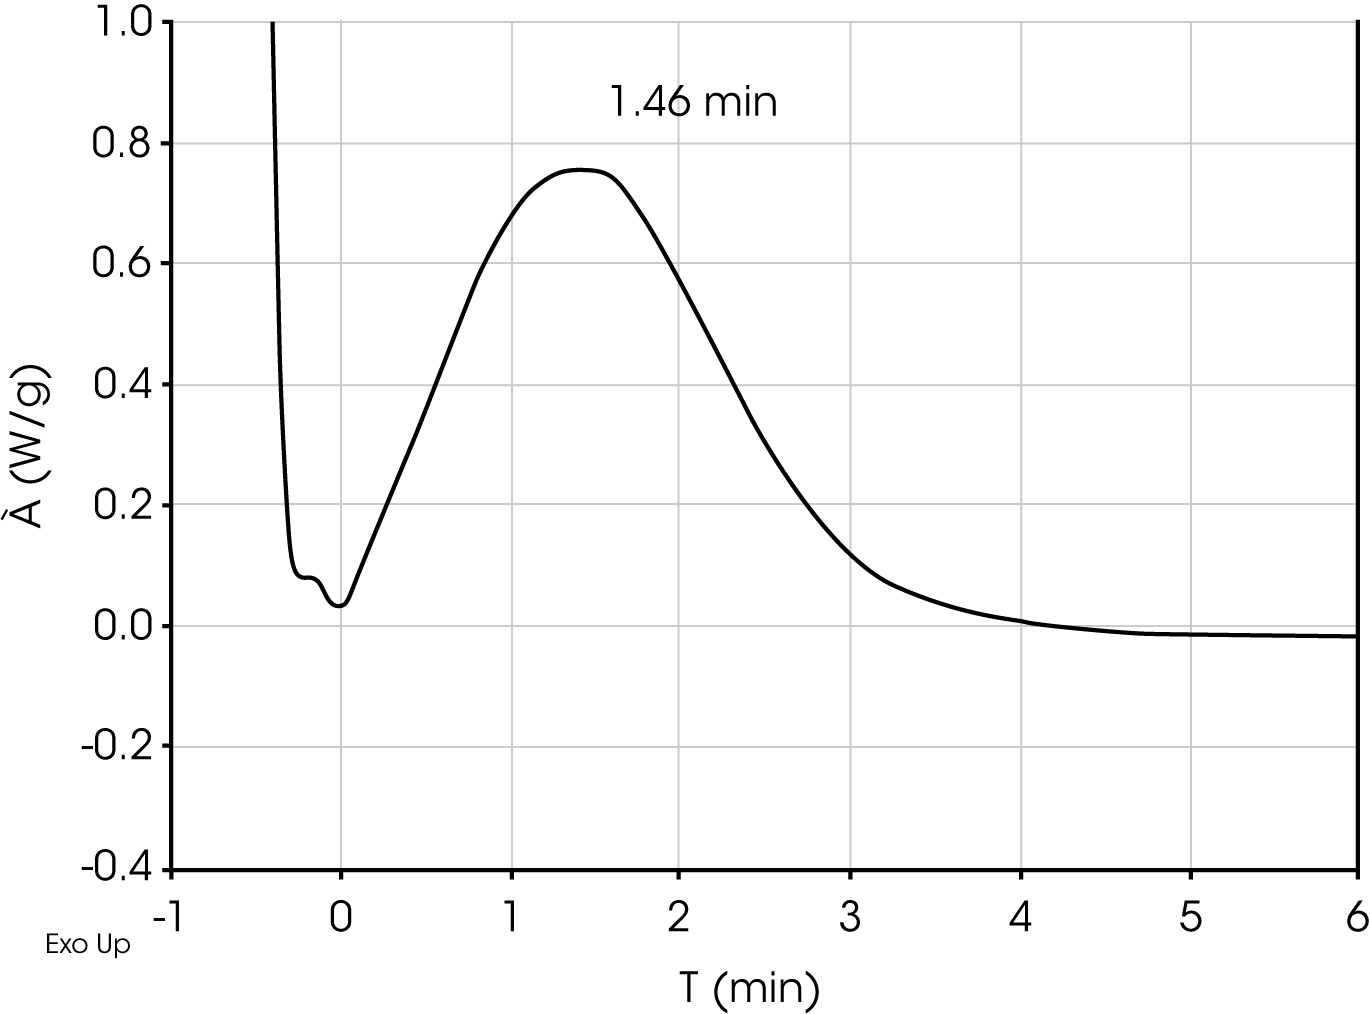
2. Determination of crystallization half-time – this is a single isothermal experiment in which the sample is heated above the equilibrium melting temperature, cooled to a temperature below the melting temperature. The exotherm is plotted as a function of time and the peak is taken as the crystallization half-time (t1/2). An approximation is made that the exotherm is symmetric which is often not true, but it is often adequate for an empirical comparison. Figure 3 shows a typical DSC isothermal crystallization analysis for determining crystallization half-time.
3. Isothermal Crystallization Kinetics – this analysis will yield more complete information regarding crystallization properties including calculation of a crystallization activation energy.
Chemical nucleators are often added to polypropylene to improve processing cycle time and impart desired properties such as clarity and increased modulus. As the plastic cools, homogenous spontaneous nucleation occurs resulting in the growth of complex structures called spherulites. These structures continue to grow and eventually impinge on the growth of neighboring spherulites. A very simplistic explanation for the way nucleators work is that they provide additional surfaces where crystal growth can occur resulting in the reduction of size of the spherulitic structures which in the case of nucleating agents that act as clarifiers, scatter less light [2]. There are many known nucleators for polypropylene including salts such as sodium benzoate, chemicals in the sorbitol class such as Millad 3988 bis (3,4-dimethylbenzylidene sorbitol) which is used in this work, and some inorganic fillers and many others. Some nucleators fall into a subclass called clarifiers which improve optical properties by reducing spherulite size resulting I less haze. For polypropylene, not all nucleators act as clarifiers, but all clarifiers act as nucleators.
The purpose of this work is to demonstrate the use of two of the Avrami and Malkin macrokinetic models to compare crystallization kinetics of polypropylene; one with and one without Millad 3988 using data obtained from a differential scanning calorimeter (DSC). Polypropylene resins containing a chemical nucleator are referred to as ‘nucleated’ using industry terminology.
Background
If the crystallinity at time t and the maximum crystallinity possible at infinite time can be expressed as χt and χ∞ respectively, then the fraction crystallized at any time can be expressed as X(t):

For the DSC experiment, this is determined as the fractional area under the exothermic curve and is expressed in Equation 2:

Where dHC /dt is the heat flow measured by the DSC and ∆HC is the total heat of crystallization.
Crystallization of semi-crystalline polymers can be described as the sequence of two processes: primary and secondary crystallization. Primary crystallization relates to macroscopic development of crystallinity as a result of two consecutive microscopic mechanisms: primary and secondary nucleation (i.e. subsequent crystal growth). Formation of chain folded lamellae progresses through processes of branching and splaying and is generally related to the degree of undercooling (ΔT=TM0 – TC). Primary crystallization is assumed to cease when no additional molecular stems can transport onto a growth face and may be due to the impingement of crystalline aggregates onto one another. Secondary crystallization occurs after cessation of the primary process and may proceed in two ways: (1) crystal perfection of the primary lamellae and (2) crystallization of secondary lamellae from in the interstitial areas of the primary lamellae [3].
The Avrami macrokinetic model (Equation 3) is most commonly used to describe isothermal crystallization kinetics of semi-crystalline polymers.
X(t)=1 – exp(-ka tna ) (3)
where
X(t) = fraction crystallized as a function of tim
ka = Avrami Rate Constant (function of nucleation and crystal growth rate)
na = Avrami Exponent (function of growth geometry) t = time
Rearrangement yields the linear form of the Avrami equation:
log (-ln ( 1- X(t) )=log ka+na logt (4)
A plot of the log (-ln(1-X(t)) versus log t is linear and yields the Avrami parameters ka and na. The linearized form generally fits the data well between the limits of X(t) = 0.1 to X(t) = 0.8. These limits can be modified as needed.
Calculations with The Avrami Equation
Crystallization half time (t1/2 ) can be expressed as:

Where t½ is the crystallization half time, n and k are the Avrami parameters.
Malkin et. al. [6] proposed a macrokinetic equation based on the principal that the overall crystallization rate is a summation of the variation in crystallinity due to the emergence of primary nuclei and the rate of variation in crystallinity due to crystal growth [3].

where
X(t) fraction crystallized as function of time C0 is proportional to the ratio of secondary nucleation(linear growth) rate to the primary nucleation rate orspecifically C0 ∞ G/I in Lauritzen and Hoffman terms C1 is directly related to the overall crystallization rate or C1 = aI + bG where a and b are constants.
Avrami parameters n and k can be calculated from the Malkin parameters C0 and C1 using Equations 7 and 8:
C0=4n-4 (7)

The crystallization activation energy (ΔE) can be determined to quantify the differences between nucleated and non-nucleated samples. This can be done by using the obtained rate data in the generalized Arrhenius equation:
ψTC = ψ0 exp (-ΔE / RT) (9)
Where
ΔE = Crystallization Activation Energy
R = Gas Constant
T = crystallization temperature in K
ψ0= pre exponential
ψTC = k1/n , C1 , 1/t1/2 , or [dX(t) / dt]X(t)
Where
k1/n = Avrami rate constant, n = Avrami geometric exponent
C1 = Malkin Rate Constant
n = Avrami Exponent
t1/2 = crystallization half-time
[dX(t)/dt]X(t) = instantaneous crystallization rate from the DSC data based on Friedman’s method
Experimental
Two polypropylene samples, one with a chemical nucleator / clarifier Millad 3988 [bis (3,4-dimethylbenzylidene sorbitol)] and one control were made by compounding ten pound lots using a single-screw Killion 1.25” extruder. Temperature was 232 °C. Each contained a stabilization formulation consisting of an antioxidant and anti-acid. Concentration of Millad 3988 in the nucleated sample is 0.2 pph.
DSC experiments were carried out on the TA Instruments Discovery DSC using Tzero aluminum sample pans under nitrogen purge. Sample mass was 2 mg nominal and a new sample was prepared for each run.
Data was reduced using the linear form of the Avrami equation (Equation 4) using X(t) ϵ [0.1, 0.8] and using the Avrami and Malkin macrokinetic models by fitting the data to Equations 3 and 9 by means of numerical analysis software and using X(t) ϵ [0.001, 0.999].
Results and Discussion
Figures 4 and 5 show overlays of the crystallization exotherms for the PP Control and Millad 3988 samples.
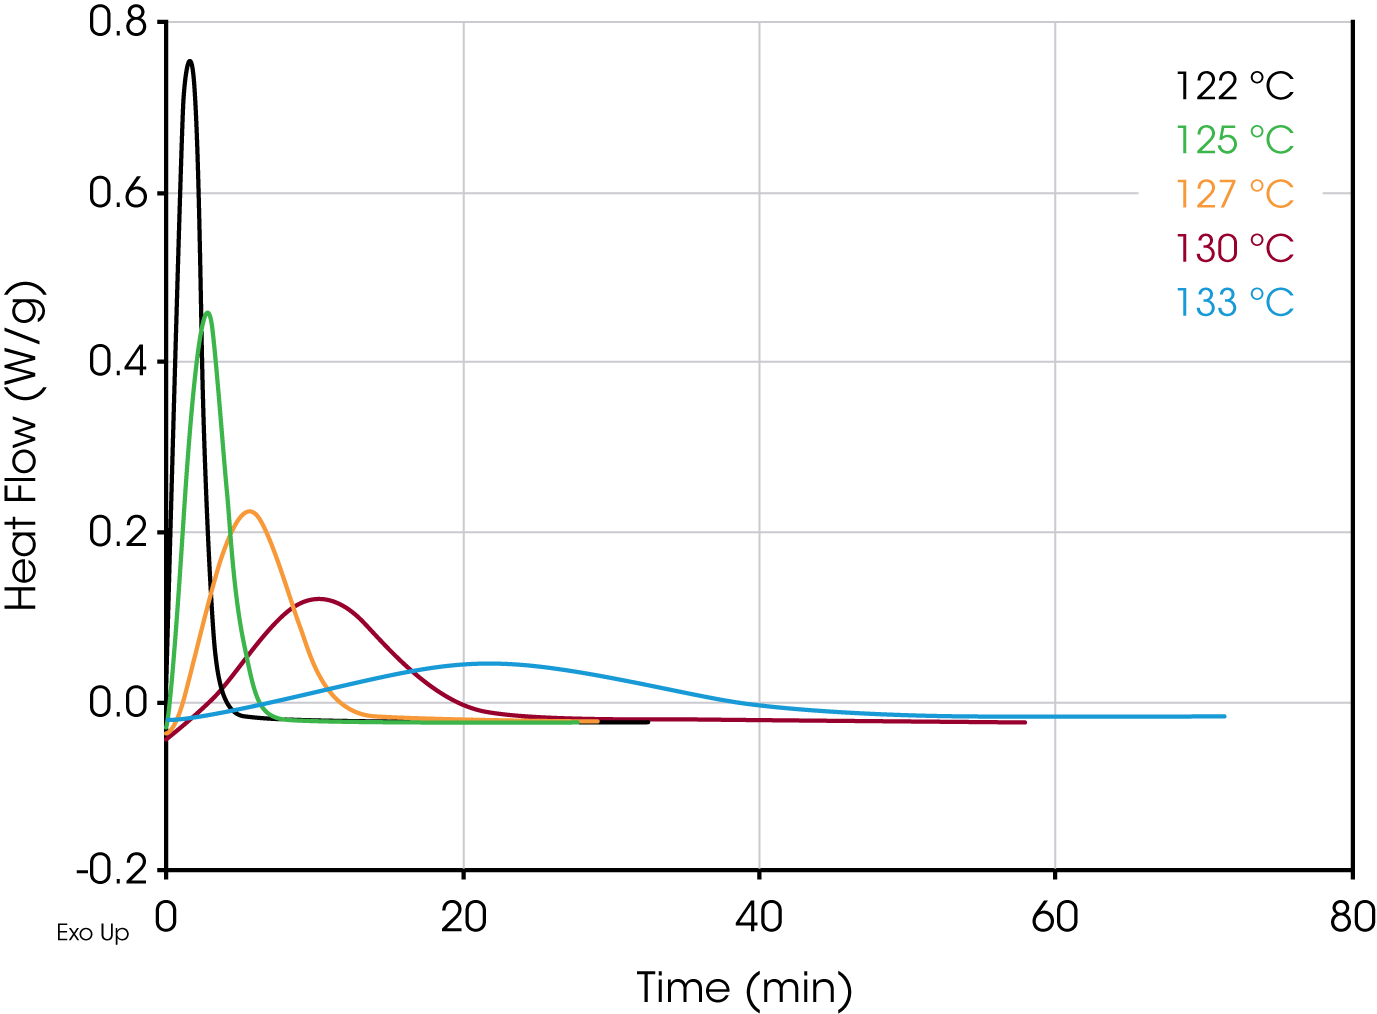
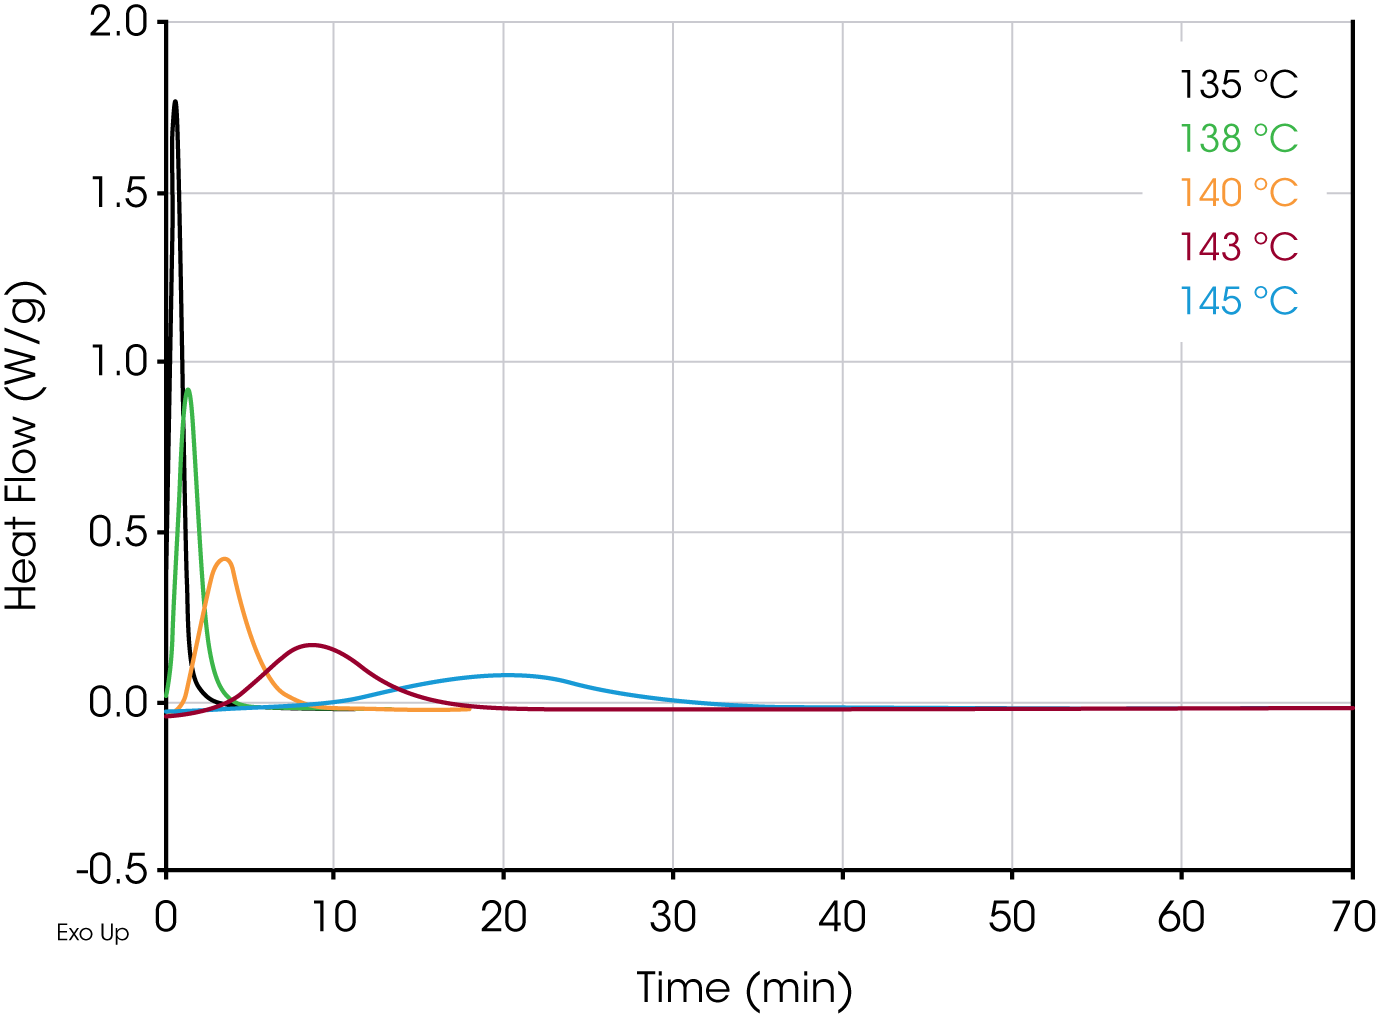
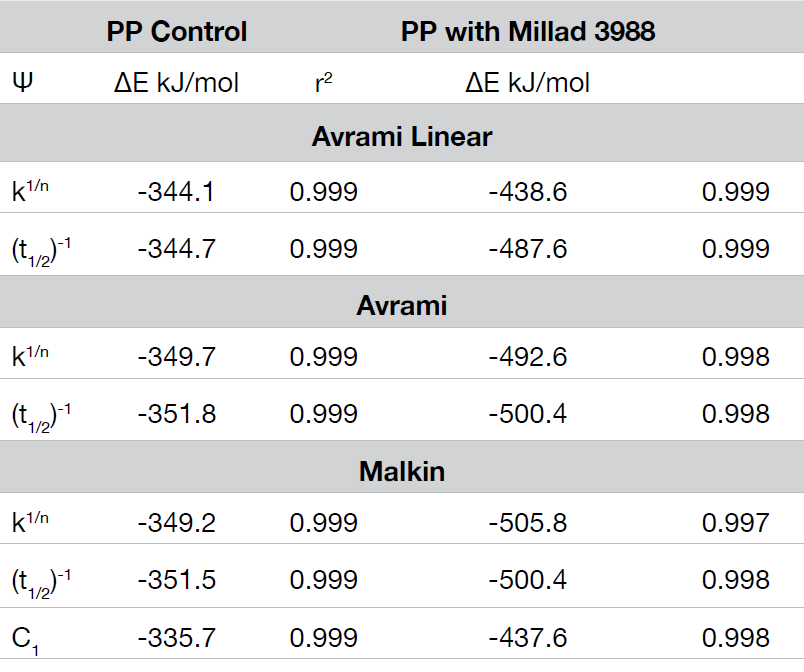
Table 1 shows summary comparisons of the isothermal crystallization data fit using Equation 4 (X(t) ϵ [0.1, 0.8]), and a fit of the data with both Equations 3 and 6 using the numerical analysis program (X(t) ϵ [0.001, 0.999]). The data in each case fit the Avrami and Malkin models well, show good agreement with each other but differ from the Avrami linear fit. Examples of data fits using the models are shown in Figures 6,7, and 8.


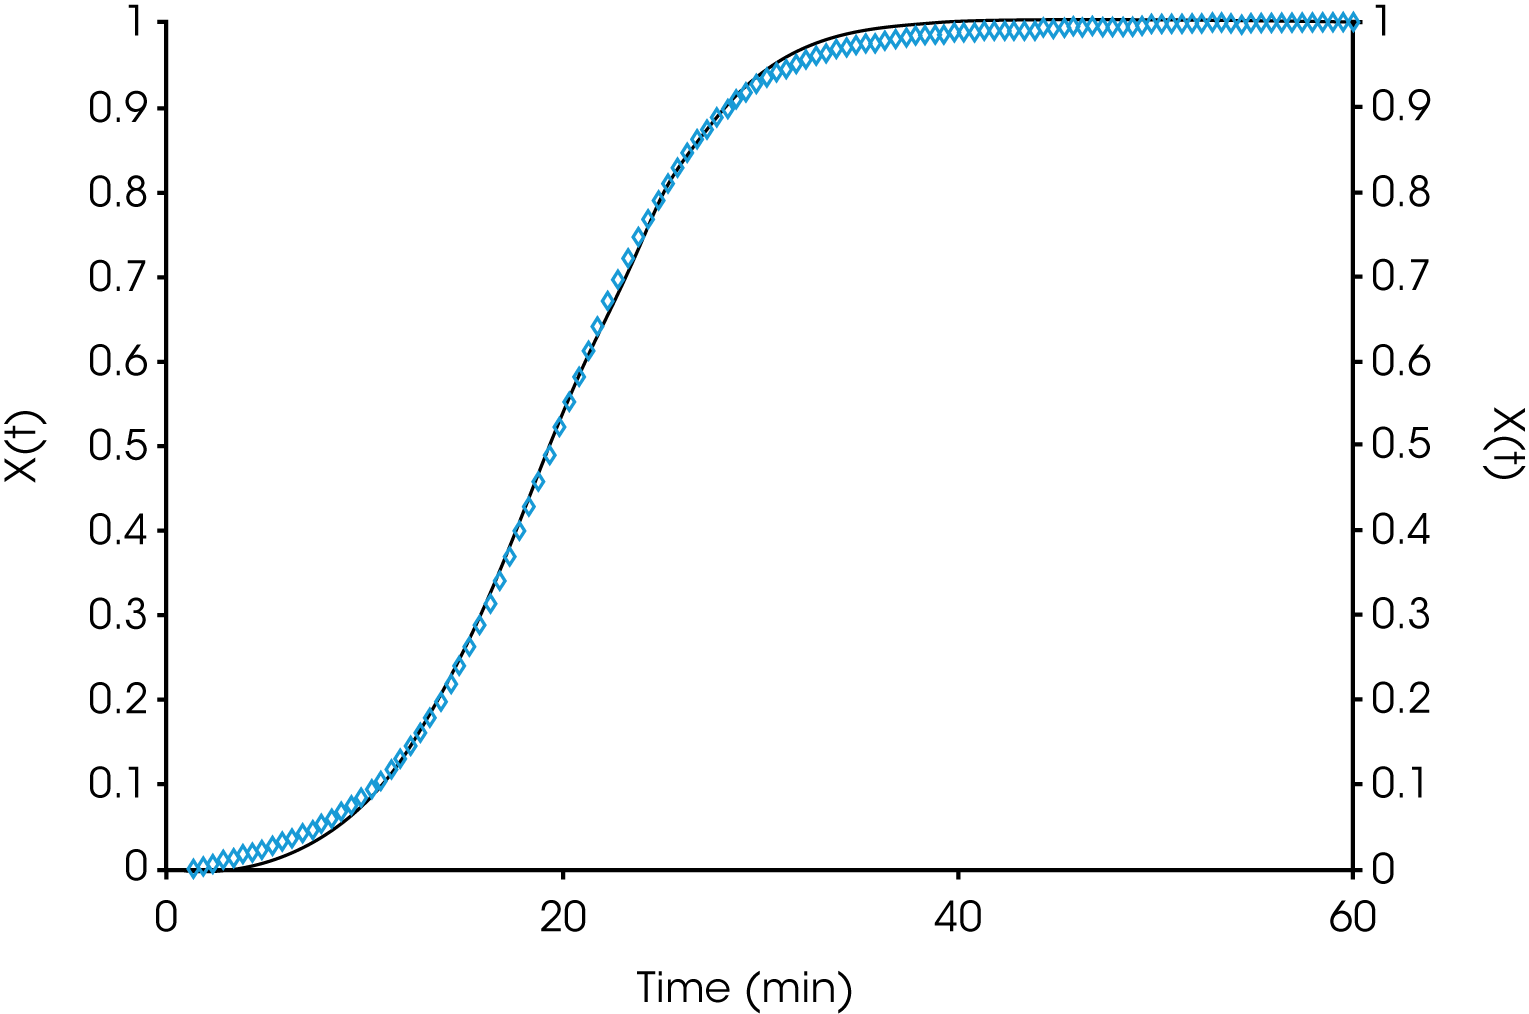
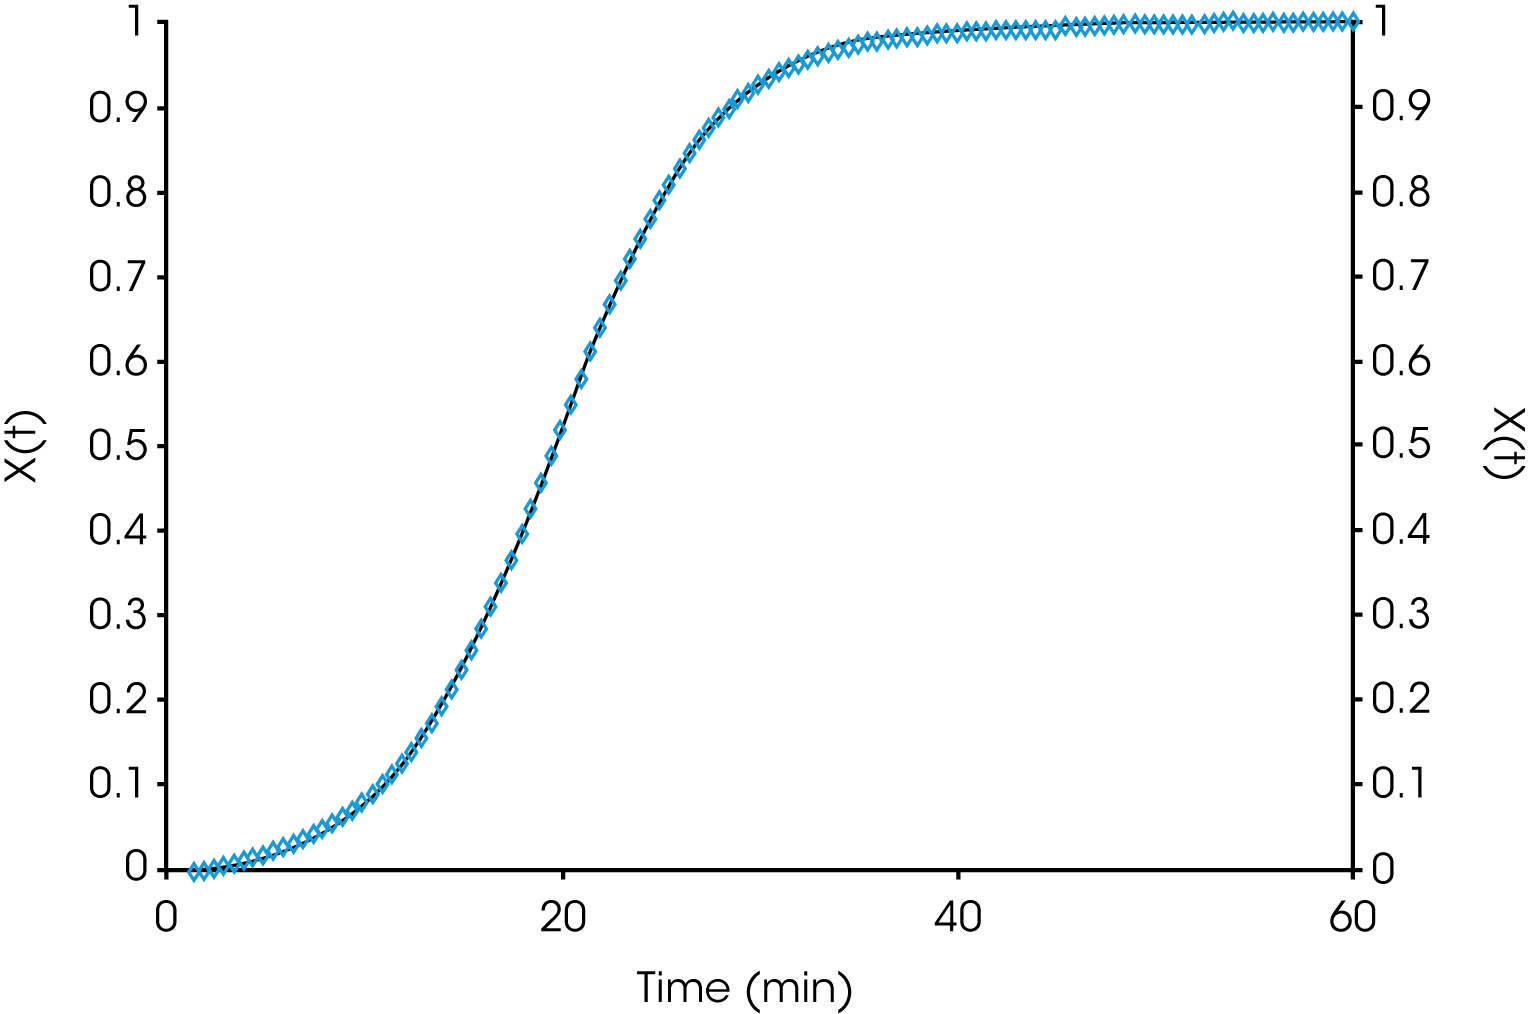
Figure 9 shows the Avrami geometric exponent n as a function of crystallization temperature. In all the numerical fits, n remains constant (2.4 to 2.5) in the control sample while the nucleated sample shows a large variation in the value for n increasing as the degree of undercooling decreases (TC increasing).
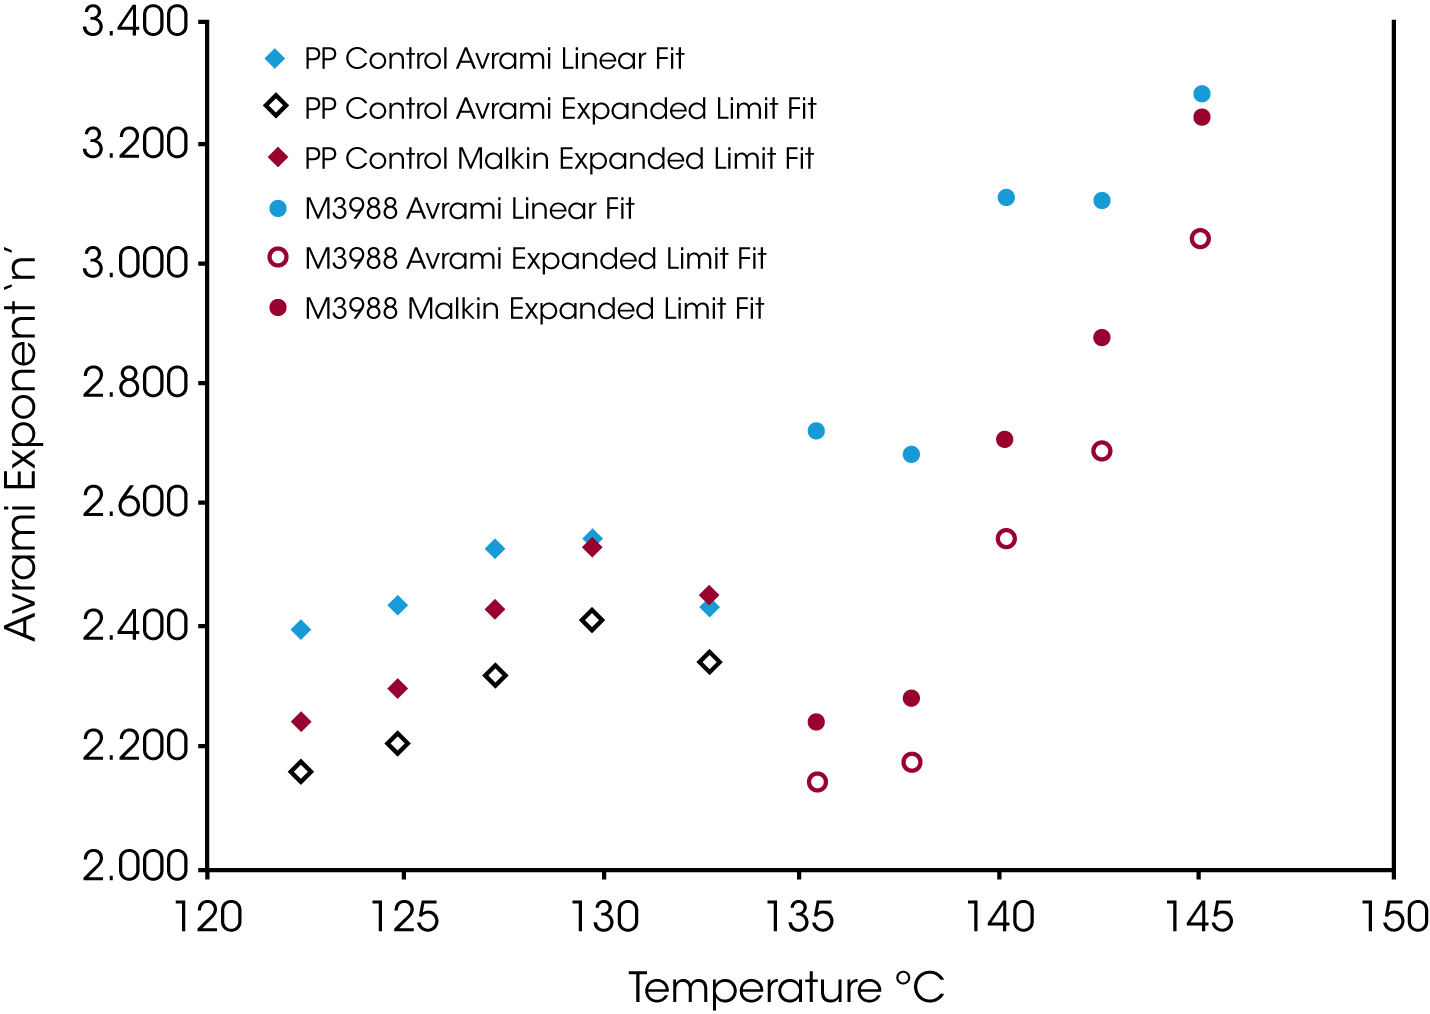
Figure 10 shows a comparison of the Avrami rate constant log k as a function of isothermal crystallization temperature. The results obtained were expected showing the increase in rate constant proportional to the degree of undercooling and the overall relation occurring at a higher temperature in the nucleated sample.
This result is also duplicated in Malkin rate constant C1 shown in Figure 11. The C1 parameter, which describes the overall crystallization rate, remains consistently higher (1.5 to 2x) in the nucleated sample compared to the non-nucleated control.
The crystallization half-time (t1/2) is shown in Figure 13. In addition to the dependence of the degree of undercooling, Equation 5 also demonstrates the dependence of the half-time on nucleation geometry. We have also found half-time data obtained from the fractional area of the exotherm (raw DSC data) differs by approximately 4% from values calculated using Equation 5.
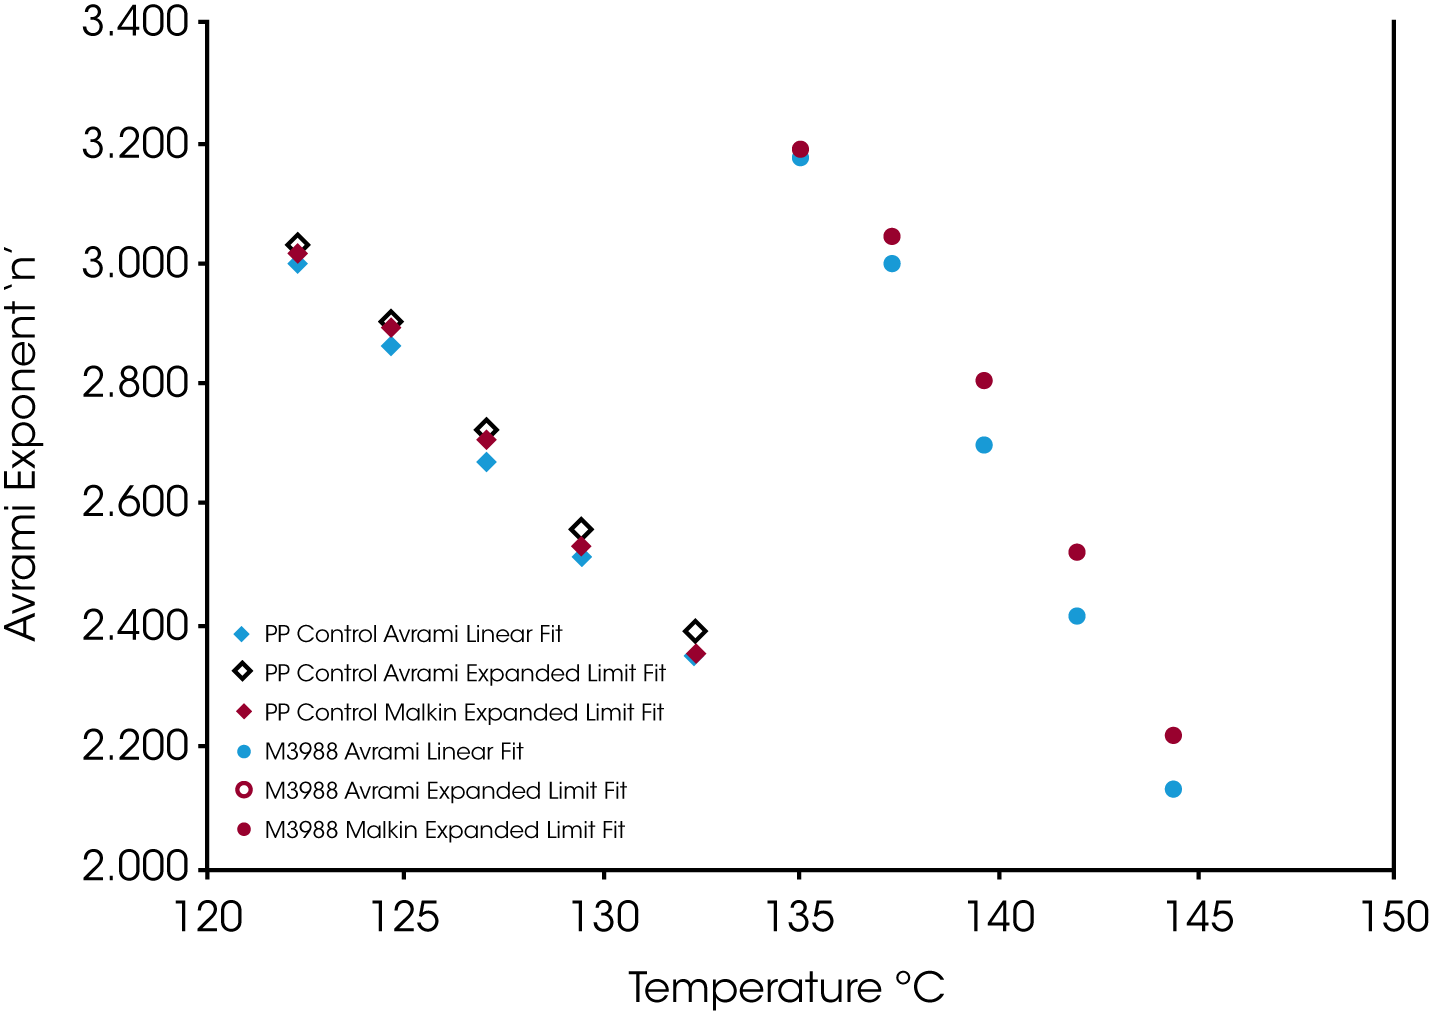

The overall values of n are also consistently higher in the linear fit compared with the expanded limit fits but converge somewhat with a lower degree of undercooling. This is likely due to secondary crystallization processes not considered in the limits of the linear fit. Figure 12 shows the Avrami linear data plotted in the limits of (X(t) ϵ [0.1, 0.99]) for the nucleated sample at TC = 145 °C. This shows the change in slope (n) as secondary processes predominate late in the crystallization process which is why the linear form of the Avrami equation typically fits between (X(t) ϵ [0.1, 0.8]). A simplistic interpretation of the nucleation geometric exponent is that a value of ‘1’ is indicative of linear or rod-like structures, ‘2’ planar, and ‘3’ more spherical. More extensive interpretations are found in many places in the literature.
![TA425_Fig.12 Figure 12. Linearized Avrami Fit - deviation due to secondary crystallization processes [9]. Sample is PP with Millad 3988, TC = 145 °C](https://www.tainstruments.com/wp-content/uploads/TA425_Fig.12.png)
Figure 13 shows a comparison of the crystallization half-time (t1/2) for the sample containing the nucleating agent and the control. Both show the expected decrease in t1/2 directly related to the degree of undercooling and the higher temperature range of the nucleated sample demonstrates the processing advantage of an added nucleator.
Figure 14 shows a comparison of the Malkin constant C0 which is related to the rate of secondary to primary nucleation (Lauritzen Hoffman G/I). At lower degrees of undercooling, secondary nucleation is much higher in the nucleated sample, which also correlates with the Avrami n exponent approaching 3.
The Malkin macrokinetic model also yields the Avrami parameters k and n which show good agreement to those obtained from the Avrami methods.


Crystallization Activation Energy ∆E
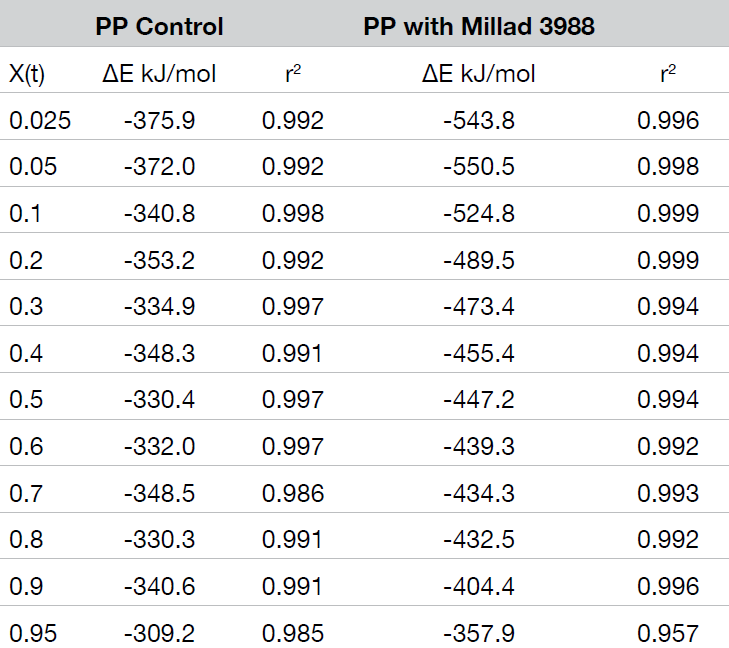
The crystallization activation energy is calculated from the rate data obtained with both macrokinetic models using Equation 9. It can also be calculated from the DSC data using Friedman’s isoconversional approach. This is done by plotting the instantaneous crystallization rate [(dX(t)/dt)Xt] at an arbitrarily chosen extent of conversion versus reciprocal absolute temperature (1/T) also using Equation 9. Activation energies are summarized in Tables 2 and 3; data from the Friedman method is plotted in Figure 15.
All methods show good data fits. As expected, the nucleated sample shows a significant decrease in the crystallization activation energy, and the Friedman method shows ∆E remains consistently lower through most of the conversion range showing some convergence toward the end of the crystallization process.

Conclusions
TA Instruments Discovery DSC series differential calorimeters yield excellent quality data due to the superior baseline stability inherent in Tzero® technology providing an effective and simple tool for differentiating polymers based on crystallization kinetics. Baseline stability is critical in obtaining reliable results from data dependent on extent of conversion.
The Avrami and Malkin macrokinetic models are an excellent means of comparing crystallization kinetics in polypropylene and other thermoplastics. Rate data can be used to calculate activation energies which is a useful quantification tool along in evaluating nucleator performance as well as optimizing formulations.
The Friedman isoconversional method using the instantaneous crystallization rate provides a very useful evaluation of the crystallization activation energy as a function of conversion.
References
- Hoffman, John D., Weeks, James J.; Melting Process and the Equilibrium Melting Temperature of Polychlorotrifluoroethylene; Journal of Research of the National Bureau of Standards-A, Physics and Chemistry Vol. 66A, No, I, January- February 1962
- Sherman, L.M.; New Clarifiers & Nucleators: They Make Polypropylene Run Clearer and Faster; Plastics Technology, #107 July 2002
- Supaphol, P., Spruiell, J.E.; Isothermal melt and cold crystallization kinetics and subsequent melting behavior in syndiotactic polypropylene: A Differential Scanning Calorimetry Study; Polymer 42 (2001) 699–712
- Hargis, M.J., Grady, B.P; Effect of sample size on isothermal crystallization measurements performed in a differential scanning calorimeter: A method to determine Avrami Parameters Without Sample Thickness Effects; Thermochimica Acta 443 (2006) 147–158
- Thanomkiat, P., Phillips, R.A., Supaphol, P.; Influence of Molecular Characteristics on Overall Isothermal Melt-Crystallization Behavior and Equilibrium Melting Temperature of Syndiotactic Polypropylene; European Polymer Journal 40 (2004) 1671–1682
- Malkin, A. YA., Beghishev, V.P., Keapin, I.A., Bolgov, S.A.; General Treatment of Polymer Crystallization Kinetics – Part1. A New Macrokinetic Equation and Its Experimental Validation; Polymer Engineering and Science, December 1984, Vol 24, No. 18
- Supaphol, P., Spruiell, J.E.; Thermal Properties and Isothermal Crystallization of Syndiotactic Polypropylenes: Differential Scanning Calorimetry and Overall Crystallization Kinetics; Journal of Applied Polymer Science, Vol. 75, 44–59 (2000)
- Assessing the Effects of Process Temperature on Crystallization Kinetics of Polyphenylene Sulfide Utilizing Differential Scanning Calorimetry (DSC); TA Instruments Applications Note Number 395
- Hargis, M.J., Grady, B.P., Effect of Sample Size on Isothermal Crystallization Measurements Performed in a Differential Scanning Calorimeter: A method to Determine Avrami Parameters Without Sample Thickness Effects; Thermochimica Acta 443 (2006) 147-158
- Vyazovkin, S, Wight, C.; Isothermal and Non-Isothermal Kinetics of Thermally Stimulated Reactions of Solids; International Reviews in Physical Chemistry, 1998, Vol. 17, No.3, 407-433
Acknowledgement
This note was written by James Browne, Sr. Application Support Engineer at TA Instruments | Waters .
Click here to download the printable version of this application note.

