Keywords: Modulated differential scanning calorimetry, MDSC™, DSC, pharmaceuticals, freeze drying, amorphous, crystalline, hydrates, solvates
TA486
Abstract
This paper describes the technical challenges confronting the analyst attempting to characterize pharmaceutical materials by standard DSC and shows how they are overcome by the use of Modulated DSC™.
Introduction
Thermal characterization of pharmaceutical materials is typically much more difficult than characterization of polymers due to some or all of the following factors:
- Crystalline materials often exist in multiple crystal forms (polymorphs) that have different physical, chemical and biological properties.
- A crystalline form of the drug can undergo solid-solid and liquid-solid structure changes as the sample is heated. These structural changes can be endothermic as well as exothermic.
- Not all crystalline drugs melt; crystalline structure is also lost due to desolvation, dehydration, and decomposition.
- Amorphous drugs are easily plasticized by water or solvents. The glass transition can shift by as much as 100 °C.
- The active pharmaceutical ingredient (API) is often present at a concentration of ten percent (10 %) or less and there can be multiple other ingredients (excipients) that make detection of the API difficult.
DSC users in the pharmaceutical industry have worked with these limitations since the commercialization of the technique in the early 1960s. With introduction of MDSC™ in 1992, many analysts believed that the benefits of MDSC would solve all of their DSC concerns. Although MDSC has provided solutions to many of these problems, it has had little utility in the characterization of polymorphs for the following reasons:
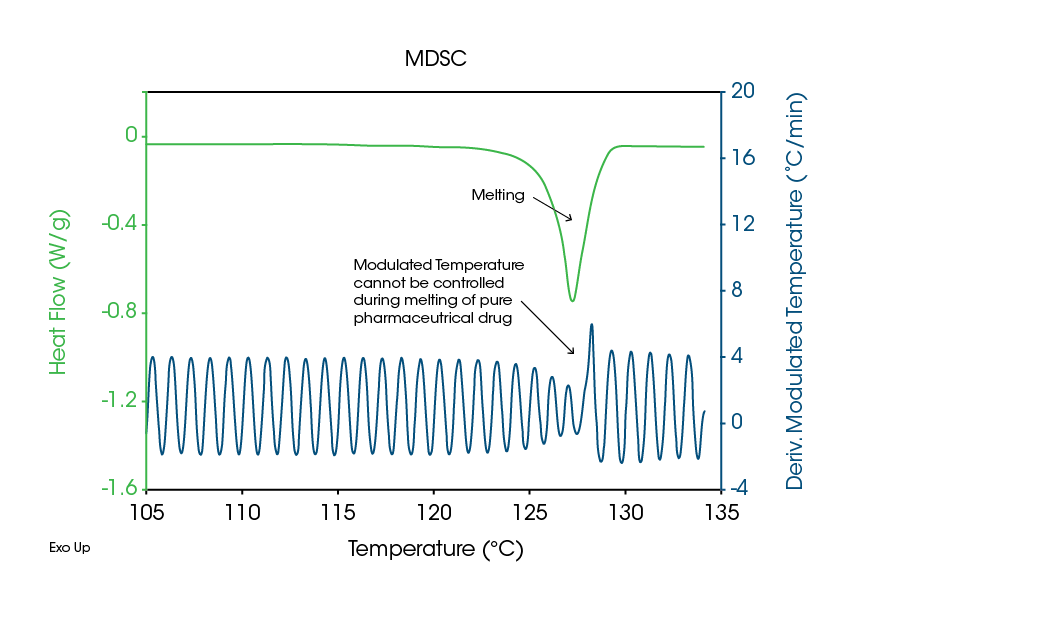
- It is not possible to modulate the temperature of a material that melts over a narrow temperature range. Polymorphs typically are pure molecules that melt over just a few degrees and it is thermodynamically impossible to modulate their temperature during the melting process. This is easily seen by plotting the time-based derivative of the modulated temperature (Figure 1).
- It is not possible to obtain the recommended 4-5 temperature modulation cycles over the width of the melting peak at halfheight. As discussed in an earlier MDSC paper in this series (1), 4-5 cycles, or more, are recommended in order to obtain a good separation of the Total heat flow into the Reversing and Nonreversing signals. Figure 1 shows that one to one and one-half cycles are obtained even at the low heating rate of 1 °C/min. on the sample of Tolbutamide.
- The most important reason for not using MDSC to measure the crystalline structure of polymorphic materials is that low heating rates are required. This significantly raises the probability that the sample will change in structure during heating, thus reducing the ability to measure the initial structure.
Despite these limitations, DSC and MDSC provide the pharmaceutical user with the analytical tools needed to measure the structure of both crystalline and amorphous materials. DSC with multiple heating rates is the best approach for characterization of polymorphs. Applications where MDSC is the technique of choice include:
- Measurement of the glass transition (Tg’) in frozen solutions used for freeze-drying
- Detection and measurement of glass transitions in drug delivery systems
- Separation of overlapping transitions and/or processes
- Characterization of hydrates and solvates
- Interpretation of complex transitions
Measurement of the Glass Transition (Tg’) in Frozen Solutions
Selection of the optimum primary and secondary drying temperatures for the freeze-drying process requires an understanding of the physical characteristics of the components used in the formulation that is to be freeze-dried. In decreasing order of mass, these are typically water, bulking agents, buffers or stabilizers and finally the drug itself. The bulking agent, which can be either crystalline or amorphous (not crystalline), and its interaction with the unfrozen water and ice in the frozen solution, define the physical structure that is essential to successful freeze-drying. This structure manifests itself in the form of transitions that occur at specific temperatures. Physical properties of the bulking agent such as modulus or viscosity can change by orders of magnitude depending on whether the process temperature is a few degrees above or below the transition temperature. Therefore, knowledge of this structure and the temperature where it changes is required for successful drying.
For many materials, it is relatively easy to measure crystalline or amorphous structure and to determine transition temperatures with Differential Scanning Calorimetry (DSC). However, DSC has been used with only modest success on frozen solutions used for freeze-drying because multiple transitions can occur at the same temperature, and DSC can only measure the sum of them. This problem is clearly seen in the Total signal of Figure 2, which is equivalent to that obtained by standard DSC. The sample is a 40 % solution (W/W) of sucrose in water.
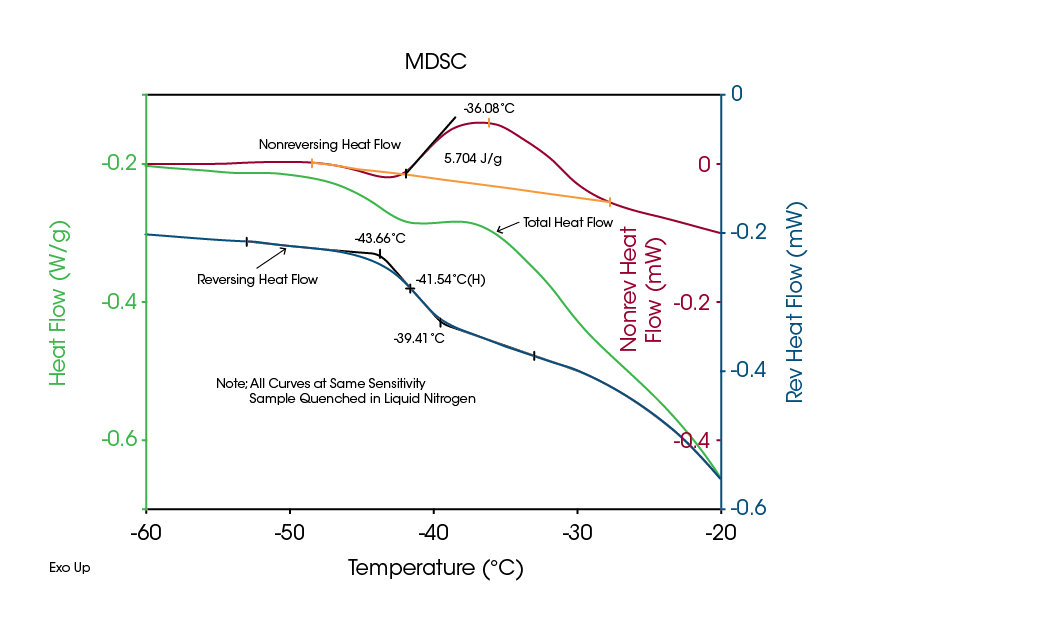
Although it is nearly impossible to identify the glass transition in the Total signal of Figure 2, the MDSC Reversing signal shows a clear and easy to measure Tg’ (a term used in the pharmaceutical industry to denote the glass transition of a frozen solution). There are two transitions seen in the Nonreversing signal, which is the kinetic or time-dependent signal. A slight enthalpic recovery peak, as discussed in a previous MDSC paper (2), is seen at the start of the glass transition and is followed by the larger, exothermic peak associated with crystallization of unfrozen water in the sample. Since the Total signal is the sum of these two transitions plus the change in heat flow due to the glass transition, it is not possible to measure the Tg’.
A secondary advantage of MDSC is its high sensitivity even at very low heating rates such as the 0.5 °C/min used to generate the results in Figure 2. Low heating rates reduce thermal lag and the temperature gradient across the sample. This, in turn, improves temperature accuracy, which is critical to the freeze-drying process.
Measurement of the Glass Transition (Tg) in Drug Delivery Systems
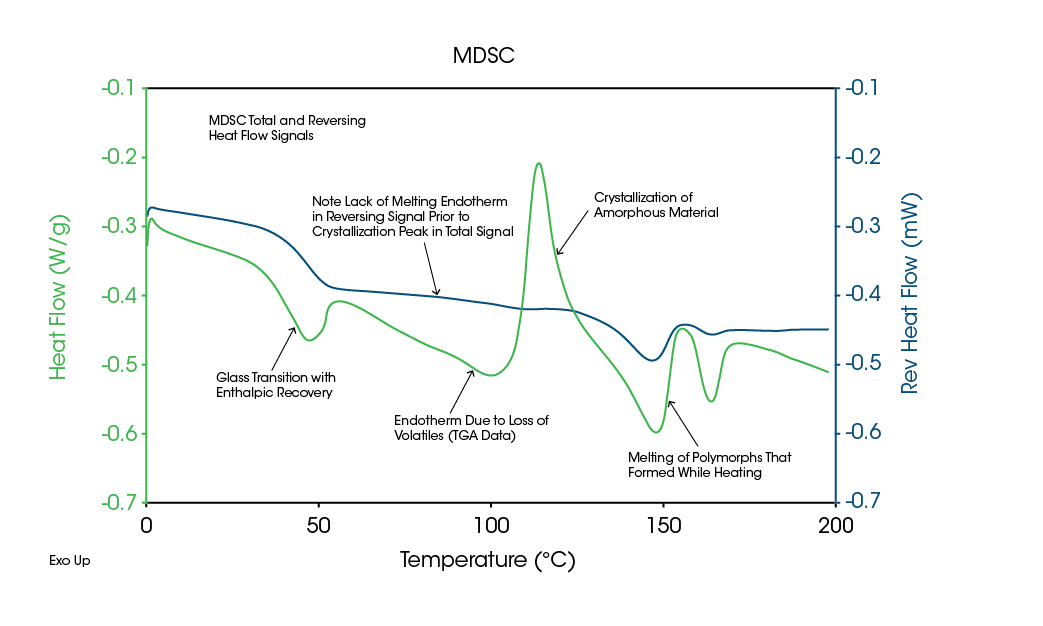
Drug delivery systems typically contain numerous ingredients and each one has transitions associated with its amorphous or crystalline structure. This usually results in transitions that overlap in temperature and make it difficult to measure the Tg of the active ingredient. This problem is clearly seen in the Total signal of Figure 3, which is MDSC data on an amorphous drug dispersed in polymer microspheres. As before, it is not possible to measure Tg from the Total (DSC like) signal but it can be easily analyzed in the Reversing signal. Since there is only one Tg, and the polymer is also known to be amorphous, the amorphous drug must be miscible / soluble in the polymer matrix.
Separation of Overlapping Transitions and Processes
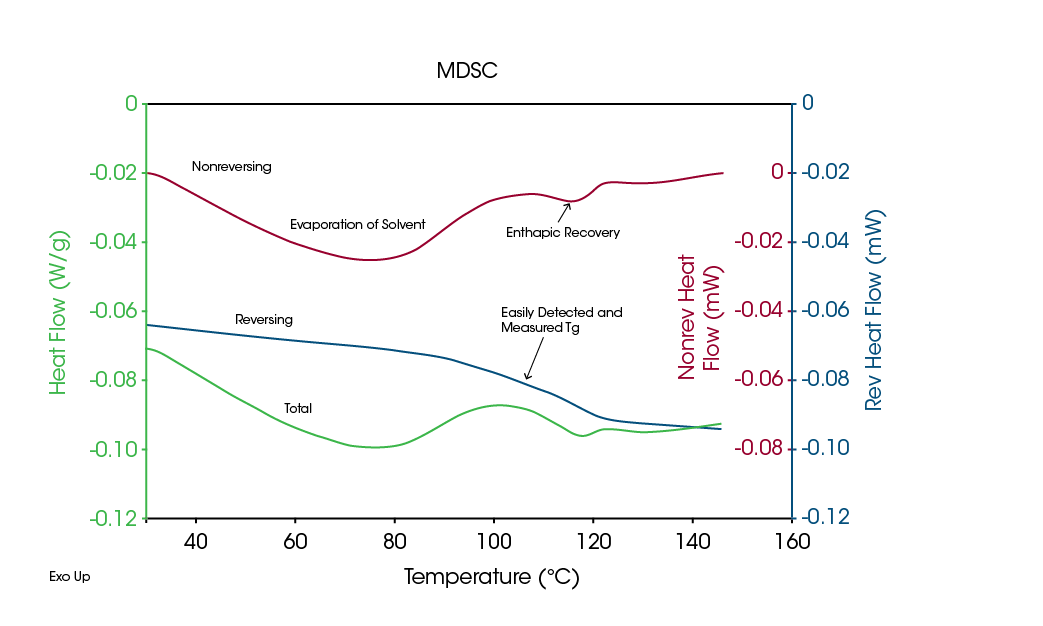
The ability of MDSC to separate overlapping transitions can be seen in the above Figures 2 and 3. A common process that often overlaps transitions in pharmaceutical materials is that of evaporation. This occurs when the sample is heated in a crimped pan (non-hermetic) and the sample contains a volatile component such as water or solvent. Since evaporation is highly energetic, concentrations of even one percent (1 %) of volatiles can easily hide other transitions as seen in the Total signal of Figure 4, an MDSC analysis of an amorphous drug containing absorbed water.
Characterization of Hydrates and Solvates
The superior capability of MDSC to characterize hydrates and solvates is due to its ability to measure heat capacity (Reversing signal) during kinetic processes. When dehydration / desolvation occur, there are two simultaneous changes in heat capacity. The first is the result of the loss of water or solvent due to evaporation. When this occurs, there is typically a 1-5 % decrease in sample mass, which in turn commonly results in a 5-10 % decrease in heat capacity. The second change in heat capacity is the result of the conversion from crystalline to amorphous structure upon dehydration / desolvation. Since the heat capacity of amorphous structure is approximately 30-40 % higher than that of the crystalline structure, there is typically an increase in heat capacity when dehydration / desolvation occurs. Since evaporation of unbound water always results in a decrease in heat capacity, MDSC can distinguish between an endothermic evaporation peak due to unbound versus bound water / solvent. Figure 5 shows thermogravimetric (TGA) results on a drug that is a 5 % hydrate, while Figure 6 shows MDSC results on the same drug. The TGA data shows a single 5 % weight loss between 50 and 100 °C, while the Total signal of the MDSC results displays an endothermic evaporation peak over the same temperature range.
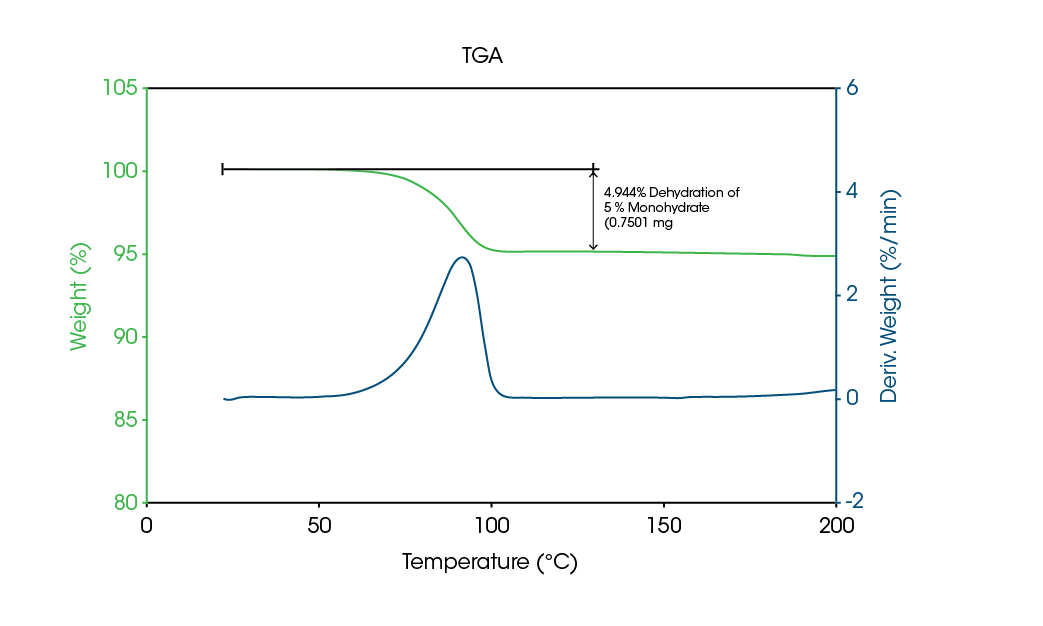
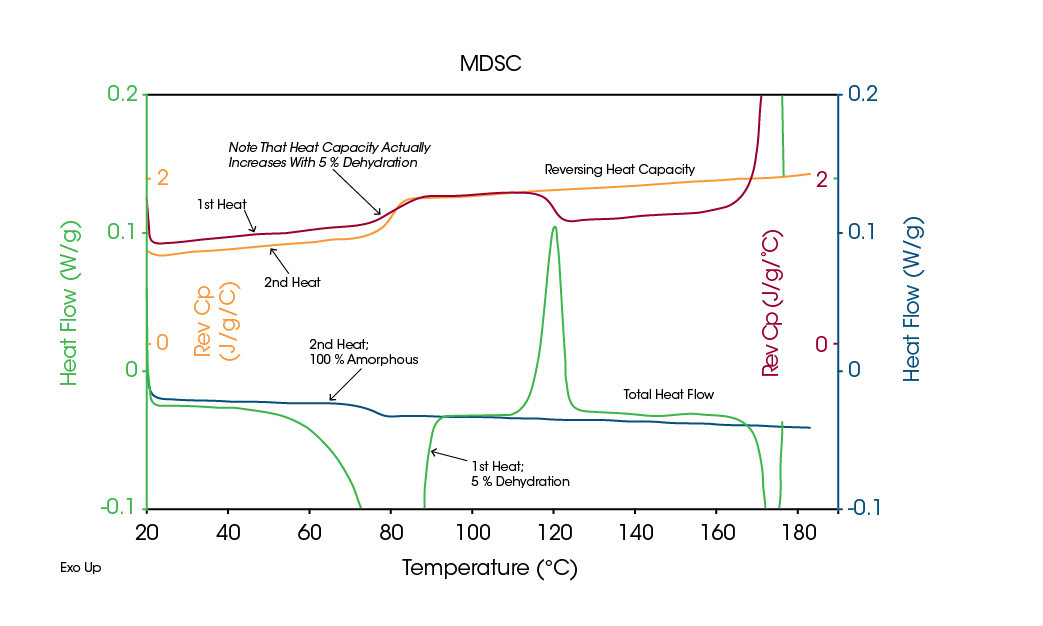
More interesting data comes from the Reversing heat capacity (Cp) signals in Figure 6. When the sample was first heated over the indicated temperature range, the Cp increased during the endothermic evaporation peak in the Total signal. This implies conversion from a crystalline an amorphous structure upon dehydration. Since the former is less stable than the latter, it crystallizes when heated above 100 °C. This appears as an exothermic peak in the Total signal and a drop in the sample’s heat capacity (Reversing Cp signal). On cooling from above the melt, the material remains amorphous and only a Tg is seen in the Total and Reversing signals for the second heat.
Interpretation of Complex Transitions
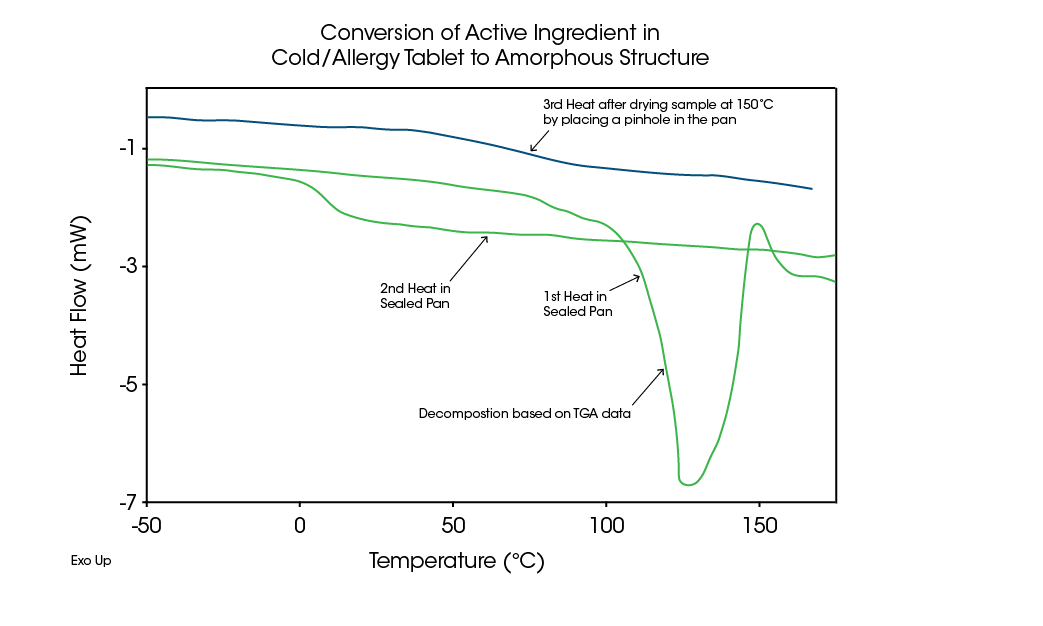
As previously mentioned, it can be difficult to determine the type of transition seen in DSC data. For example, an endothermic peak can be due to evaporation, dehydration, decomposition, denaturation, and melting. Figure 7 shows an endothermic peak just above 100 °C for a crystalline drug salt, which could easily be interpreted as a melt since the second heat shows just a Tg at about 10 °C. Clearly, crystalline material has been converted to an amorphous structure during the first heat.
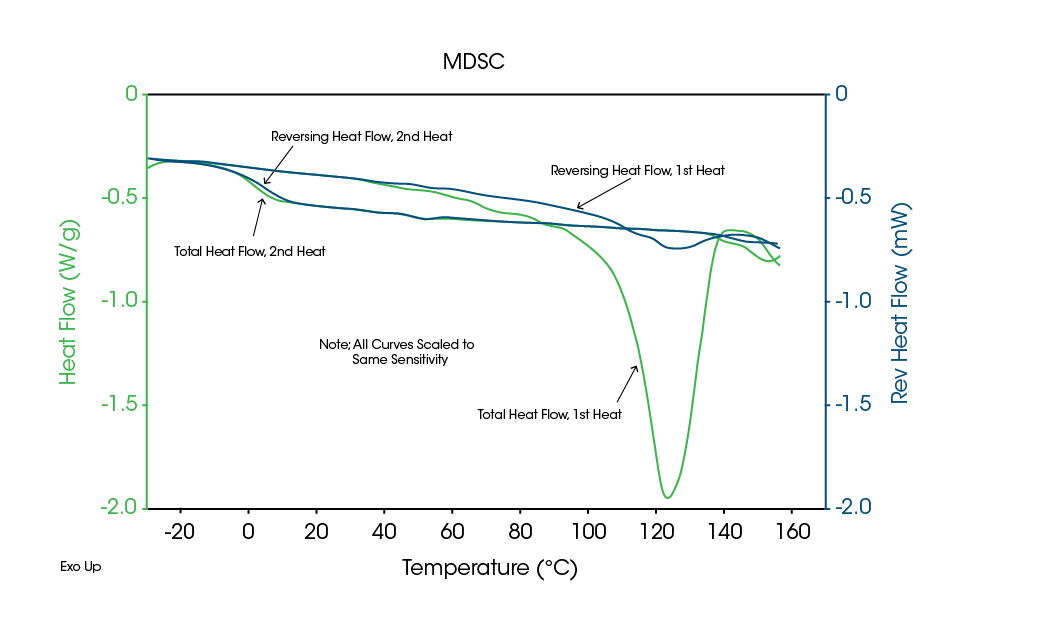
Figure 8 shows MDSC data on this material. The Total signal indicates an endothermic peak just above 100 °C, exactly as in the DSC data. However, the Reversing signal shows primarily an endothermic step at this temperature, indicating that the transition is not due to melting.
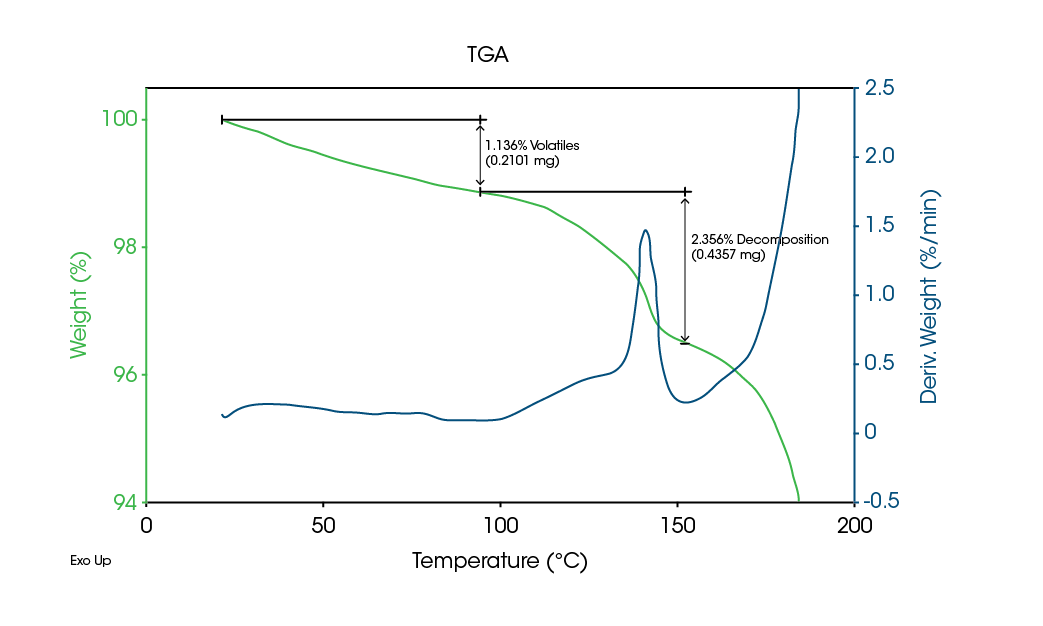
TGA results in Figure 9 show decomposition of some component occurs over the same range. It is this decomposition that converts the crystalline material to an amorphous structure. As shown by the MDSC data, the sample never melts.
Summary
MDSC is a valuable tool for the pharmaceutical scientist with numerous advantages over the traditional technique of DSC.
Acknowledgments
This application note was written by Leonard C. Thomas at TA Instruments.
For more information or to request a product quote, please visit www.tainstruments.com to locate your local sales office information.
Modulated DSC and MDSC are trademarks of Waters Technologies Corporation.
Click here to download the printable version of this application note.
References
- MDSC Paper #3; Modulated DSC Basics; Optimization of MDSC Experimental Conditions; TA Instruments Technical Paper (TP 008)
- MDSC Paper #5; Measurement of Glass Transitions and Enthalpic Recovery; TA Instruments Technical Paper (TP 010)

