Keywords: Recycled PET, RPET, additives, DSC, crystallization behavior, crystallinity, honeycomb sandwich panel
TA444
Abstract
This note describes the importance of DSC to study crystallization behavior and crystallinity of recycled PET used in the production of honeycomb structures. Different raw materials are compared as well as the produced honeycomb structures. Moreover the influence of processing additives is investigated.
Introduction
Sandwich panels are very popular for applications where high strength and low weight are required, e.g. automotive and aerospace. Typically they consist of a thicker low density central layer (core) and thin face sheets (skin) on both sides. Depending upon the application there are different demands for the skin and core layer. These can be accommodated by using a big variety of materials as well as structures. Following the example from nature – beehives – a honeycomb structure as a core has been widely used for many decades in aerospace, e.g. made of aluminum. Honeycombs from thermoplastic polymers have become increasingly important in pursuing material sustainability. An example is recycled PET (RPET) from post-consumer PET waste. The favorable properties of the RPET honeycomb in compression and shear loading make it a good candidate for applications in packaging, automotive and building [1].
The mechanical properties of the final structure depend amongst others upon the quality of the incoming raw material. RPET from different sources can largely differ with respect to molecular weight and impurity content. Differential Scanning Calorimetry (DSC) allows fingerprinting of the recycled PET waste. The processing history influences the crystallinity (and thus the mechanical properties) of the end-product. Quite often additives that influence the crystallization are used to speed up processing. DSC permits the study of the crystallization behavior in relation to cooling speed, as well as the influence of additives on it. Such a DSC study is done on a small scale (only a couple of mg of sample), before ‘wasting’ a large amount of material in the processing machines. Finally, DSC allows control of the crystallinity of the end-product [2] i.e. the honeycomb structure. This thermoplastic honeycomb is produced from a single extruded sheet by a thermoforming, folding and bonding operation in a continuous process.
Experimental
All samples were provided by EconCore N.V.
Three types of RPET from different origin and quality were studied, all of which had been characterized by measuring the intrinsic viscosity (η). Sample 1 has the highest η, sample 3 the lowest.
The RPET base materials were tested as well as these materials after adding additives for influencing the crystallization behavior. Ultimately samples from the core of the finished honeycombs were checked for their crystallinity.
The DSC tests were performed using a TA Instruments Discovery DSC 25 equipped with RCS 90 cooling device. The samples were heated above the melting temperature up to 300 °C and kept isothermal for 1 minute. The crystallization behavior at different cooling rates and subsequent melting profile was measured. A ‘slow’ cooling rate of 10 °C/min was compared to ballistic cooling in the DSC. Subsequent heating from 20 °C was performed at a rate of 10 °C/min. Sample mass was ca 4-6 mg.
Results & Discussion
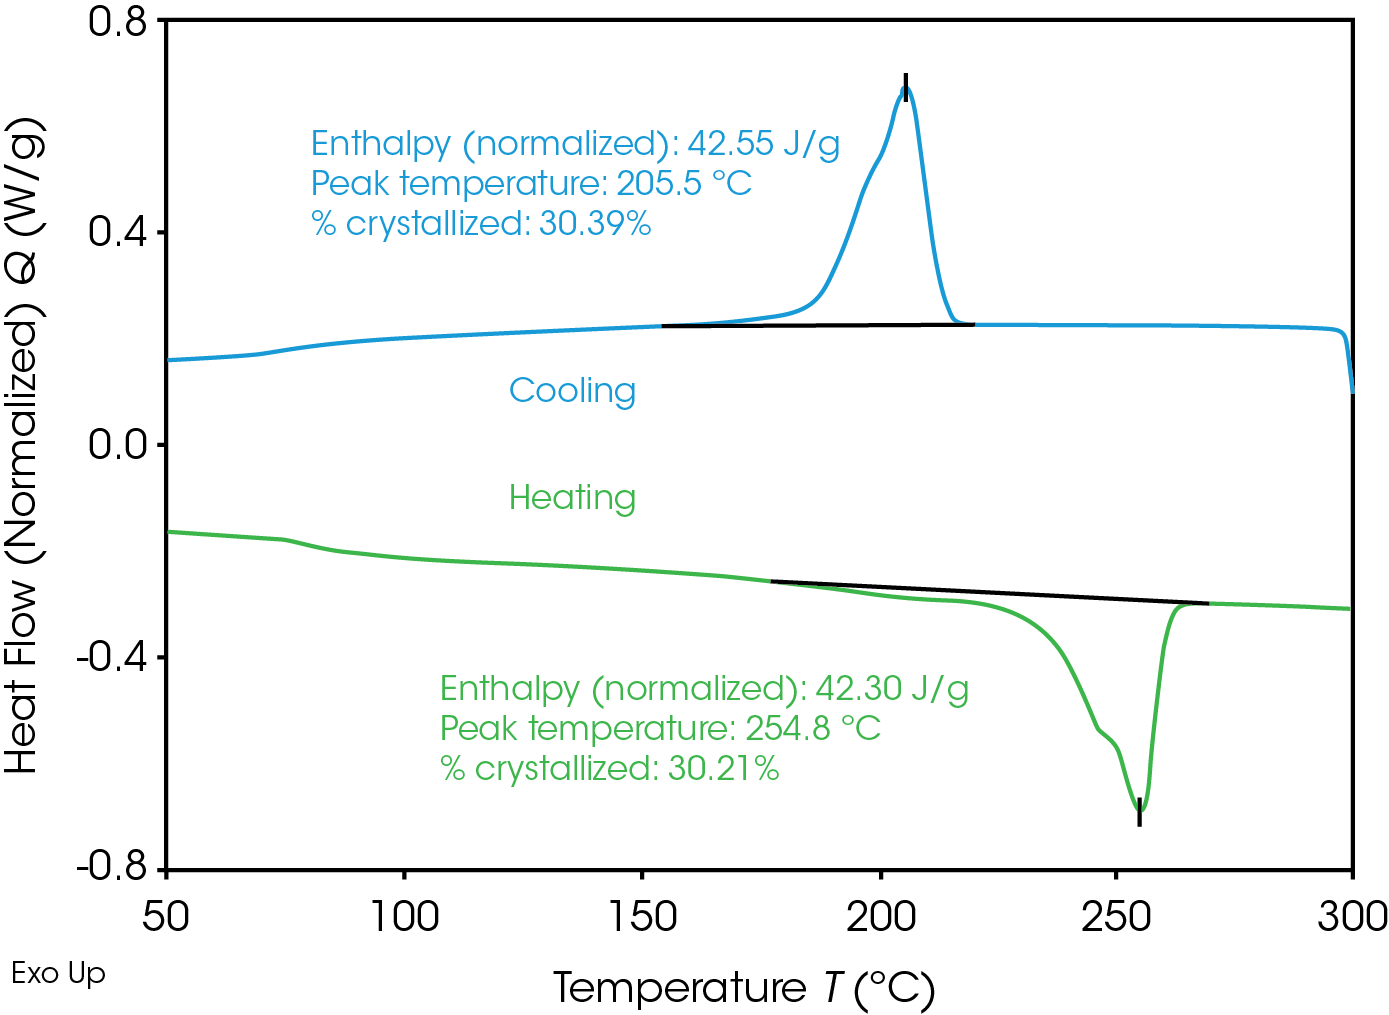
Figure 1 shows the cooling at 10 °C/min and subsequent heating of one of the RPET samples. The crystallinity is calculated by dividing the measured heat of crystallization or fusion by the heat of fusion for 100% crystalline PET, being 140 J/g [3-4]. As expected the crystallinity calculated from the reheating test is in agreement with the crystallinity calculated from the cooling test.
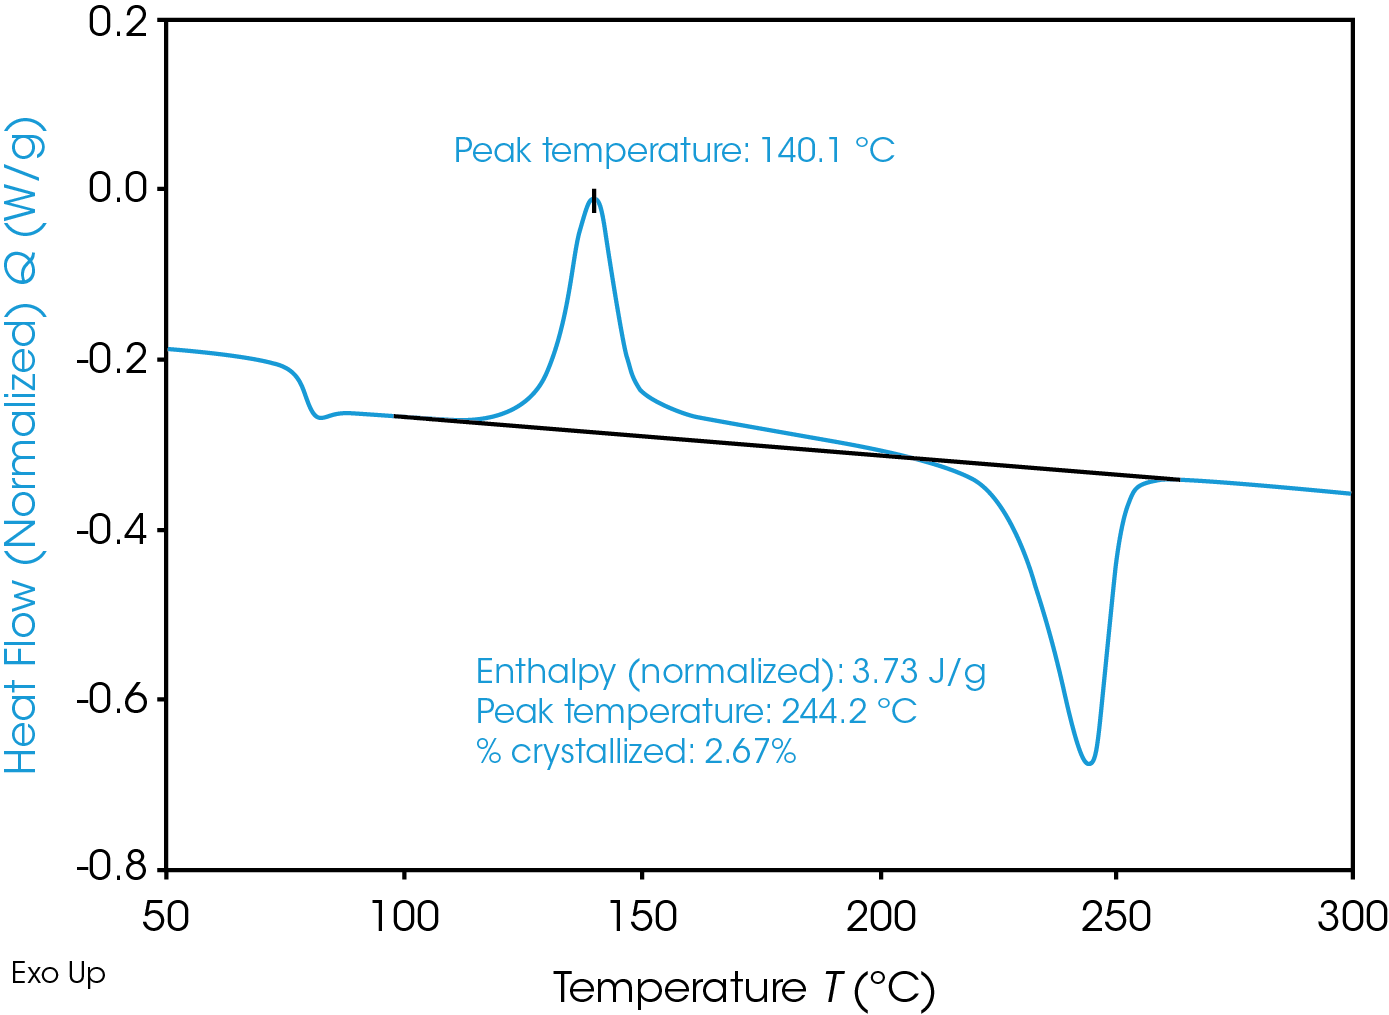
Figure 2 shows the heating at 10 °C/min of one of the RPET samples after ballistic cooling. In this case crystallinity can only be calculated from the heating curve and the heat related to the cold crystallization needs to be taken into account.
Note that in cases where cold crystallization or recrystallization hinder the accurate determination of the crystallinity, a Modulated DSC (MDSC) test is recommended [5-6].
Table 1 summarizes the crystallization behavior for the three RPET base materials, without additives, in a ‘slow’ cooling test. The crystallization temperature Tp increases with decreased η of the RPET, while the crystallinity increases. This can be correlated to the lower molecular weight for the RPET with the lowest η. A higher crystallinity or different crystal size might cause the RPET to behave in a more brittle manner.
Table 1. Cooling at 10 °C/min: crystallization peak temperatures Tp and crystallinity of RPET base materials without additives. Note that sample 1 has the highest η and sample 3 the lowest η.
| RPET | Tp (°C) | % crystallinity |
|---|---|---|
| sample 1 | 187.1 | 25.8 |
| sample 2 | 197.5 | 26.4 |
| sample 3 | 205.5 | 30.3 |
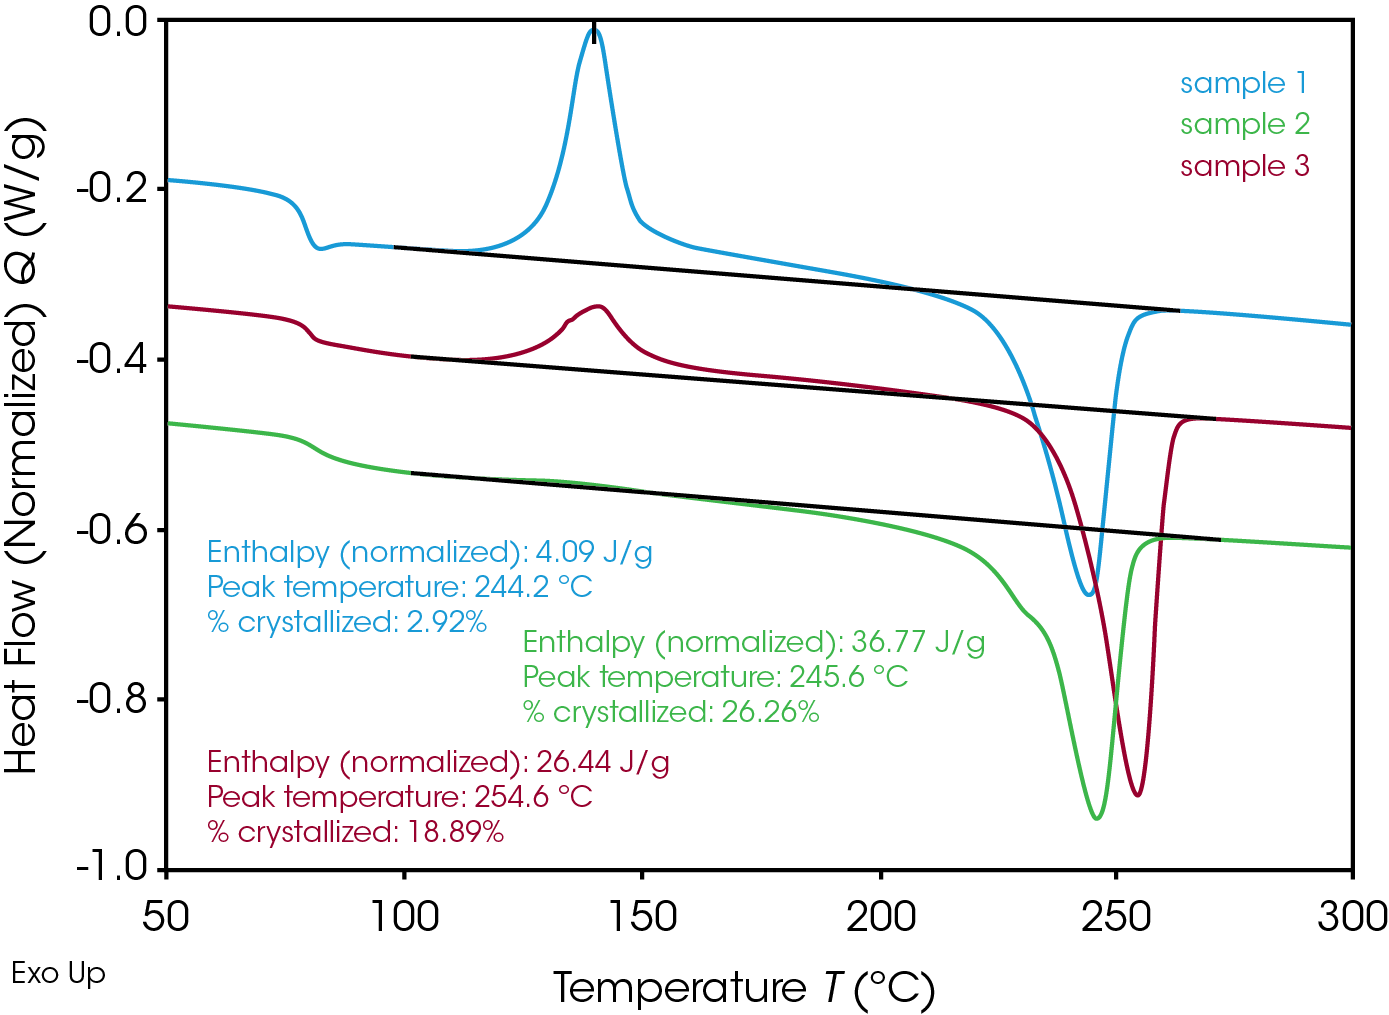
In the real-life processing, high cooling rates are expected, this is simulated in the DSC by performing ballistic cooling. Table 2 and Figure 3 show the results after ballistic cooling.
Table 2. Crystallinity after ballistic cooling of RPET base materials without additives.
| RPET | % crystallinity |
|---|---|
| sample 1 | 2.9 |
| sample 2 | 26.3 |
| sample 3 | 18.9 |
Especially for sample 1 but also for sample 3 the crystallinity after ballistic cooling is much lower, as expected. Due to the low tendency for crystallization upon fast cooling, a high degree of cold crystallization upon subsequent heating is observed for samples 1 and 3. Surprisingly, however, this is not the case for sample 2. The crystallinity after fast cooling is comparable to the one after slow cooling. This might be related to the presence of more impurities in the sample 2, acting as nucleating agents for the crystallization.
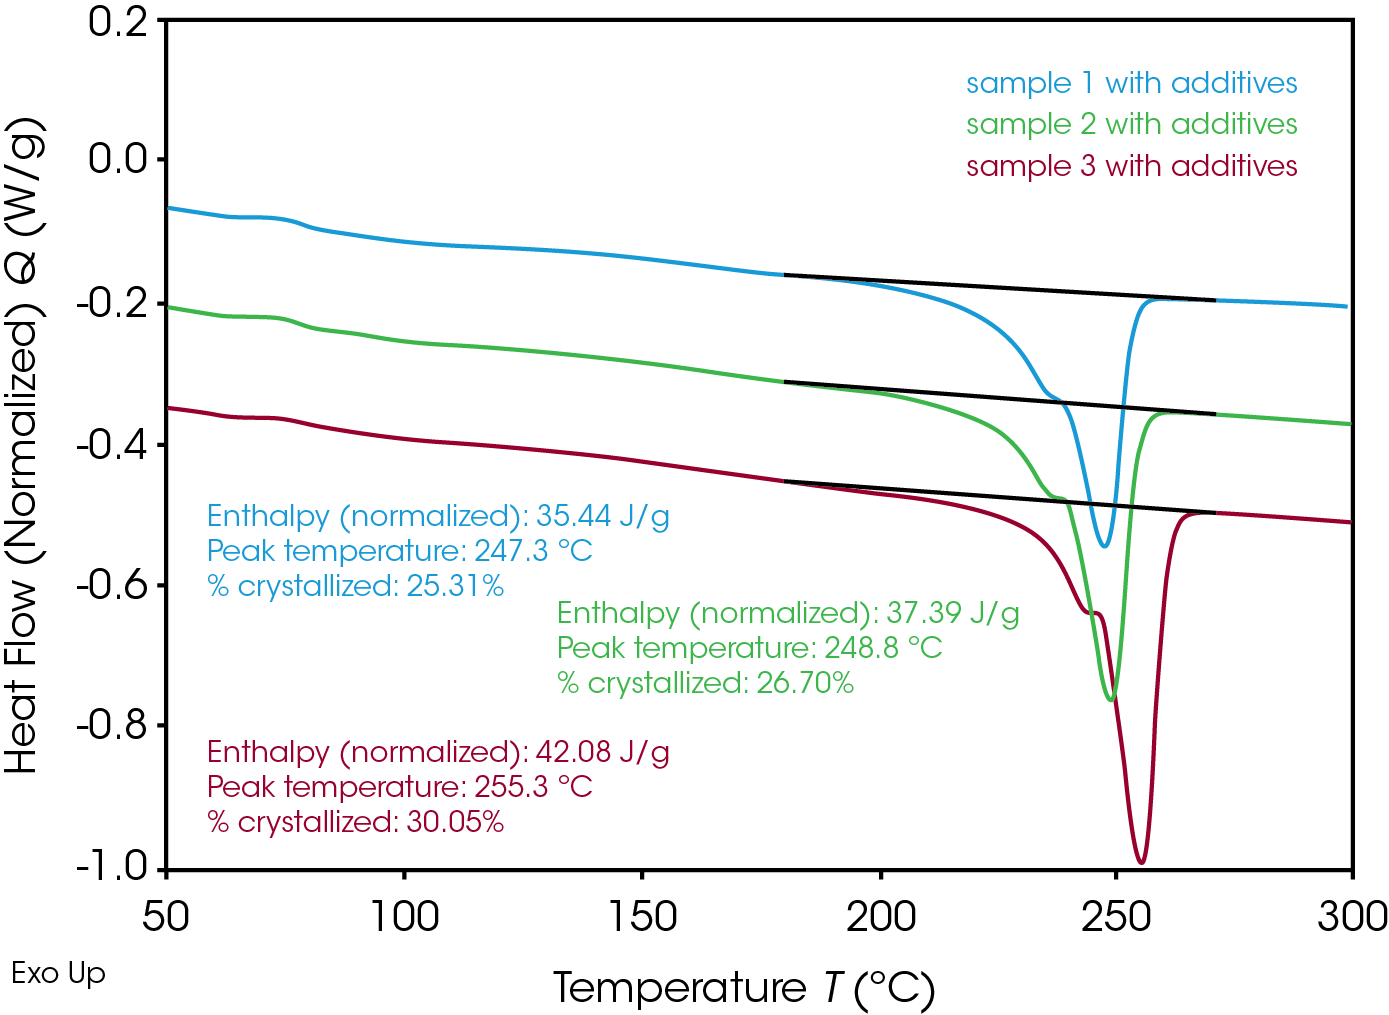
In order to obtain higher crystallinity even after fast cooling, processing aids are added to the RPET. Table 3 and Figure 4 show the results after ballistic cooling of RPET with these additives.
Table 3. Crystallinity after ballistic cooling of RPET materials with processing additives.
| RPET | % crystallinity |
|---|---|
| sample 1 | 25.3 |
| sample 2 | 26.7 |
| sample 3 | 30.1 |
By adding processing aids to the RPET the crystallinity realized during ballistic cooling is now as high as the crystallinity after ‘slow’ cooling for all three samples. Consequently the samples show no cold crystallization during the heating run. For sample 2 it can be concluded that even without processing additives an equally high crystallinity can be obtained after ballistic cooling versus ‘slow’ cooling. Note that sample 3 is showing the highest melting point temperature amongst all RPET’s, irrespective of the presence of additives. It is around 7-10 °C higher than both other samples (cfr figures 3 and 4). This points to the presence of more perfect crystals. The higher crystallinity and more perfect crystals would potentially cause the RPET sample 3 to behave in a more brittle manner.
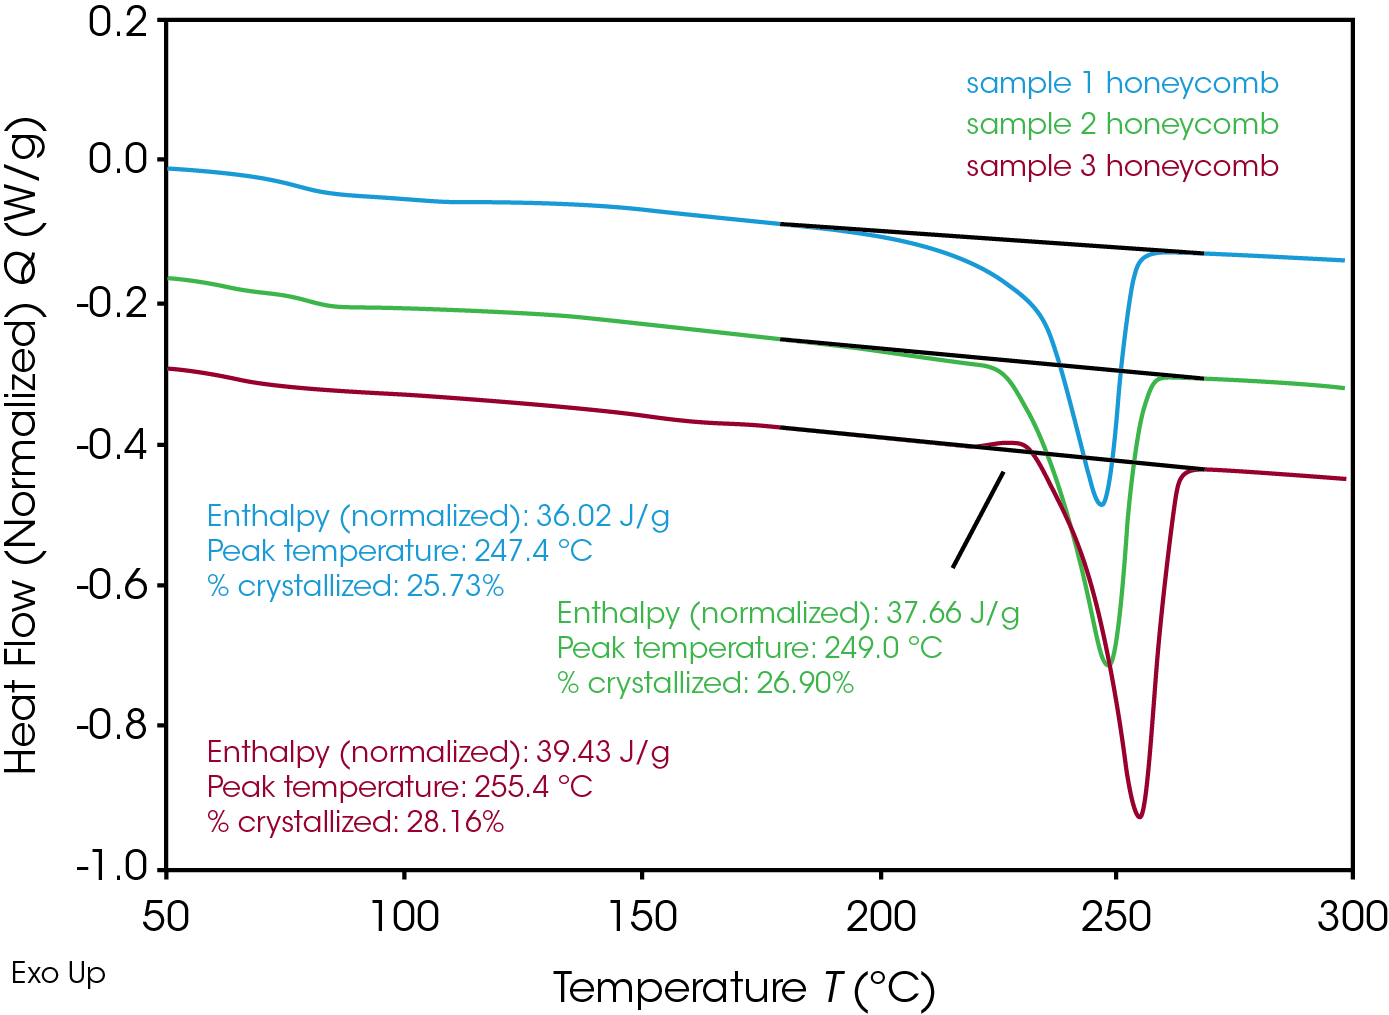
Ultimately the crystallinity was checked in the final product, the honeycomb structure, produced from the RPET with additives. The real-life processing consists of multiple complex thermal steps. The tests on the honeycomb are shown in Figure 5 and summarized in table 4.
Table 4. Crystallinity of RPET materials in the honeycomb.
| RPET | % crystallinity |
|---|---|
| sample 1 | 25.7 |
| sample 2 | 26.9 |
| sample 3 | 28.2 |
Crystallinity for the honeycomb samples 1 and 2 is as high as expected based on ballistic cooling simulations in the DSC. For sample 3, however, the crystallinity is slightly lower in the finished product. In the heating curve a small recrystallization effect is noticed prior to the main melting peak.
Conclusion
This note has described the usefulness of DSC to study crystallization behavior and crystallinity of recycled PET. RPET from different sources can be discriminated with respect to its crystallization behavior and the need for processing additives. The crystallinity of the final product can be monitored, which is very important as it relates to the mechanical properties.
References
1. https://econcore.com/en
2. https://www.tainstruments.com Application note TA123, Determination of polymer crystallinity by DSC.
3. B. Wunderlich, Thermal Analysis, Academic Press, 1990, pp.417- 431.
4. https://www.tainstruments.com Application note TN048, Polymer heats of fusion.
5. https://www.tainstruments.com Application note TP011, Modulated DSC: measurement of initial crystallinity in semi-crystalline polymers.
6. E. Verdonck, K. Schaap, L.C. Thomas, International Journal of Pharmaceutics 192, 1999, pp. 3-20.
Acknowledgement
This application note was written by Els Verdonck, Ph.D, Application Engineer at TA Instruments. It was realized in close collaboration with Wouter Winant (Technical Manager) and Jarne Saelens (Project Engineer) from EconCore N.V. (Leuven, Belgium). They kindly provided all test materials and were involved in fruitful discussions related to proper interpretation.
Click here to download the printable version of this application note.

