Keywords: Pharmaceuticals, Amorphous content, Amorphicity, DSC, MDSC™, Continuous Relative Humidity Perfusion Microcalorimetry (cRHp), DVS, and Solution Calorimetry (SolCal).
TA340
Abstract
This paper discusses how a series of complementary analytical techniques can be used to accurately and precisely assess amorphous content (amorphicity) in many pharmaceutical materials. These techniques include Differential Scanning Calorimetry (DSC), Modulated DSC™ (MDSC™), Continuous Relative Humidity Perfusion Microcalorimetry (cRHp), Dynamic Vapor Sorption (DVS), and Solution Calorimetry (SolCal).
Introduction
The processing of pharmaceutical materials is known to introduce small amounts of amorphous material, which can dramatically affect product stability, compatibility, processing and storage. It is thus critical that pharmaceutical scientists have the ability to accurately and precisely measure amorphous content, particularly at low levels, a task, which can be challenging. Synthetic techniques often result in variations to morphological structure. Further, when crystalline compounds are exposed to mechanical stresses from processes such as grinding and micronization, disturbances can occur in their structure due to the creation of amorphous regions. The physical properties of amorphous structure are quite different from crystalline structure, and can affect the mechanical (flow), physical (solubility), chemical (stability), and pharmacological (bioavailability) properties of the powder. It is thus critical to verify if a drug or drug delivery system has an amorphous component and to quantify the amount.
The most common measurement of amorphous structure involves the analysis of the glass transition by DSC. It is important to examine both the size of the transition in heat flow or heat capacity units and the temperature (Tg) at which it occurs. The size of the transition provides quantitative information about the amount of amorphous structure in the sample, and the temperature identifies the point where there is a dramatic change in physical properties. Below the glass transition temperature there is limited molecular mobility; above Tg there is high mobility, which results in much lower viscosity and potentially much greater chemical interaction between components. Consequently, there is a general desire to store samples at least 40°C below their glass transition temperature.
Results and Discussion
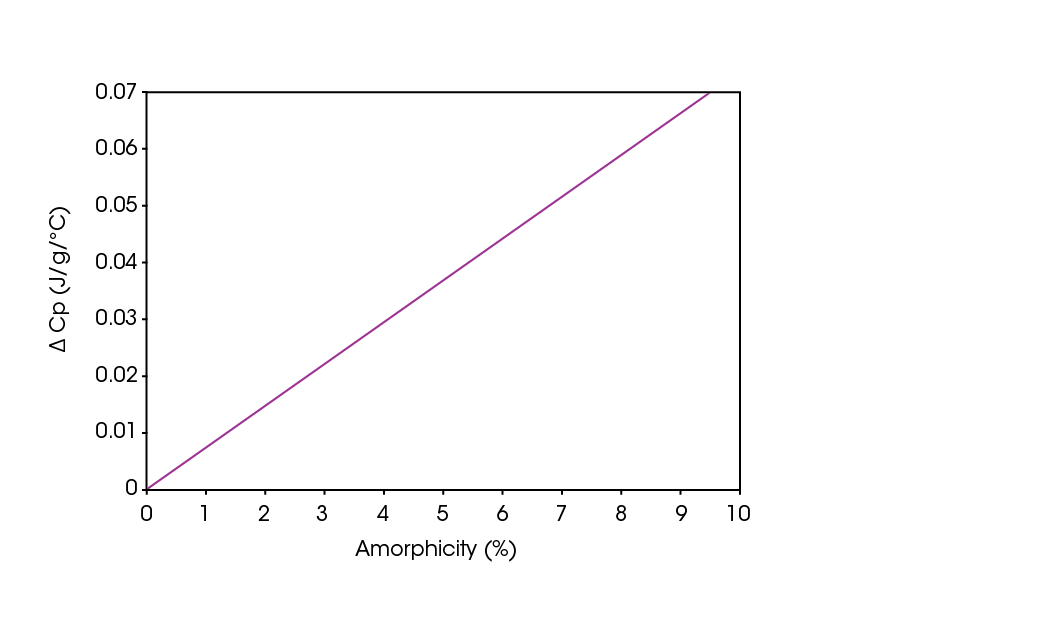
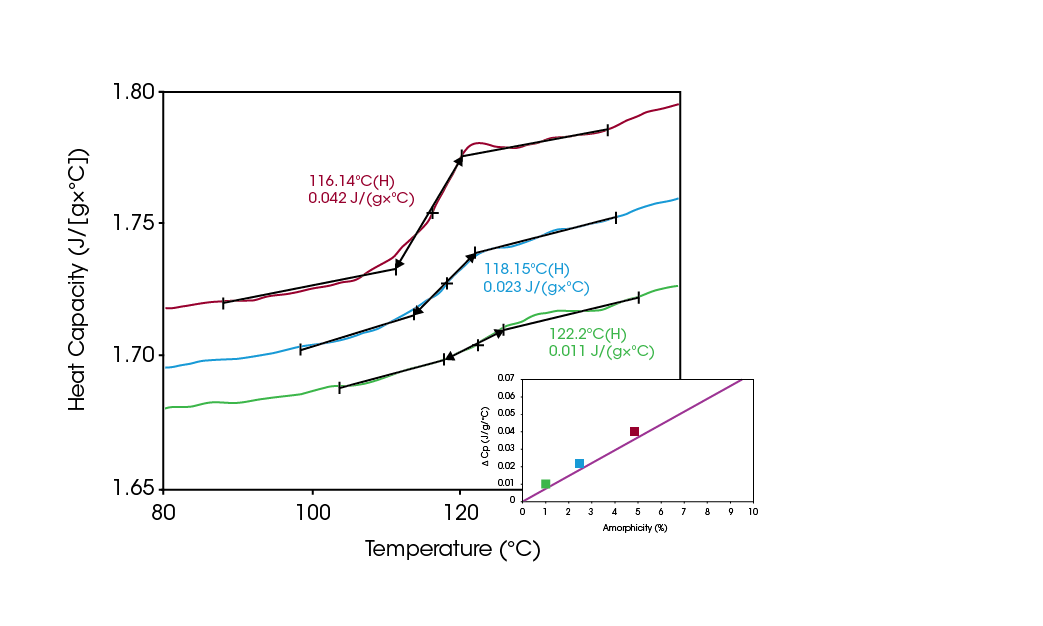
The increase in heat capacity or “ΔCp” that occurs at the glass transition is a quantitative indicator of the amount of amorphous material present. Figure 1 shows the direct linear relationship of ΔCp and amorphous content for lactose, which permits the ΔCp measured by DSC to be used to quantify amorphous content to a high level of accuracy. Figure 2 shows the DSC results (expressed in Cp units) for varying concentrations of amorphous lactose. Comparing the measured ΔCp values to the graph in Figure 1 allows for the direct quantification of sample’s amorphous lactose content.
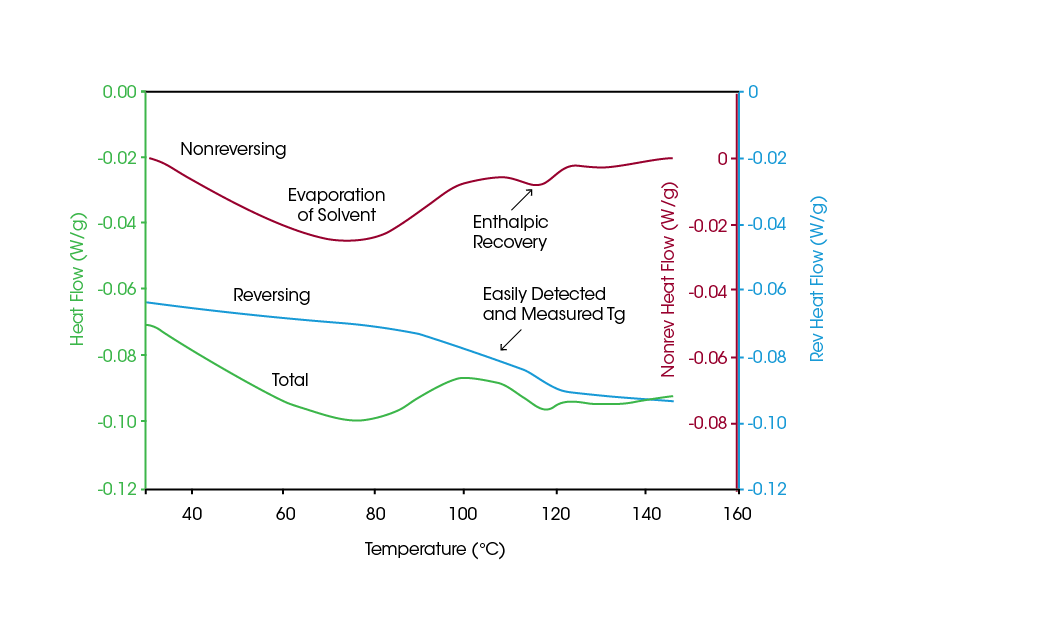
For many samples, it can be difficult to detect the glass transition by DSC even when the sample has a high amorphous content, due to interferences from other transitions that occur over the same temperature range. Figure 3 contains the data from a complex pharmaceutical material, in which the Total Heat Flow signal, (which is equivalent to a standard DSC signal) is complicated due to numerous transitions between room temperature and 150 °C. Modulated DSC, however, provides for a separation of heat flow into the Reversing and Nonreversing components, which can be more easily interpreted as shown. The Reversing Heat Flow signal, (which is the heat capacity component of the Total signal), is extremely useful for measuring glass transitions in all types of difficult samples.
An alternative method for quantifying the amorphous content involves the measurement of crystallization. All compounds exhibit a known heat of crystallization (ΔHc) and the value can be calculated or sometimes directly measured. The ratio of a measured ΔHc to its literature value can be used to calculate the amorphous content of the sample. An amorphous compound can be crystallized by simply raising the temperature above its glass transition and temperature of crystallization (Tc). Because many pharmaceutical materials are unstable and undergo thermal degradation at elevated temperatures, it is desirable to induce crystallization at lower temperature, to preserve the integrity of the sample. In practice, however, the Tg and Tc can be changed significantly by the presence of vaporized water molecules absorbed by the powder. This water content can significantly plasticize the material, thereby lowering its glass transition as shown in Figure 4. In many materials, this allows the sample to crystallize at temperatures well below the thermal decomposition point. By measuring the ΔHc and comparing to the literature value, the amount of amorphous content can be determined. However, for materials with extremely low levels of amorphous material, the heat flows associated with this crystallization process are extremely small, and are detectable only by microcalorimetry.
In continuous RH perfusion (cRHp) microcalorimetry, the relative humidity (RH) is adjusted while temperature is held constant during a measurement. Increasing the RH, effectively plasticizes the material and the Tg is reduced. Once the Tg is lower than the isothermal temperature, the sample crystallizes and ΔHc can be determined. Figure 5 shows the heat flow response of a micronized substance as the RH is increased from 0 to 75 % at a constant rate over 25 hours. Several phases appear, which agree with the known behavior of a crystalline substance with amorphous regions. Three phases are seen, absorption, crystallization, and evaporation of excess water following crystallization. A fourth event is water condensation as the sample turns to solution. Since RH changes can be made slowly and the system is open, the sample is in a state of “near equilibrium”. When the RH range is determined, the unknown sample can be analyzed.
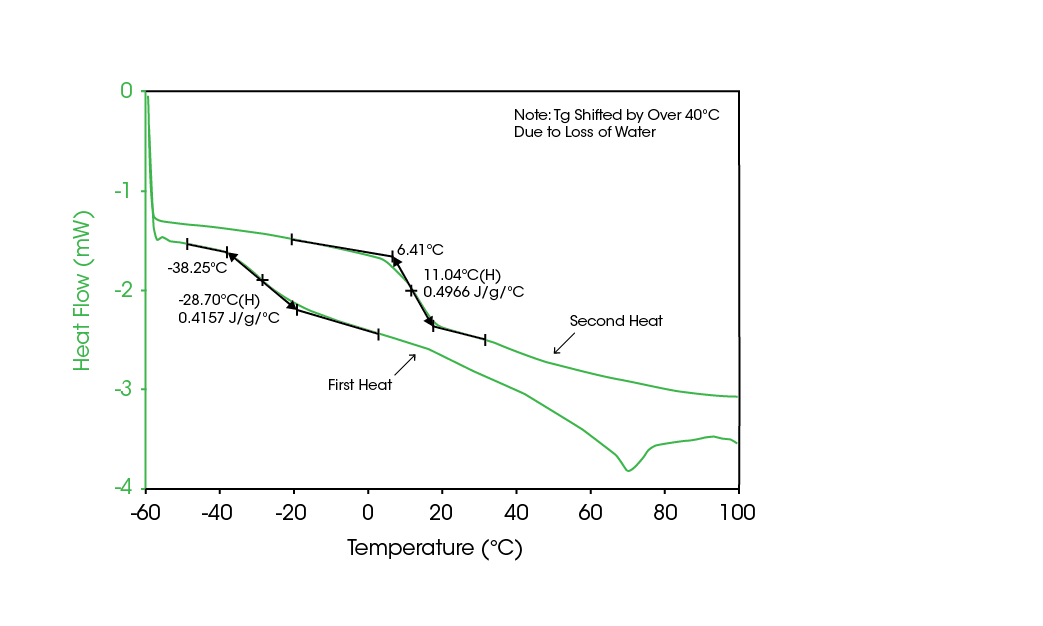
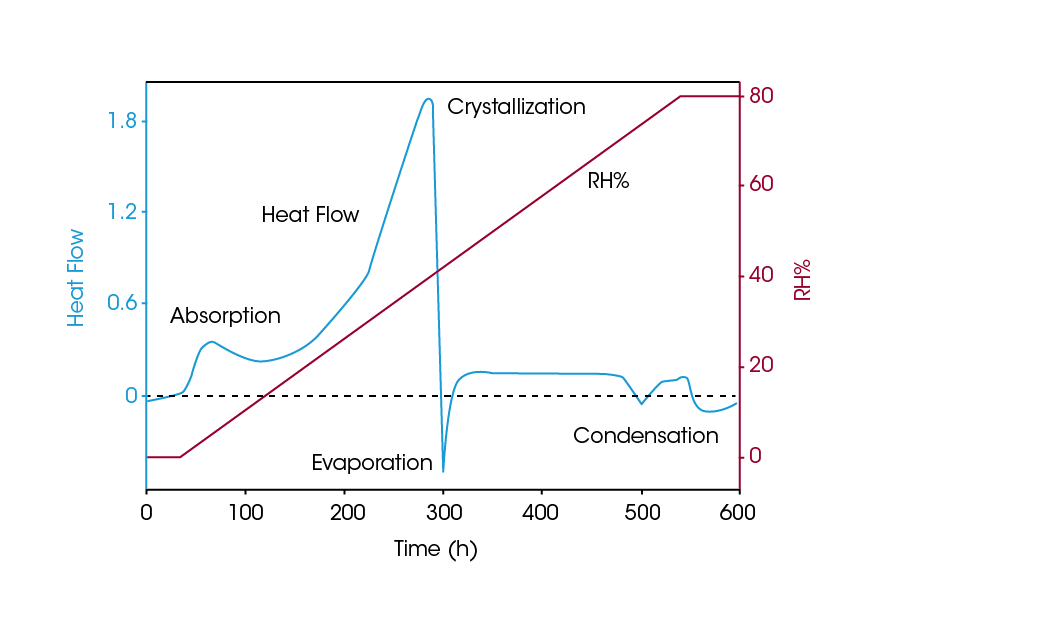
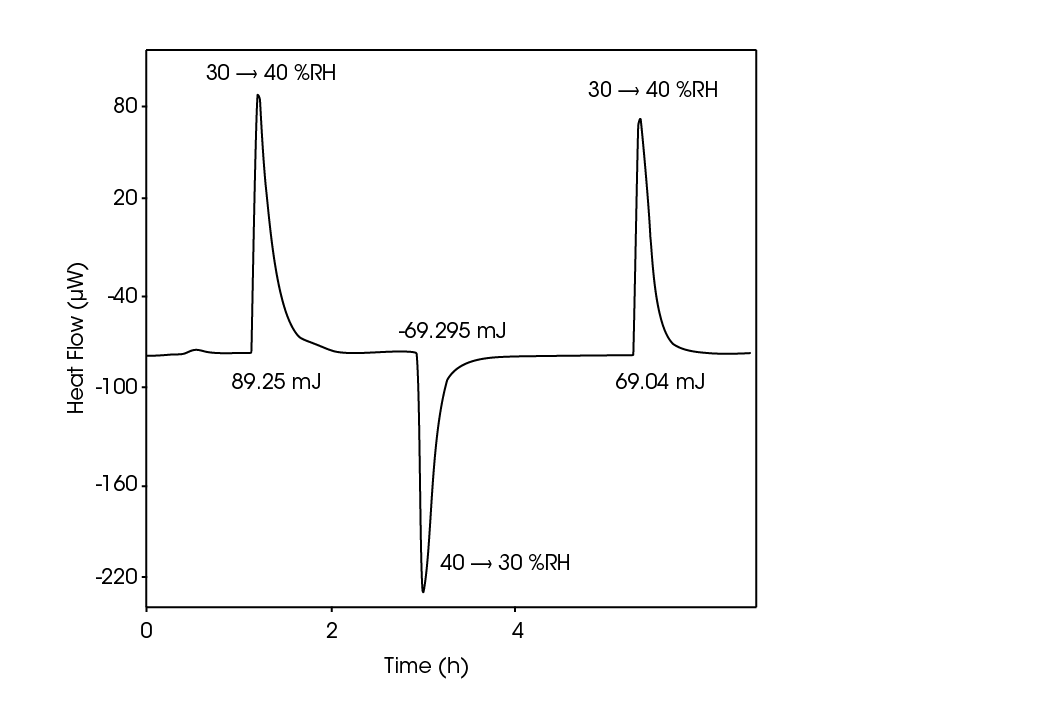
Figure 6 contains the data from a lactose sample during a series of RH ramps over the range 30-40% RH (2). As humidity is initially ramped, the sample undergoes two simultaneous exothermic processes: absorption and crystallization. The sum of these processes is 89.25 mJ. During the subsequent ramp down from 40-30 %, the absorption is the only reversible process and the heat of absorption / desorption is measured as 69 mJ. This is confirmed in the final RH ramp from 30-40 %, in which the exothermic process is measured as 69 mJ, corresponding to only the heat of absorption. Hence the ΔHc is calculated as (89.25-69) mJ = 20.25 mJ. Normalized for the sample mass, this corresponds to an amorphous content of only 0.3%.
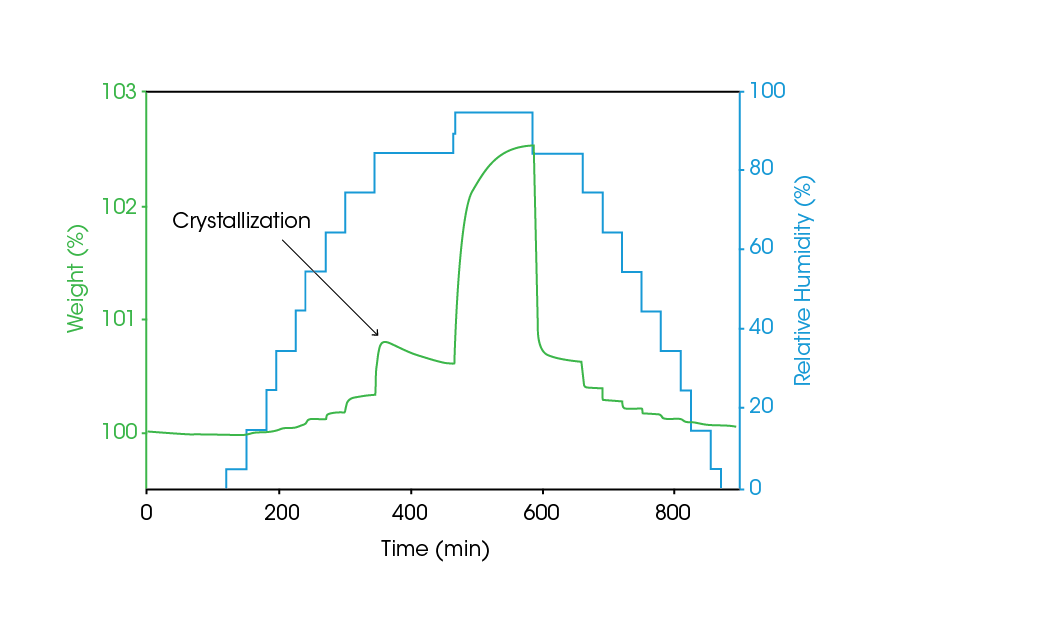
A sample’s absorption / desorption profile can also be used to determine amorphous content gravimetrically. Through the process of dynamic vapor sorption (DVS), the quantitative uptake of moisture can be measured, and the resultant data used to accurately calculate amorphous content. Figure 7 contains the DVS data from a micronized pharmaceutical material, in which the RH is stepped in increments of 10 % over the range 5-95 % RH. At each RH level, the sample will absorb moisture and this is easily detectable. However, when crystallization occurs, the sample will eject water as the monohydrate is formed and the material’s affinity for water decreases. Comparing the absorption and desorption profiles allows for the direct gravimetric calculation of the amorphous content, as a function of water uptake.
A final technique to measure amorphous content involves solution calorimetry (SolCal), which is an alternative to heat flow microcalorimetry in the assessment of amorphicity. SolCal works by dissolving the solid material in a solvent and measuring the temperature rise or fall in the solvent as a result of dissolution. Since amorphous and crystalline materials will have a different heat of solution, SolCal can be used to quantify the amount of amorphous material in a mixture of the two. Today, SolCal is used to routinely assess amorphicity in many pharmaceutical companies. It has also been found to be useful in other application areas, such as quantification of polymorphism.
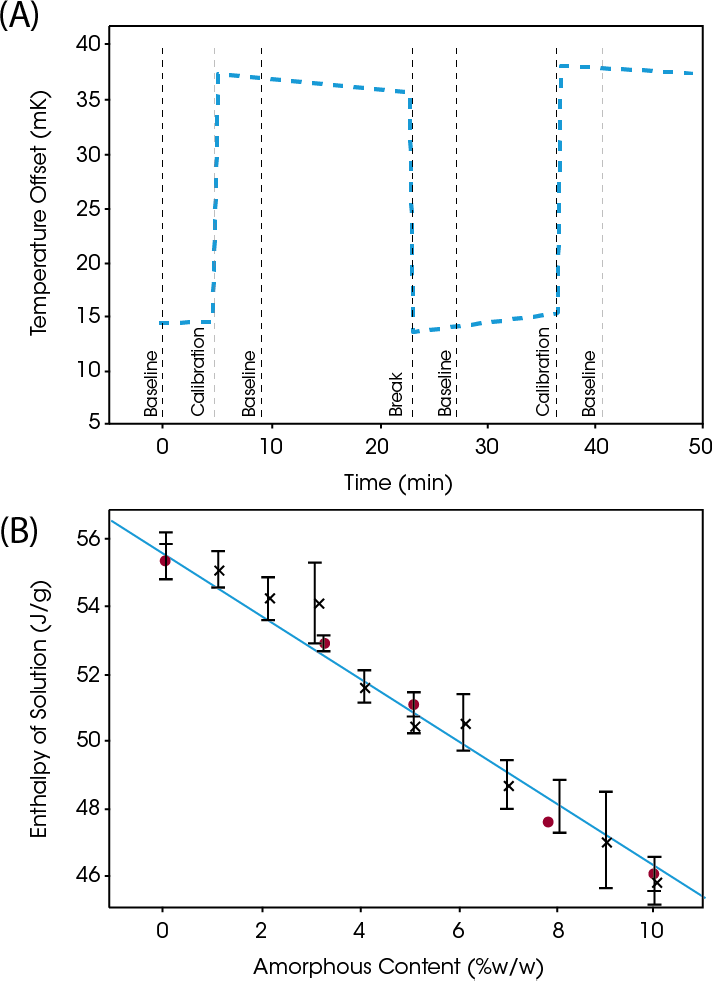
The graphs in Figure 8 show the output from SolCal for a 5% amorphous fraction of lactose (3). In Figure 8a, the y-axis shows temperature offset from the bath temperature, which was 25 °C. The central “break” section shows the temperature decrease as a result of dissolving the sample in water. The other two steep transitions on either side are calibrations. After, calibration, the heat of dissolution can be accurately determined. By comparing the measured heat to the literature values shown in Figure 8b, the amount of amorphous content can be clearly defined.
Acknowledgments
This application note was written by Steven R. Aubuchon at TA Instruments and Leonard C. Thomas, DSC Solutions.
For more information or to request a product quote, please visit www.tainstruments.com to locate your local sales office information.
Modulated DSC and MDSC are trademarks of Waters Technologies Corporation.
Click here to download the printable version of this application note.
References
- L.E. Briggner (Astra-Zeneca), Thermometric Application Note 22022, 1993.
- L.E. Briggner, AstraZeneca, 2002
- Hogan & Buckton, Int. J. Pharm., 2000, 207, 57-64.

