Keywords: Differential scanning calorimetry (DSC), wax appearance temperature (WAT), cloud point (CP), crude oil, petroleum, flow assurance
TA429
Abstract
Crude oil is typically extracted as a single organic liquid phase from the reservoir. However, during transportation, a drop in the temperature can cause the higher molecular weight paraffins or waxes to separate into the solid phase. The temperature at which the first wax crystals appear during cooling is commonly known as the wax appearance temperature (WAT). Once below the WAT, the crude oil can form a gel-like structure. Breaking down this structure to restart and maintain the flow may often require energy- and cost-intensive approaches.
This paper will focus on characterizing crude oil and related fuels using thermal analysis, specifically with measurement of WAT in the context of the field of flow assurance. The paper will specifically focus on good experimental practices for accurate and precise measurement of WAT with improved sensitivity and reduced effects of supercooling.
Introduction
Crude oil is one of the most important sources of energy and a key player in today’s global economy. The composition of crude oil is primarily hydrocarbons broadly comprising paraffins, naphthenes, aromatics and ashphaltenes. Since crude oil is an important non-renewable source of energy with large-scale implications on the global economy, it is critical that crude oil is extracted and transported from the source site in the most efficient, and uninterrupted, manner.
Pipelines are still the most convenient means of transporting crude oil from the producing field to the refinery. However, one of the challenges in ensuring an uninterrupted transportation is that a drop in the pipe temperature, especially during transport over long distances, can cause the higher molecular weight paraffins or waxes to crystallize into the solid phase. This may further cause the crude oil to undergo gelation and completely stop the flow of the oil. Since the first step in any crystallization event is nucleation, it is important to determine the temperature at which nucleation or the first wax crystals appear during cooling. This temperature is denoted as the cloud point or wax appearance temperature (WAT) for crude oil. It is an indirect measure of the potential for the crude oil to crystallize under a given set of conditions.
Since wax appearance is essentially a liquid-to-solid phase transition involving an exchange of energy with its surroundings, it results in a change in the overall heat capacity of the system. Consequently, DSC is a very powerful tool to determine the onset temperature or the WAT for any crude oil.1, 2
Materials and Methods
Four different types of crude oil were studied in this work. These are labeled as below based on the geographical source of the crude oil.
A: Pennsylvania (PA) crude oil
B: North Dakota (ND) crude oil
C: Prudhoe Alaska (AK) crude oil
D: Texas (TX) crude oil
All samples were tested on a sensitive, state-of-the art TA Instruments Discovery 2500 DSC fitted with a Refrigerated Cooling System (RCS) 90 and a dry nitrogen purge at 50 mL/min. The instrument was calibrated for heat flow using the Tzero™ calibration, followed by temperature and enthalpy calibration using indium as a standard reference material. Verification experiments were performed post calibration and prior to running the tests to ensure that the thermometric and calorimetric measurements are accurate, precise and within the instrument specifications.
The samples were aliquoted into pans that were hermetically sealed. Since appearance of wax is essentially a crystallization event, the sample mass was controlled to be within 10.50 mg ± 0.50 mg to eliminate any kinetic effects due to differences in sample mass.
The samples were equilibrated 40.00 °C to ensure that all the wax crystals are dissolved prior to the measurement. Following equilibration, a standard temperature ramp method at a cooling rate of 1.00 °C/min was used for determining the WAT. Additional experiments were performed using the same method except the cooling rates were changed as indicated in the results.
Data analysis and processing was performed using TA Instruments TRIOS software which can be downloaded from the TA Instruments website at no charge. The same software is also used for instrument control including automated calibration and verification routines as well as method development and implementation.
Results and Discussion
It has been well-documented that a noticeable shift in the heat capacity baseline is observed at the WAT.2 One of the ways to identify the onset temperature of the transition is by using the “onset point” analysis (available directly in TRIOS). This analysis measures the transition temperature by allowing a user to construct a tangent along the heat capacity baseline prior to transition and a tangent along the slope of the transition. The projection of the intersection of these tangents on the x-axis (temperature in this case) is calculated and denoted as the onset temperature.3, 4
Figure 1 shows a representative DSC plot for the four crude oils at 1.00 °C/min. As can be observed, a noticeable shift in the heat capacity baseline is observed as the waxes start crystallizing from solution for all the samples allowing for a straightforward determination of the WAT.
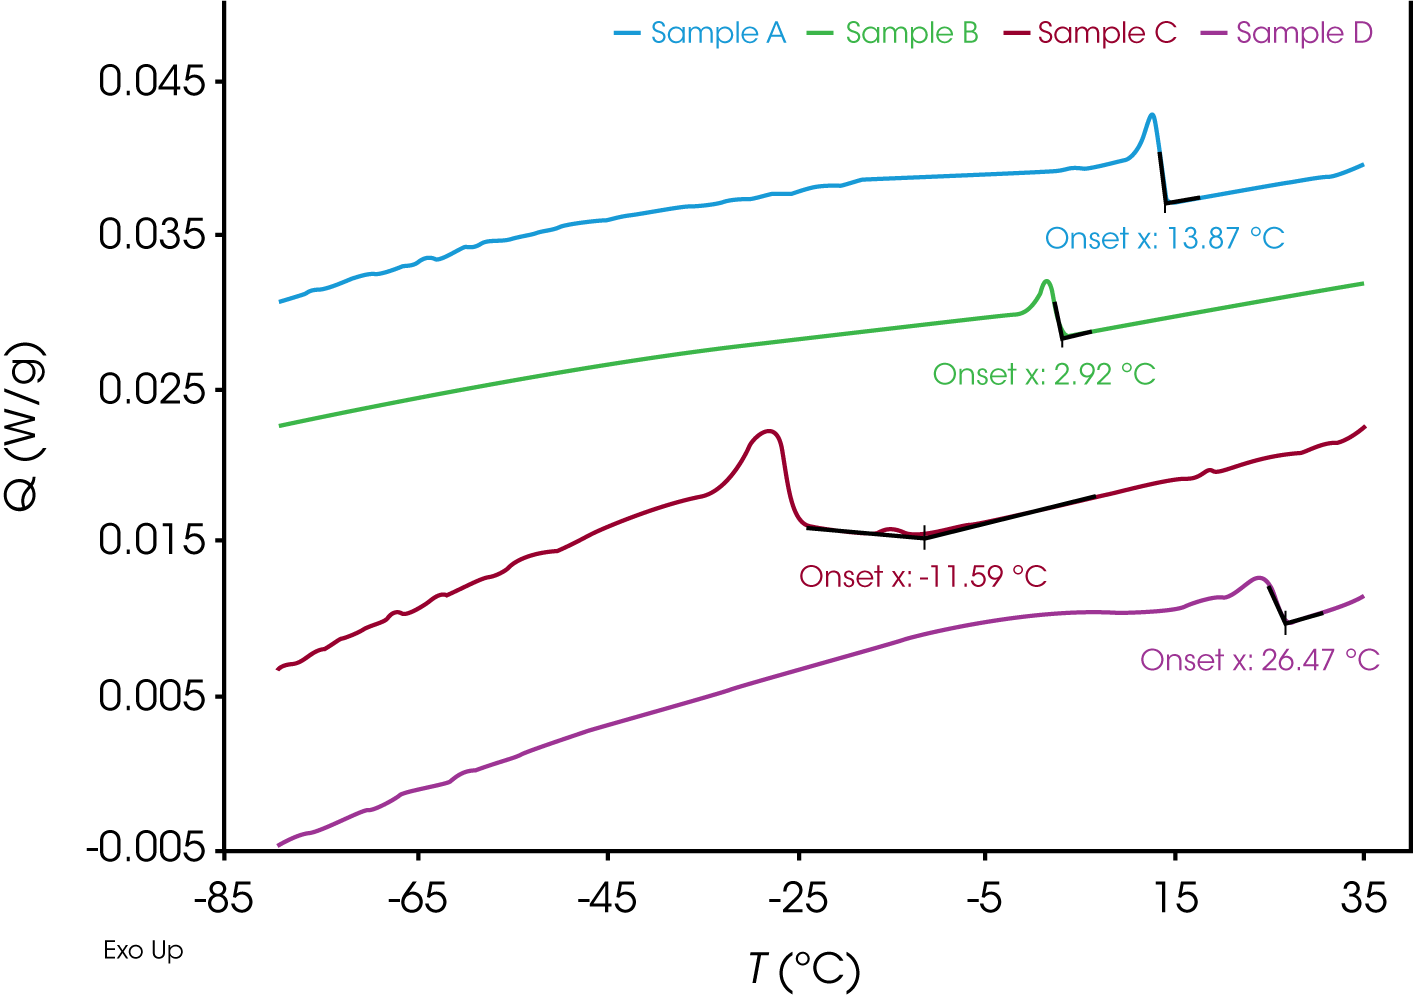
It should be noted that a faster cooling rate could be used to determine the WAT. However, the user must be cautious of increased effects of supercooling at higher cooling rates. This can lead to an underestimation of the WAT compared to the equilibrium WAT which has more practical significance. While obtaining the equilibrium WAT value is not possible with a DSC, a cooling rate of 1.00 °C/min was chosen for our studies as it has been shown to allow a more accurate and precise determination of WAT with minimal supercooling effects and closer to the true or equilibrium value.3
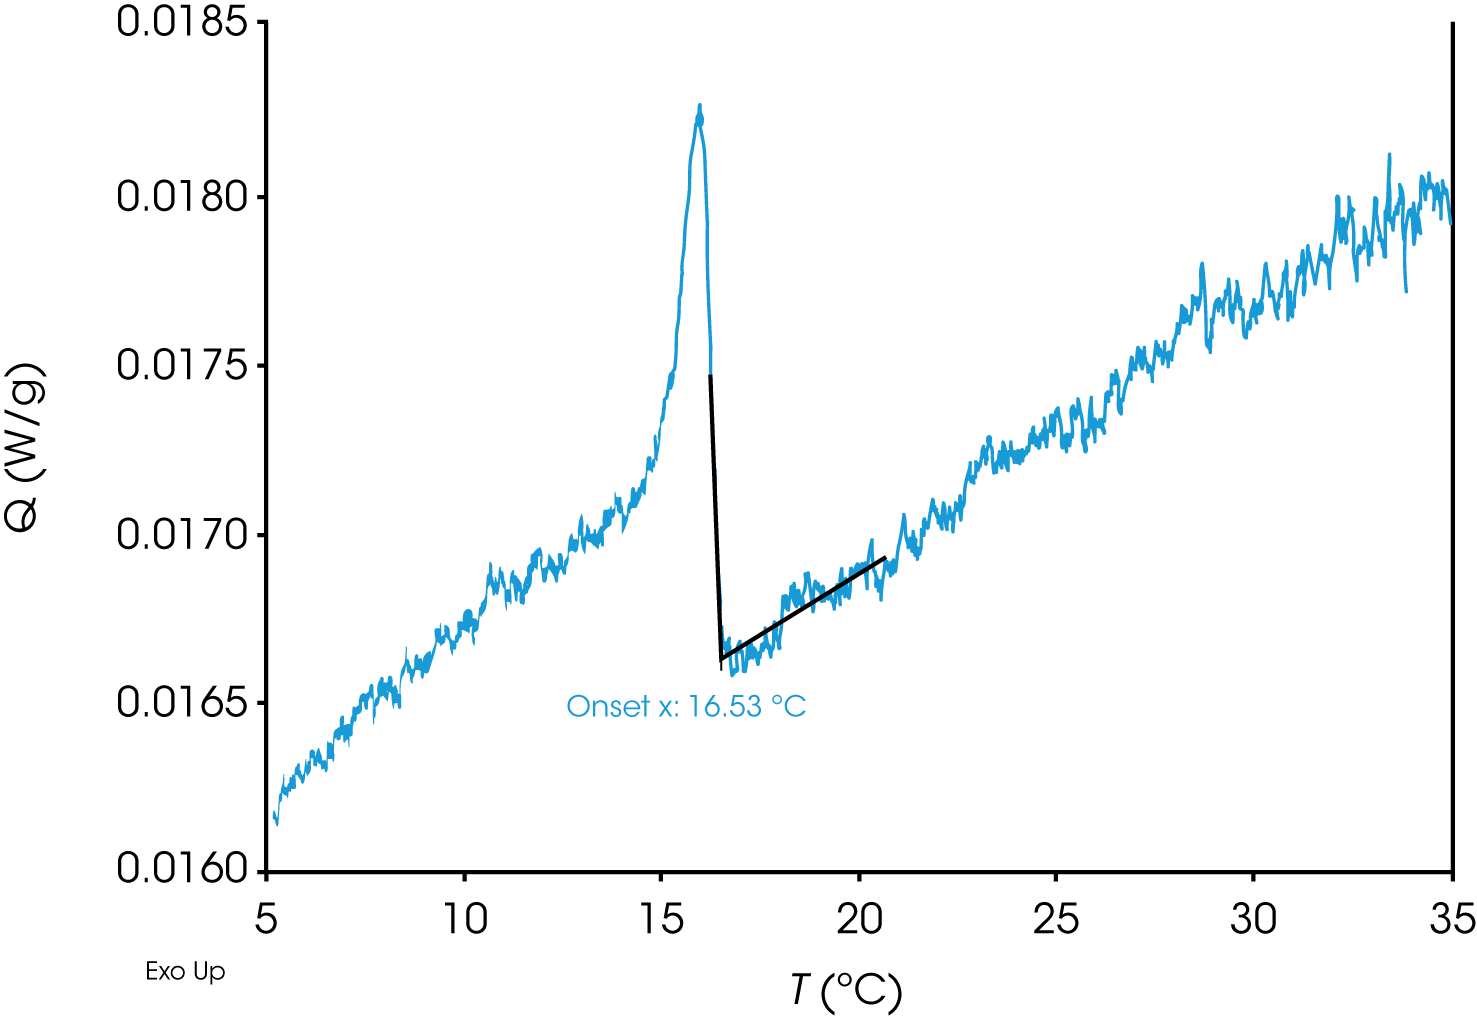
To further reduce the effects of supercooling, sample A (PA) was subjected to an extremely slow cooling rate of 0.20 °C/min (Figure 2). As expected, compared to the initial data measured at 1.00 °C/min in Figure 1, the measured WAT is indeed shifted to higher temperature (from 13.87 °C to 16.53 °C), likely due to reduced supercooling. Since a slower cooling rate can significantly increase the experimental duration, the overall experimental time can be kept reasonable by performing initial screening studies at faster cooling rates and determining a narrow temperature range appropriate for WAT determination.
DSC experiment, the sensitivity of the heat flow measurements (directly proportional to the heating or cooling rate) is also reduced. The mathematical relationship between the heat flow signal and the heating/cooling rate is shown in Figure 3.
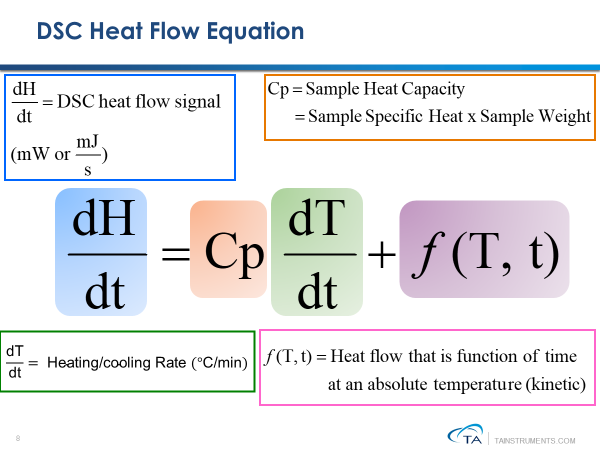
Consequently, while lower cooling rates can reduce supercooling, it can also reduce the overall sensitivity of the measurement. The success of any measurement under such conditions is greatly dependent on the inherent sensitivity of the instrument. TA Instruments DSCs, owing to its their high sensitivity, allow users to perform measurements using slow heating/cooling rates with ease with calibration routines described in the previous section.
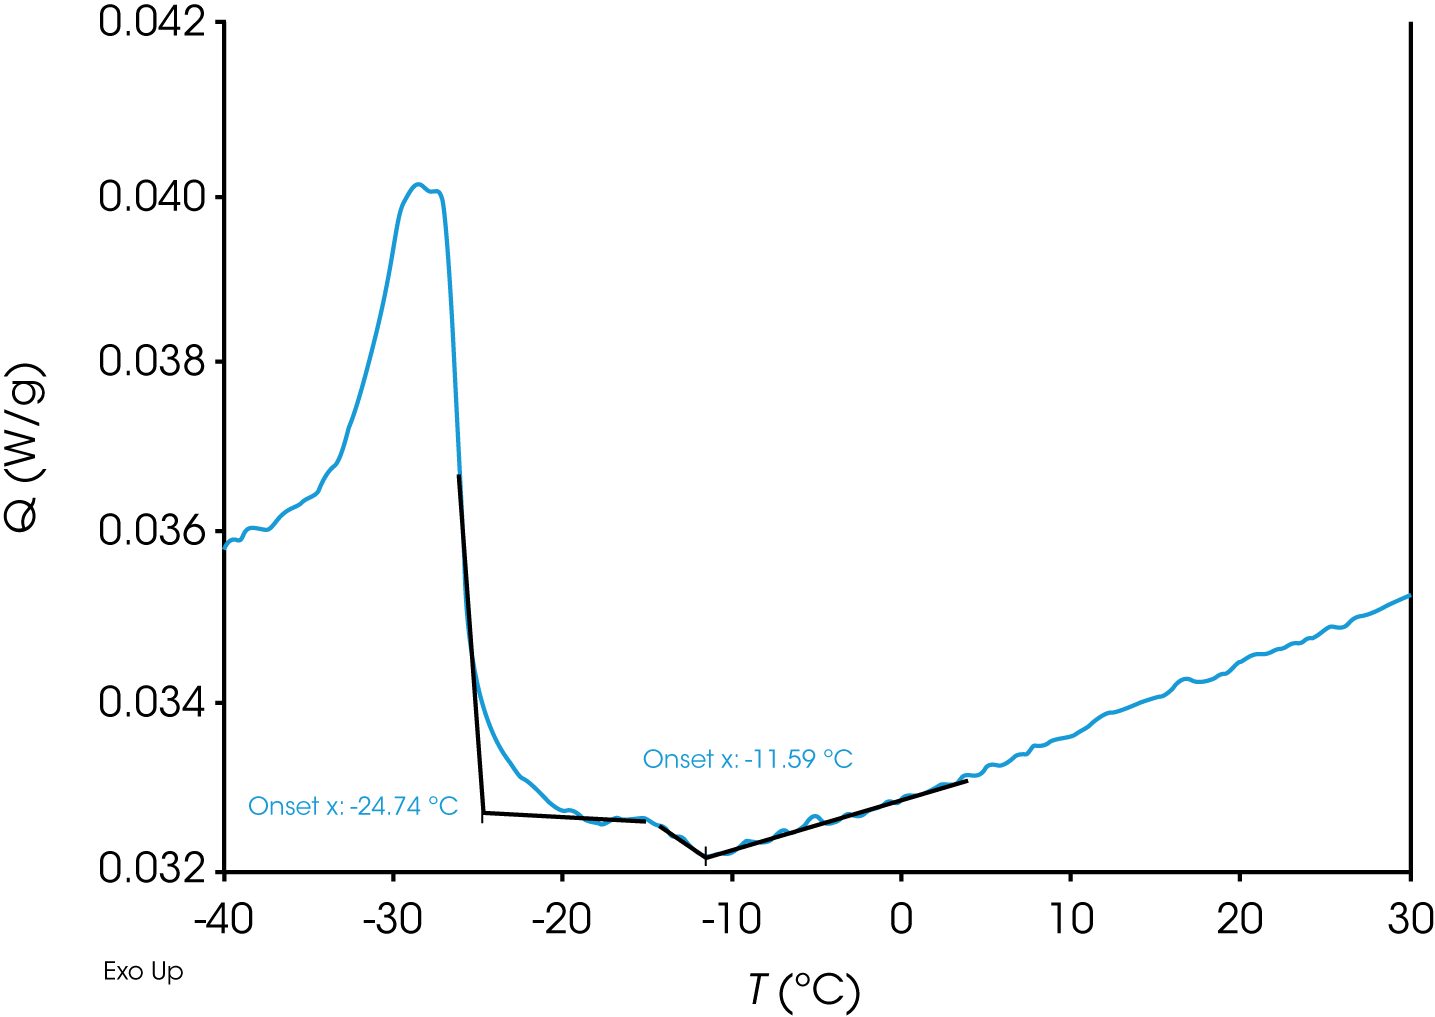
Another interesting observation from Figure 1 is that compared to samples A (PA), B (ND) and D (TX) which show a very sharp transition as the waxes start crystallizing from the solution, the wax appearance transition for sample C (AK) at 1.00 °C/min is much more gradual, with the first step in the heat capacity baseline observed at -11.59 °C (Figure 4) followed by a sharp peak with an onset point at -24.74 °C, much in contrast to the rest of the samples.
When sample C (AK) was further subjected to different cooling rates, it is observed (Figure 5 and Table 1) that the onset point of the step transition (labeled as transition 1) shows a much stronger dependency on the cooling rate compared to the onset point of the peak (labeled as transition 2).
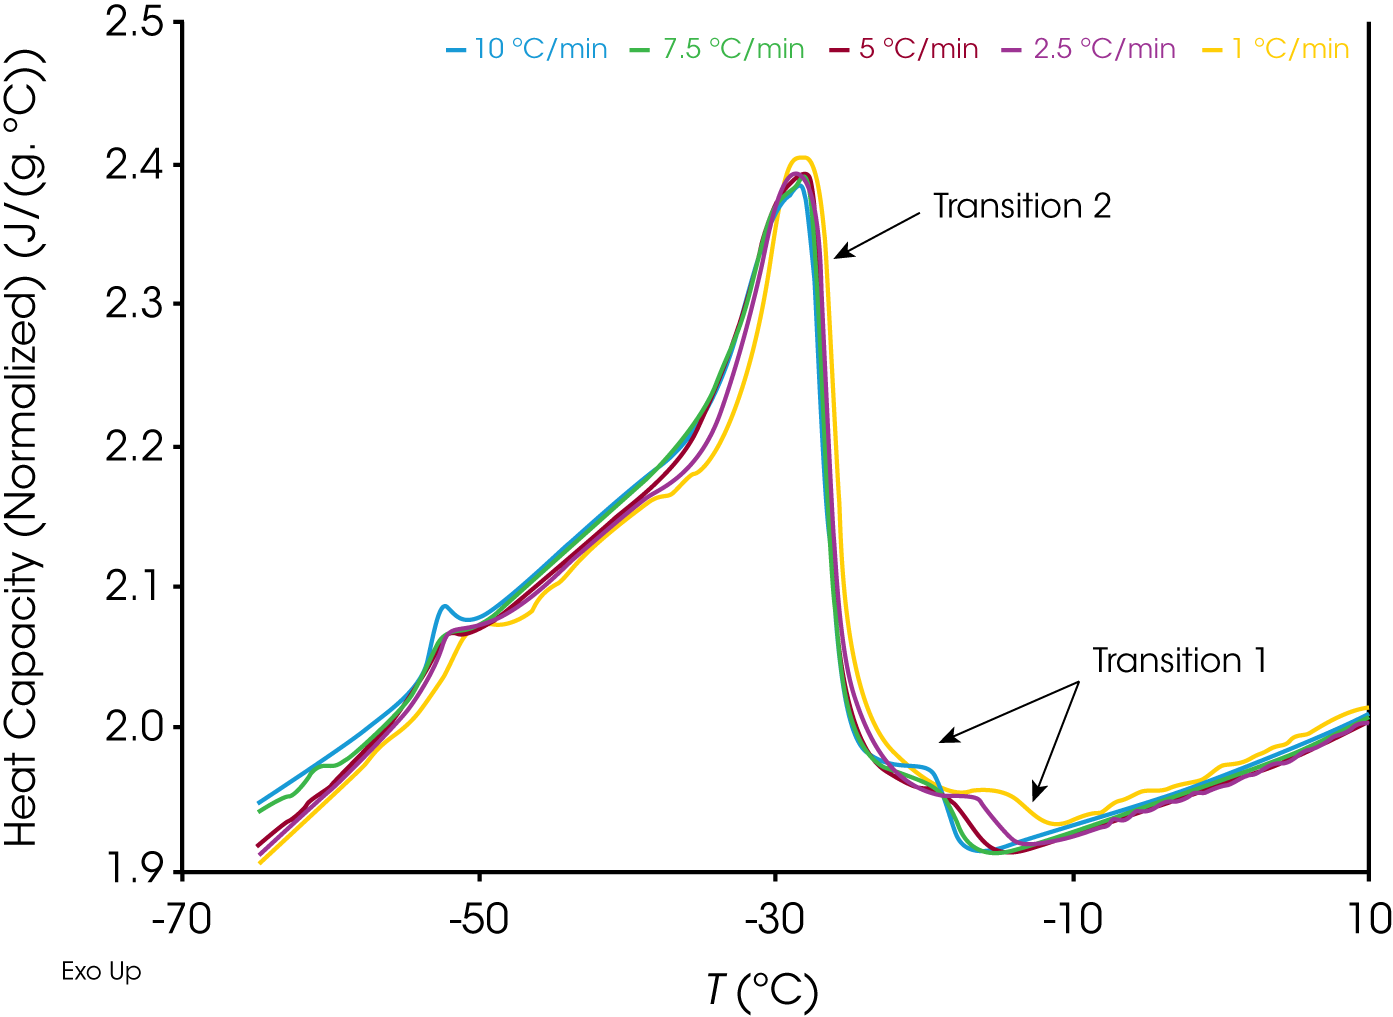
While the exact reasons for the above observations are difficult to determine solely through the data at hand, one possibility is that the 1st transition is indicative of the nucleation of the first crystals from the solution, which has a much more stronger kinetic dependence compared to the 2nd peak which could be due to the crystallization of a different hydrocarbon (note that crude oil is a mixture of hydrocarbons of different chain lengths) and/or a secondary nucleation event which is more stochastic in nature. Additional studies would have to be performed to understand these observations in greater detail which is beyond the scope of this paper.
Table 1. Tabulated data for sample C (AK) tested at different cooling rate
| Cooling rate (°C/min) | Onset point Transition 1 (°C) | Onset point Transition 2 (°C) |
|---|---|---|
| 1.00 | -11.19 | -24.74 |
| 2.50 | -13.57 | -25.11 |
| 5.00 | -14.51 | -25.29 |
| 7.50 | -16.19 | -25.61 |
| 10.00 | -17.33 | -24.98 |
Conclusion
Differential scanning calorimetry (DSC) is a powerful tool to quantitatively study transitions involving a phase change. The crystallization of the waxy components in crude oil is an important transition that needs to be well-characterized and understood to ensure the smooth transportation of crude oil across the globe. The wax appearance temperature (WAT) measurements are a critical parameter in these efforts. DSC is a valuable tool to perform these measurements precisely and accurately in a convenient manner. It allows for a facile comparison of cloud points of different crude oil formulations as well as understand the mechanism of wax formation in a complex chemical environment. These studies can also be applied to other products of the oil and gas industry such as fuels and distillates.
References
- Sousa, A.L., Matos, H.A. & Guerreiro, L.P. J Petrol Explor Prod Technol (2019), 9, 2091.
- Kok et al. Fuel (1996), 75 (7), 787.
- Energy Institute Publications Standard IP 389
- Adhia Y. “Use of Thermal Analysis and Rheometry to Study the Properties of Crude Oil” presented at American Institute of Chemical Engineers conference in November 2019
Acknowledgement
This note was written by Yash Adhia, Senior Applications Support Engineer at TA Instruments.
Click here to download the printable version of this application note.

