Keywords: Antibodies, Nano DSC
MC166
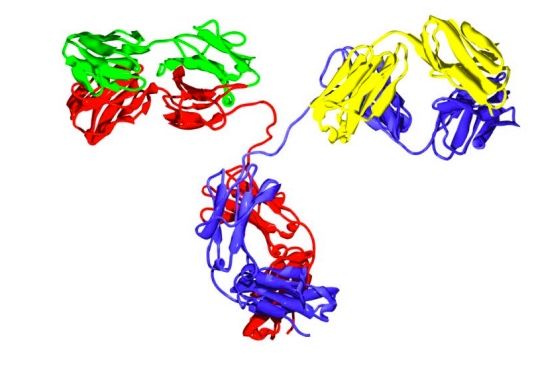
Antibodies or immunoglobulins are a specific type of glycoprotein. There are billions of forms, each with a different primary sequence and antigen binding site (1). Mammals have five classes of antibodies, IgA, IgD, IgE, IgM, and IgG; the major class of antibodies in the blood is IgG. A typical antibody structure is Y-shaped. The tail is referred to as the Fc (fragment crystallizable) region and the two arms, the Fab (fragment, antigen binding) regions. Each Fab region, the red and blue portions paired with the green and yellow regions in the structure below, contains the highly variable regions of the molecule and an antigen binding site (1). The interaction between the antigen binding site and an antigen is extremely specific, which has made antibodies very highly desirable reagents when developing a wide variety of antigen detection assays.
Antibodies demonstrate a strong structure-function relationship (3). Because of this relationship, the unfolding or denaturation temperature measured by DSC is associated with functional differences. In a DSC scan, an unfolding event appears as an endothermic peak that can be approximated as a Gaussian or normal distribution curve. The area under the peak is proportional to the enthalpy change (ΔH) or unfolding and the temperature of the peak maximum (Tm) is related to the Gibbs energy change (ΔG) for unfolding.
Unfolding of a protein is dependent on the non-covalent intramolecular bonds such as hydrophobic interactions, hydrogen bonds, salt bridges, and conformational entropy (4). When the temperature is raised, as in a DSC scan, a protein unfolds and the sum of all of the enthalpy changes are measured and referred to as the ΔHcalorimeter value (ΔHcal). Overall, the protein unfolding event is endothermic as the contribution from breaking hydrogen bonds out-weighs the contribution of the exothermic events such as the disruption of hydrophobic interactions. The unfolding transition for almost all protein domains occurs at a characteristic temperature called the transition midpoint, Tm, where the enthalpy changes and the entropy change, i.e. TΔS, are equal. Since ΔG =ΔH-TΔS and ΔG = 0 at this temperature.
The shape of the peak in the thermogram provides further insight into the properties of the sample. If denaturation occurs within a narrow temperature range, then the transition is considered highly cooperative (5). A thermogram with more than one peak can also be fit with multiple Gaussian models. Proteins that contain multiple domains with differing stability and or highly interactive domains and some oligomeric proteins typically require multiple model fitting of the thermogram data to fully understand the structure-function relationship.
When considering antibodies, there is no typical thermogram. Some exhibit a single peak in the thermogram, others show several distinct peaks, and others show overlapping peaks that appear as shoulders on a larger unfolding peak. The number of peaks observed has been proposed to be related to the flexibility of the hinge region (6). Previous studies on multi-domain proteins suggest these complex thermograms and overlapping peaks arise from interactions between domains (7). Some DSC studies have succeeded in identifying the unfolding temperature of each separate domain within the heavy chain portion (8).

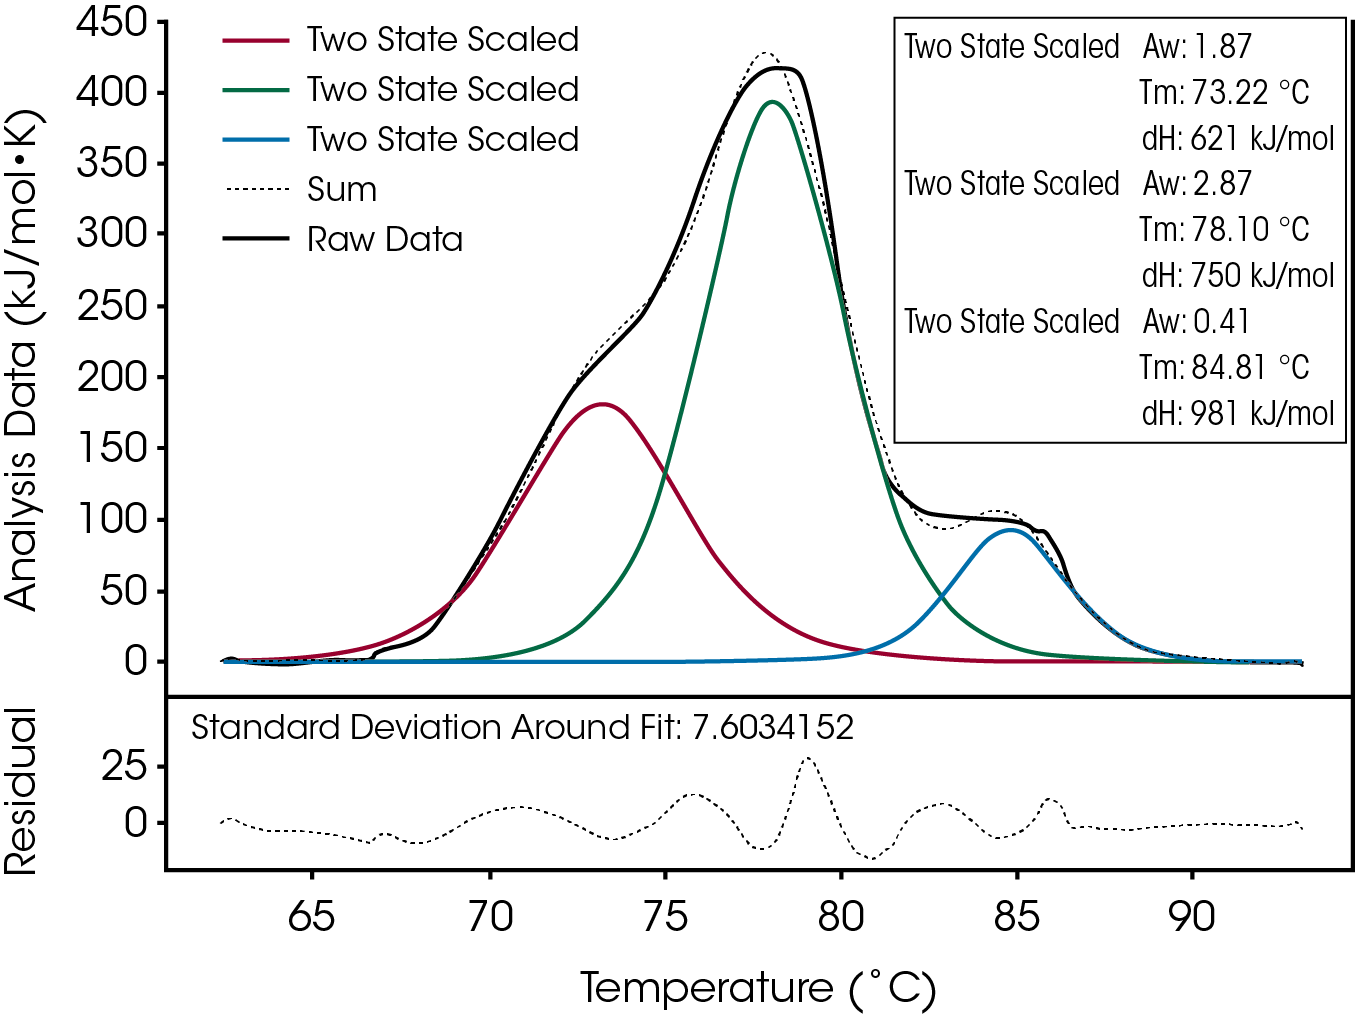
Thermograms are easily deconvoluted with NanoAnalyze™, the analysis software package provided by TA Instruments. This capability is shown in Figure 2, a thermogram of an IgG antibody at a concentration of 2 µM that exhibits these unfolding events. Initially, the data was fit with a single two-state scaled model and then additional models were added as needed. The most appropriate number of models for an optimum fit of the complete thermogram in Figure 2 was three as shown by the plot of the differences between the measured and fitted data. The final choice of the number of domains to fit individually was based on the goodness of the fit (quantitative), the overlap of the sum, shown graphically, (qualitative), as well as additional relevant information obtained from references in the literature to similar antibody systems (4).
In Figure 2, the first unfolding event was attributed to the CH2 domain, the second to the Fab domain, and the third, a high temperature event, to the CH3 domain. Previous data published by Wen in 2008 (8) assisted in the analysis of the thermogram and allowed an accurate assignment of the individual domains to specific peaks or shoulders in the thermogram. The unfolding of the three domains was not resolved into three separate peaks, indicating that these processes were influencing the final thermogram shape. Despite the fact that these peaks were not resolved, the fitting algorithms were able to successfully and accurately deconvolute this broad, asymmetrical, unfolding event.
A large enthalpy and a small scaling factor allow for sharp (cooperative) unfolding events to be properly fitted. The enthalpies associated with each domain can be compared only after normalizing the data to obtain the heat associated with unfolding event. Direct comparison of the ΔH values for each event suggests the CH3 domain make the largest contribution to overall enthalpy. However, to give a rank order to the contributions of each domain, the product of the Aw and ΔHvan’t Hoff for each individual domain should be compared. The sum of the product of the scaling factors, Aw, and the enthalpies, ΔHvan’t Hoff, of the fit yields the total ΔHcal. For the antibody in Figure 2, this value is 3716 kJ/mol and 58% of the heat originates from the Fab portion and only 11% originates from the CH3 domain, which is consistent with their relative sizes.

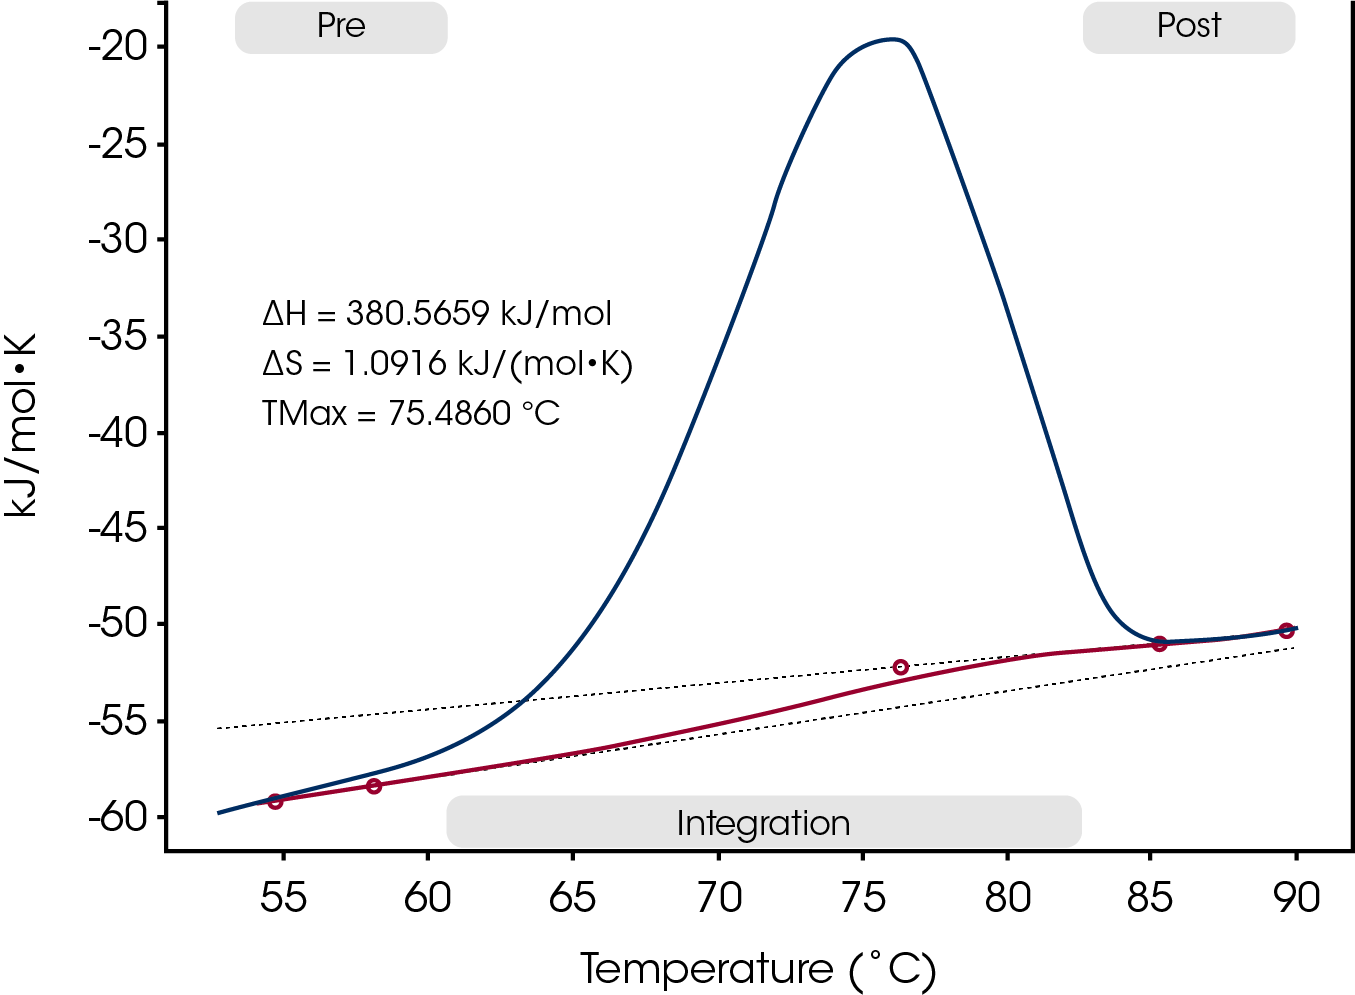
A second example, Figure 3, is of another antibody that exhibits only a single skewed peak in the thermogram. A sigmoid baseline is applied to the data to account for the significant change in heat capacity accompanying the unfolding.
The DSC thermogram for the antibody in Figure 3 was also asymmetrical. Since limited information was available concerning the domain structure of this sample, several different analyses were applied. The first was the general model, which in addition to the ΔH and Tm values, a heat capacity (ΔCp) value could be determined from the model. During the unfolding process the heat capacity (ΔCp) of a protein also changes. ΔCp is almost always positive: a denatured protein has a higher heat capacity than the native folded protein. The heat capacity changes are due to restructuring of solvent molecules around the non-polar side chains exposed to solvent during the unfolding process (9). Therefore, the magnitude of ΔCp is dependent on the number of hydrophobic side chains that were buried in the native conformation.
After examining the residual and the magnitude of the ΔCp from the fitted data it was determined that the asymmetry restricted the ability of this model to fit the data. Two other fitting routines were applied, one with a single model and the other with two models. Although the data was fit better with two models versus one, the residual and the standard deviation had insignificant change as more variable were added.
Rather than over fit or incorrectly fit the data, Tmax, ΔHcal and ΔCp were reported. For this type of analysis, the data is converted to molar heat capacity (MHC), a sigmoidal baseline is applied, and the area under the entire unfolding curve is quantified and normalized. The magnitude of ΔCp was determined manually by subtracting the average of several data points after the unfolding transition from the average of several data points before the unfolding transition. The ΔCp determined was 7.24 kJmol-1K-1.
The type of analysis for an antibody thermogram depends on the particular structural characteristics of each individual antibody. Although the asymmetrical shape in Figure 3 could indicate that there are domains unfolding independently of each other, there is an alternative explanation. The unfolding may not be a true two-state (folded or unfolded) process. Without further subunit analysis or other biophysical information on the antibody structure, the analysis was kept as simple as possible and the enthalpy reported was free of modeling.
The Nano DSC is an essential tool for scientists working with antibodies to characterize the structure-function relationships that may exist. Antibodies are complex proteins and when analyzing structural thermodynamics, require such an instrument and data analysis software capabilities that will allow one to fully differentiate between individual and interacting domains and report accurate Tm values. The combination of the Nano DSC and NanoAnalyze™ can facilitate these needs.

References
- Alberts, B.; Johnson, A.; Lewis, J.; Roff, M.; Roberts, K.; Walter, P., Eds. Molecular Biology of The Cell. 4th Edition. Garland Science: Group, New York, N.Y., 2000.
- Wikipedia. Antibody. http://en.wikipedia.org/wiki/Antibody (accessed August 11, 2011).
- Alzari, P.M.; Lascombe, M.B. and Poljak, R.J. Annu. Rev. Immunol., 1988, 6,555-580.
- Bruylants, G.; Wouters, J.; Michaux, C. Current Medicinal Chemistry, 2005, 12, 2011-2020.
- Wright, D.J.; Leach, I.B.; Wilding, P. J. Sci Food Agric., 1977, 28, 557.
- Oi, V.T.; Vuong, T.M.; Hardy, R.; Dangl, J.; Herzenbrg, L.A.; Stryer, L. Nature, 1984, 136-140.
- Privalov, P.L. and Putekhin, S.A. Methods Enzymol., 1986, 131, 4- 51.
- Wen, J.; Jiang, Y. American Pharm. Rev., 2008, 11, 98.
- Gomez, J.; Hilser, V.J.; Xie, D.; Freire, E. Proteins, 1995, 22, 404.
Acknowledgement
This note was written by Colette F. Quinn, Ph.D. and Neil A. Demarse, Ph.D., TA Instruments.
Click here to download the printable version of this application note.

