Keywords: Rheology, food, viscosity, viscoelasticity, rheometers
RH105
Case Study
Many foods are currently being reformulated to reduce their fat levels so that they appeal to the health-conscious consumer. While reduction of fat content is desirable, manufacturers must be careful during reformulation to ensure product texture and taste are not inadvertently affected. In many foods, such as mayonnaise, these properties, among many others, are directly related to the emulsified fat content. Consumer taste panels can help with the process of testing new low-fat products, but they are expensive and subjective, rather than strictly quantitative.
Solution
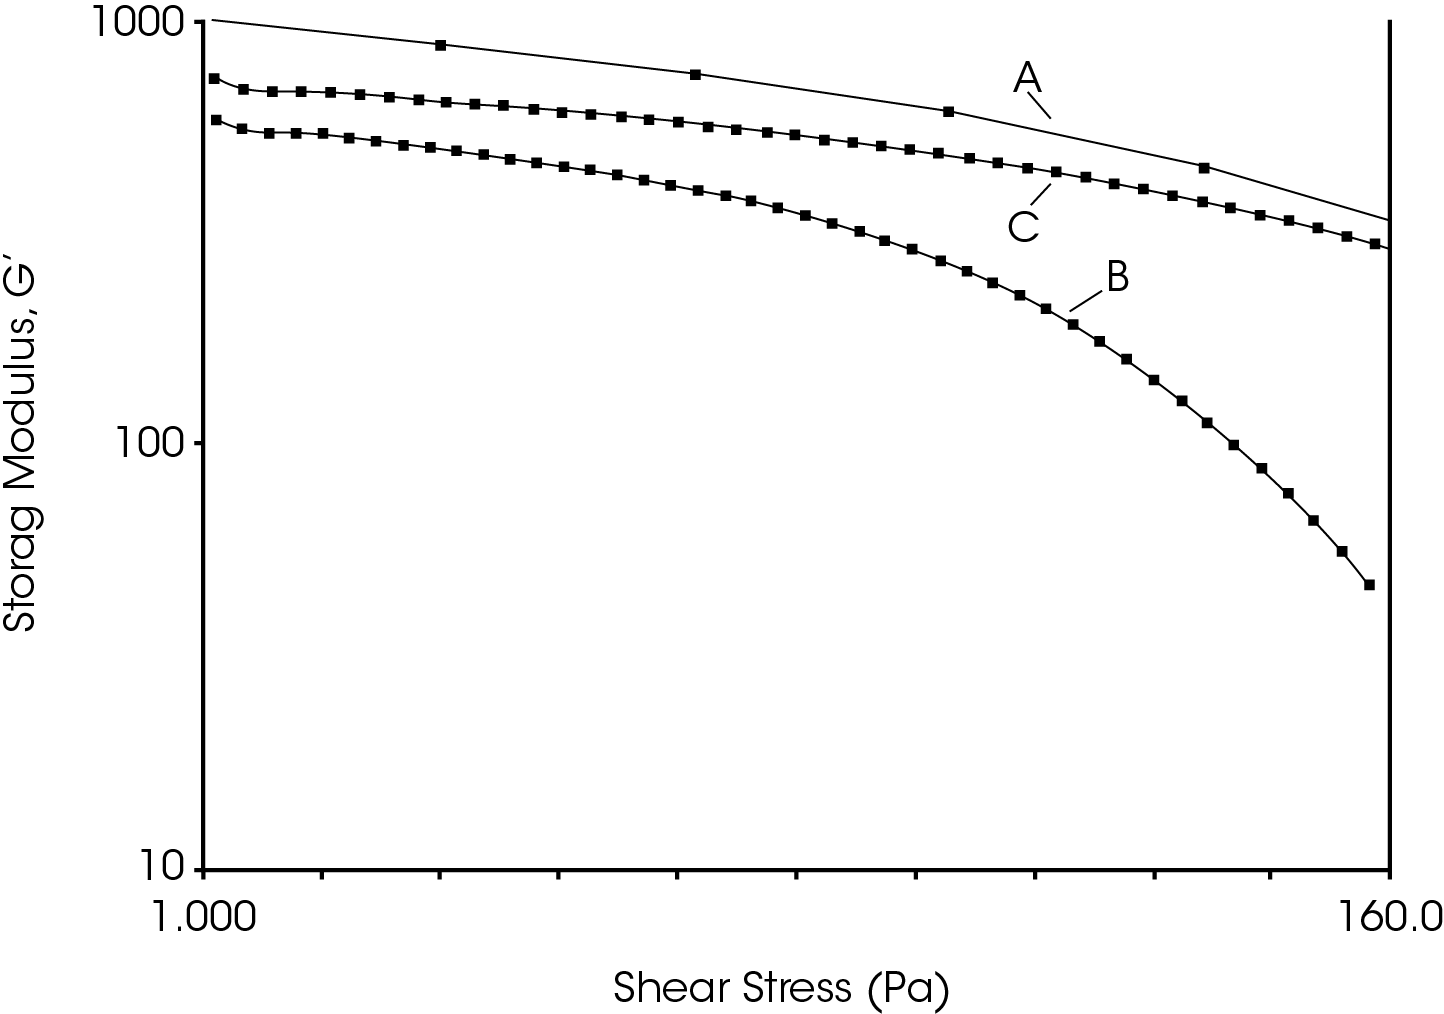
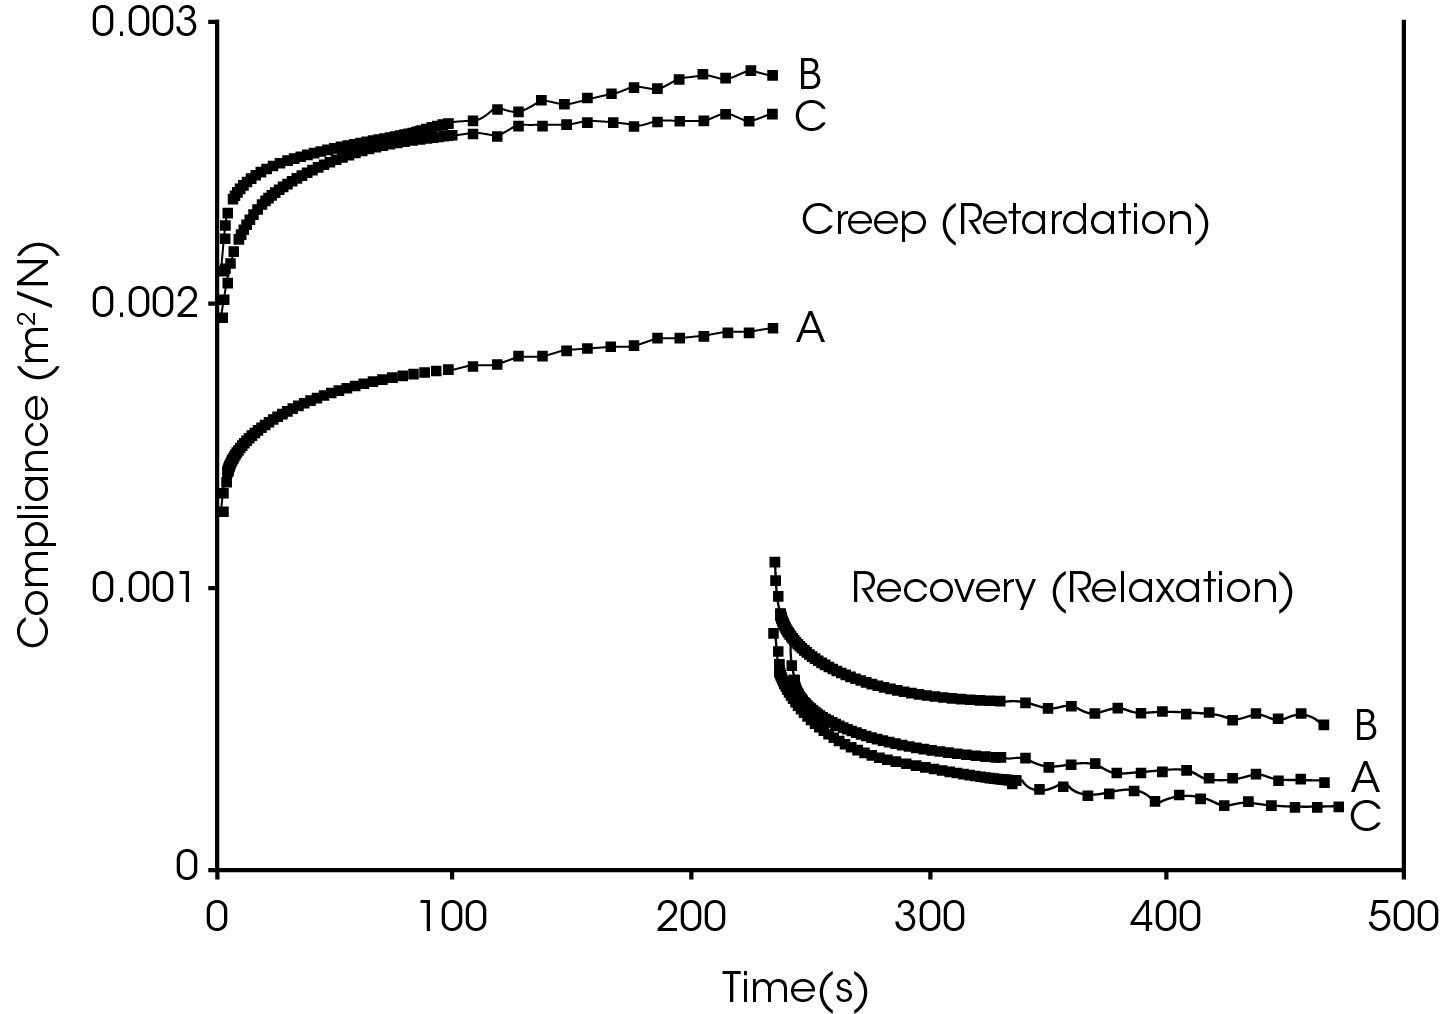
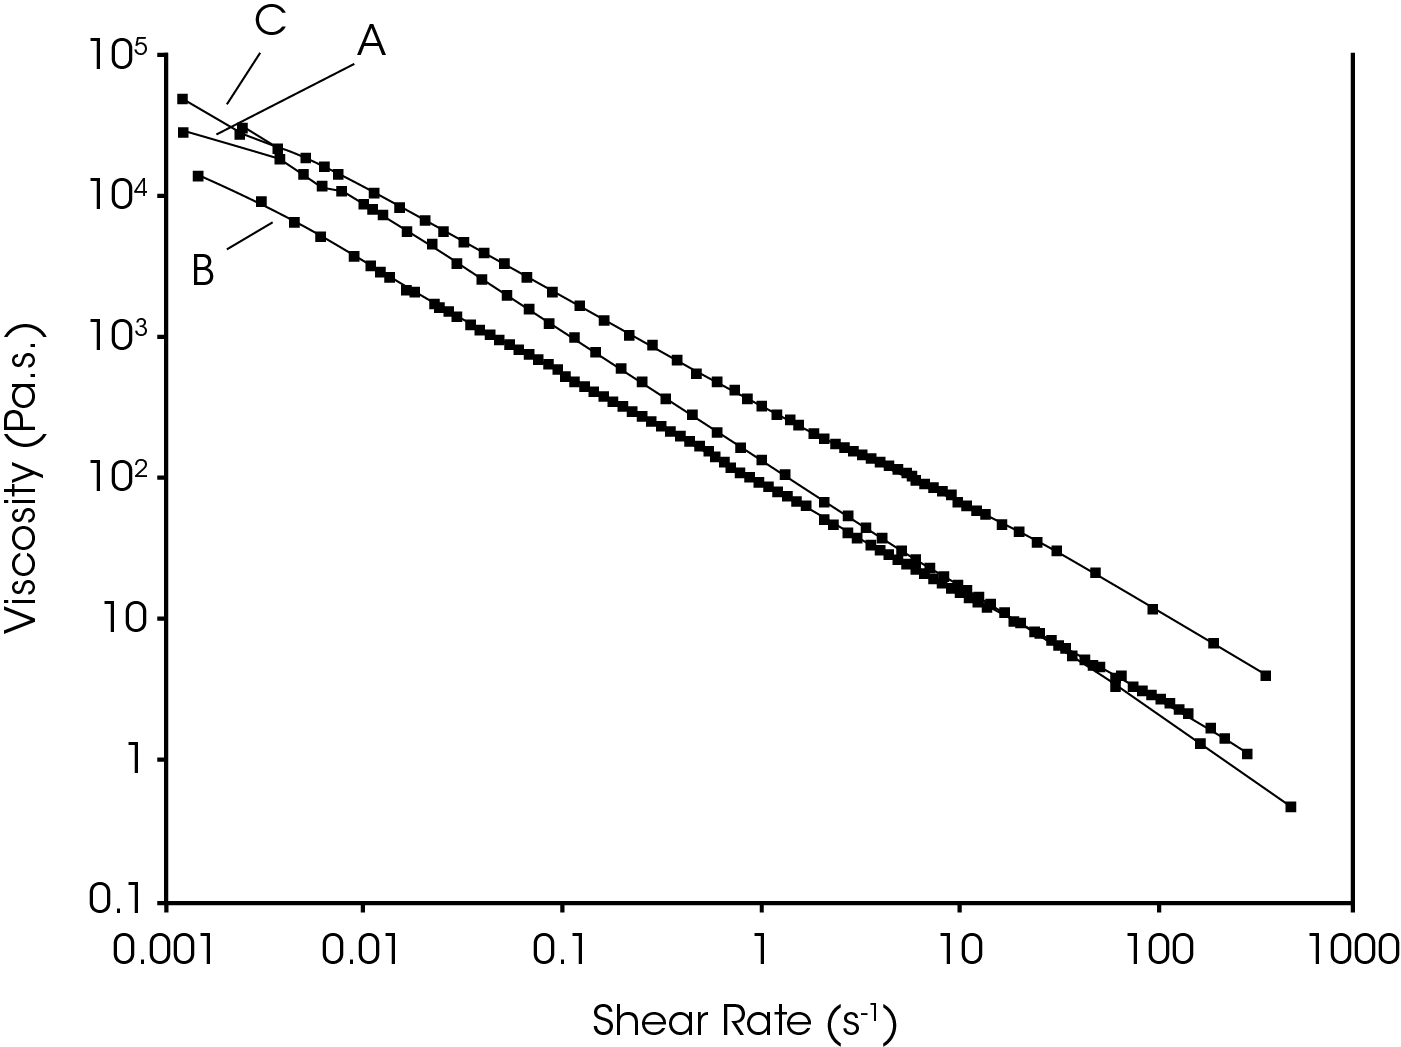
Rheology has long been recognized to be a useful index in relating the physical properties of viscosity and viscoelastic moduli to food texture and consumer perception of the product. Figures 1-3, for example, reflect the results obtained from rheological evaluations of several commercial mayonnaise products using a rotational rheometer equipped with an acrylic cone and plate geometry designed for optimal sensitivity and low inertia. The three mayonnaise products, subsequently referred to as A, B, and C, contained 11g, 7g, and 3g of fat per serving, respectively. Only product C was advertised as a ‘reduced fat’ product.
Figure 1 shows comparative oscillation results for the three products, with the storage modulus (G’) plotted against stress amplitude at a constant frequency of 1 Hz. This test indicates the limits of linear viscoelastic behavior as well as providing quantitation of this viscoelastic parameter. Dynamic tests are normally the most sensitive way of resolving differences in the samples at rest, which relates to the structure a consumer would encounter when spooning the product from the jar. Mayonnaise A had the highest elasticity indicating the strongest “gel” structure and should appear thickest when dispensed. Figure 2 shows creep curves (retardation and relaxation). Creep tests examine the way the products respond to steady low stresses such as under gravity after spooning. Again, product A exhibited the greatest rigidity (lowest compliance) and should appear richest. Creep indicated only subtle differences between B and C, but B shows less recovery than C.

Finally, Figure 3 shows simple flow curves for the products relating viscosity to shear rate. Flow behavior relates to “spreadability” and although all three products three product demonstrate shear thinning behavior, the relative viscosities indicated that B should spread more easily than the other two. This trait might cause consumers to perceive the product as lacking in richness, even though its fat content is higher than C.
Ultimately, the researcher needs to determine which rheology measurements provide the best correlation with favorable consumer perceptions of the product. Nevertheless, flow tests are probably of most interest to the rheology neophyte. Mouth feel and chewing, for example, have been successfully correlated with flow tests at intermediate shear rates (50- 100 s-1).


Acknowledgement
Based on studies by Peter Whittingstall at TA Instruments
Click here to download the printable version of this application note.

