Keywords: polymers, DMA, glass transition, viscoelasticity, modulus, elasticity
TA441
Introduction
Thermoplastic and thermoset solids are routinely tested using Dynamic Mechanical Analysis or DMA to obtain accurate measurements of such as the glass transition temperature (Tg), modulus (G’) and damping (tan δ). These measurements are used to predict practical use temperatures, impact properties, energy dissipation, stiffness and many other performance properties. Combined with rheology and other analytical techniques, DMA can provide critical structure-property relationships that tie the material chemistry and microstructure to the performance properties of the finished product about.
When samples are mechanically perturbed in an oscillatory fashion, the following information can be obtained:
Storage modulus (E’ or G’) and loss modulus (E” or G”)
The storage modulus represents the amount of energy stored in the elastic structure of the sample. It is also referred to as the elastic modulus and denoted as E’ (when measured in tension, compression or bending) and G’ (when measured in shear). The loss modulus represents the viscous part or the amount of energy dissipated in the sample. It is also referred to as the viscous modulus and denoted as E” (when measured in tension, compression or bending) or G” (when measured in shear).
If storage modulus is greater than the loss modulus, then the material can be regarded as mainly elastic. Conversely, if loss modulus is greater than storage modulus, then the material is predominantly viscous (it will dissipate more energy than it can store, like a flowing liquid). Since any polymeric material will exhibit both storage and loss modulus, they are termed as viscoelastic, and the measurements on the DMA are termed as viscoelastic measurements.
Damping or Loss factor
The ratio of the loss modulus to the storage modulus is defined as the damping factor or loss factor and denoted as tan δ. Tan δ indicates the relative degree of energy dissipation or damping of the material. For example, a material with a tan δ > 1 will exhibit more damping than a material with a tan δ < 1, because the loss modulus is greater than the storage modulus in the former, which means the energy dissipating, viscous mechanisms will have a greater influence on the final properties of the material.
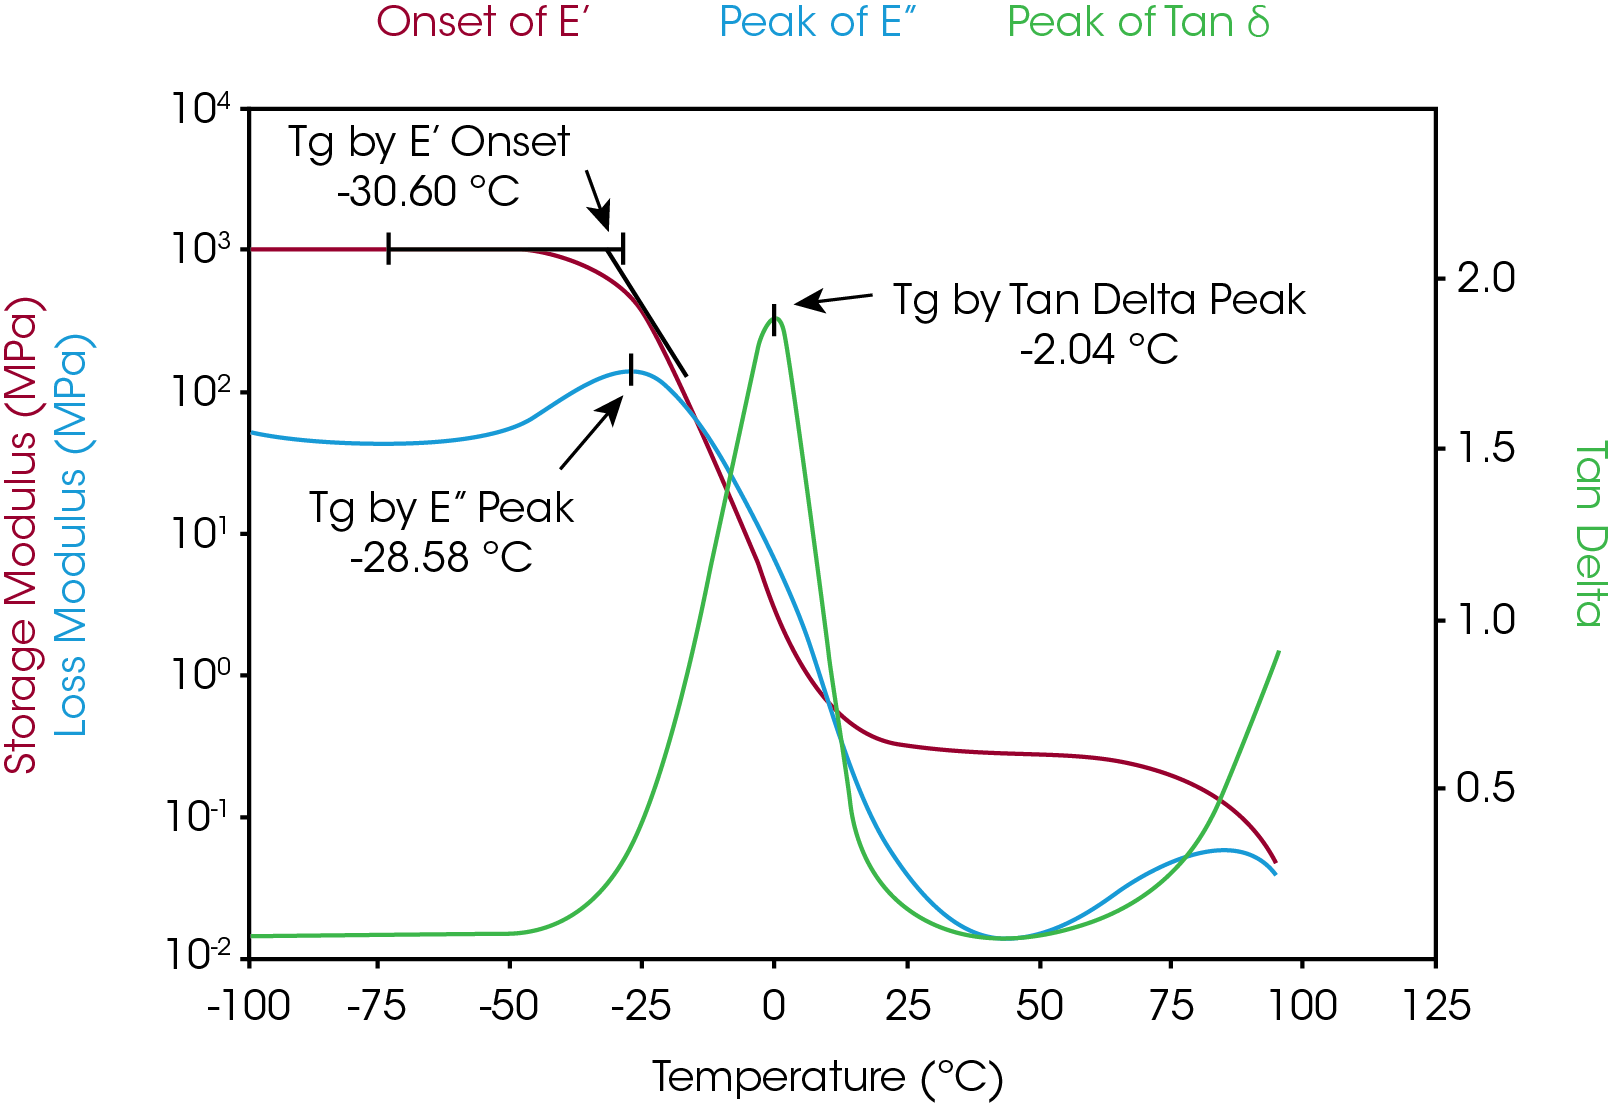
When the storage modulus, loss modulus and tan delta are measured as a function of changing temperature, it can show different transitions depending on the material chemistry. These transitions provide invaluable information about the material’s thermal and mechanical properties, including the glass transition temperature, which can then be used as a metric for quality control,predicting product performance, and optimizing the processing conditions or heat history. A representative example is shown in Figure 1 below for an amorphous polymer.
It is important to note that the use of DMA for glass transition measurements is a detailed topic that will be covered in a separate application note. For the purposes of discussion, we note that the the glass transition temperature as measured by the onset point of storage modulus will be different than that measured by the peak of loss modulus or tan delta. Each method of measuring the Tg has its own merit, but it is critical that the same method is used for performing relative comparisons between different samples.
Application Examples
Polymer Blends
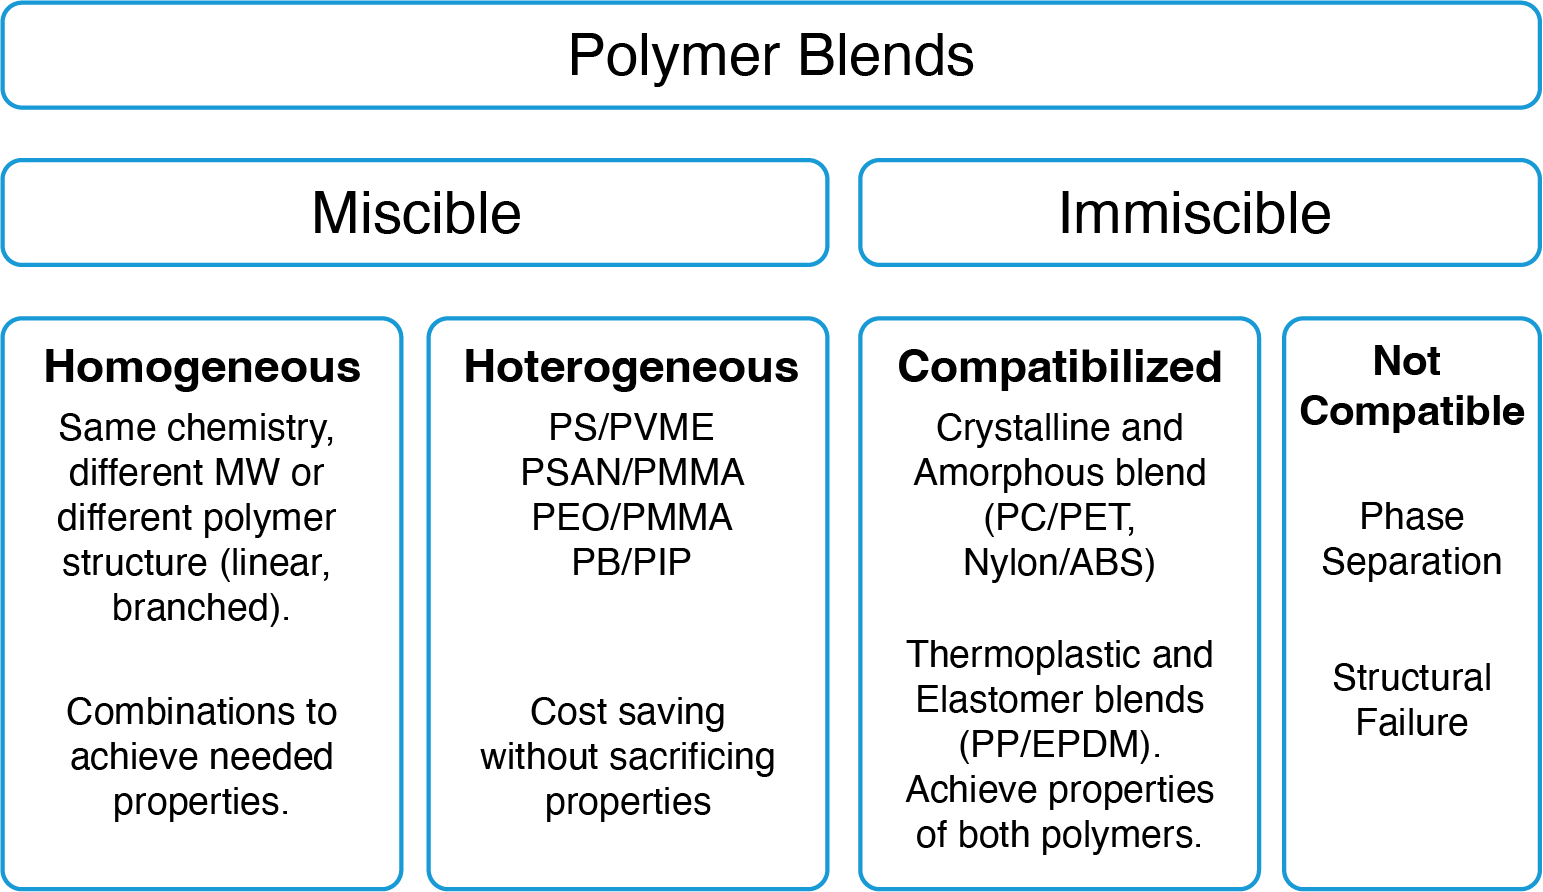
A polymer blend or mixture is analogous to metal alloys, in which at least two polymers are combined to create a new material with different physical properties. Polymer blends can be broadly divided as shown below.
Blends are heterogeneous or incompatible if the components are present in separate phases. Usually the minor component is dispersed in a matrix of the dominant component. Whether a blend is compatible or not,also depends on temperature; in this case the blend is considered partially miscible. If blends are incompatible, mechanical energy is needed to disperse the minor phase (mixing) and coalescence occurs if the blend morphology is not stabilized. Interfacial forces such as the interfacial tension become important and can change the rheological signature of the blend significantly.
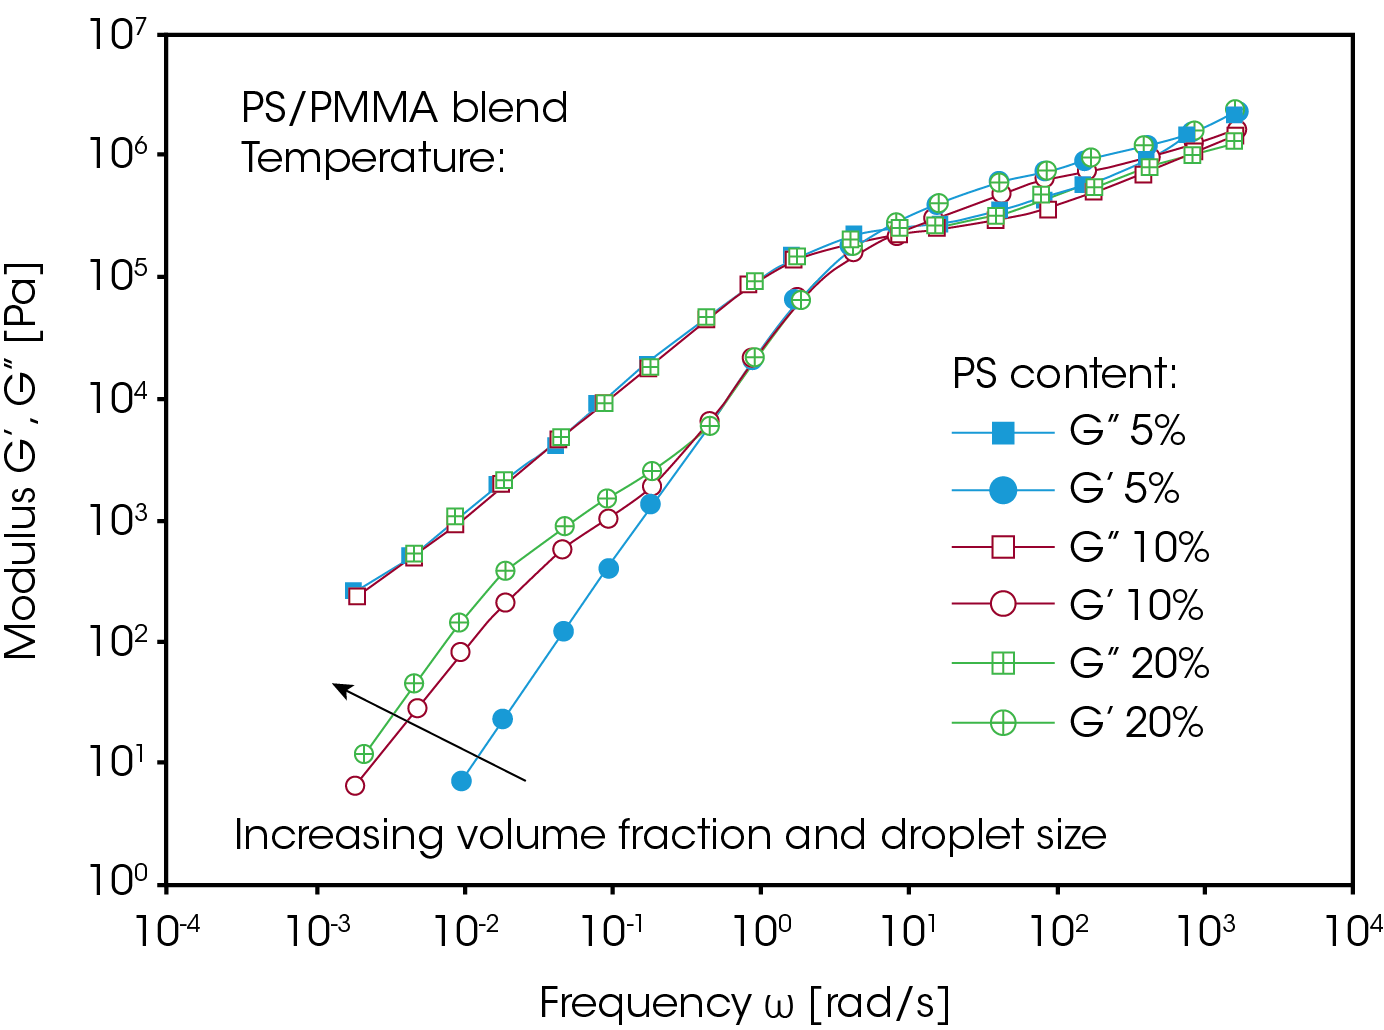
Moreover, the elastic properties of non-compatible blends depend on energy storage mechanisms at the interphase. The relaxation of the dispersed phase itself is often much longer than the relaxation of the polymer chains of the individual components. Figure 2 shows the dynamic spectrum of a PMMA/PS blend with different volume fractions of the minor phase1. The additional low frequency contributions in G’ are due to the form relaxations of the large dispersed domains of the minor phase. If the average droplet size is known (from TEM for example), the interfacial tension can be calculated from the average relaxation time of the droplet relaxation.
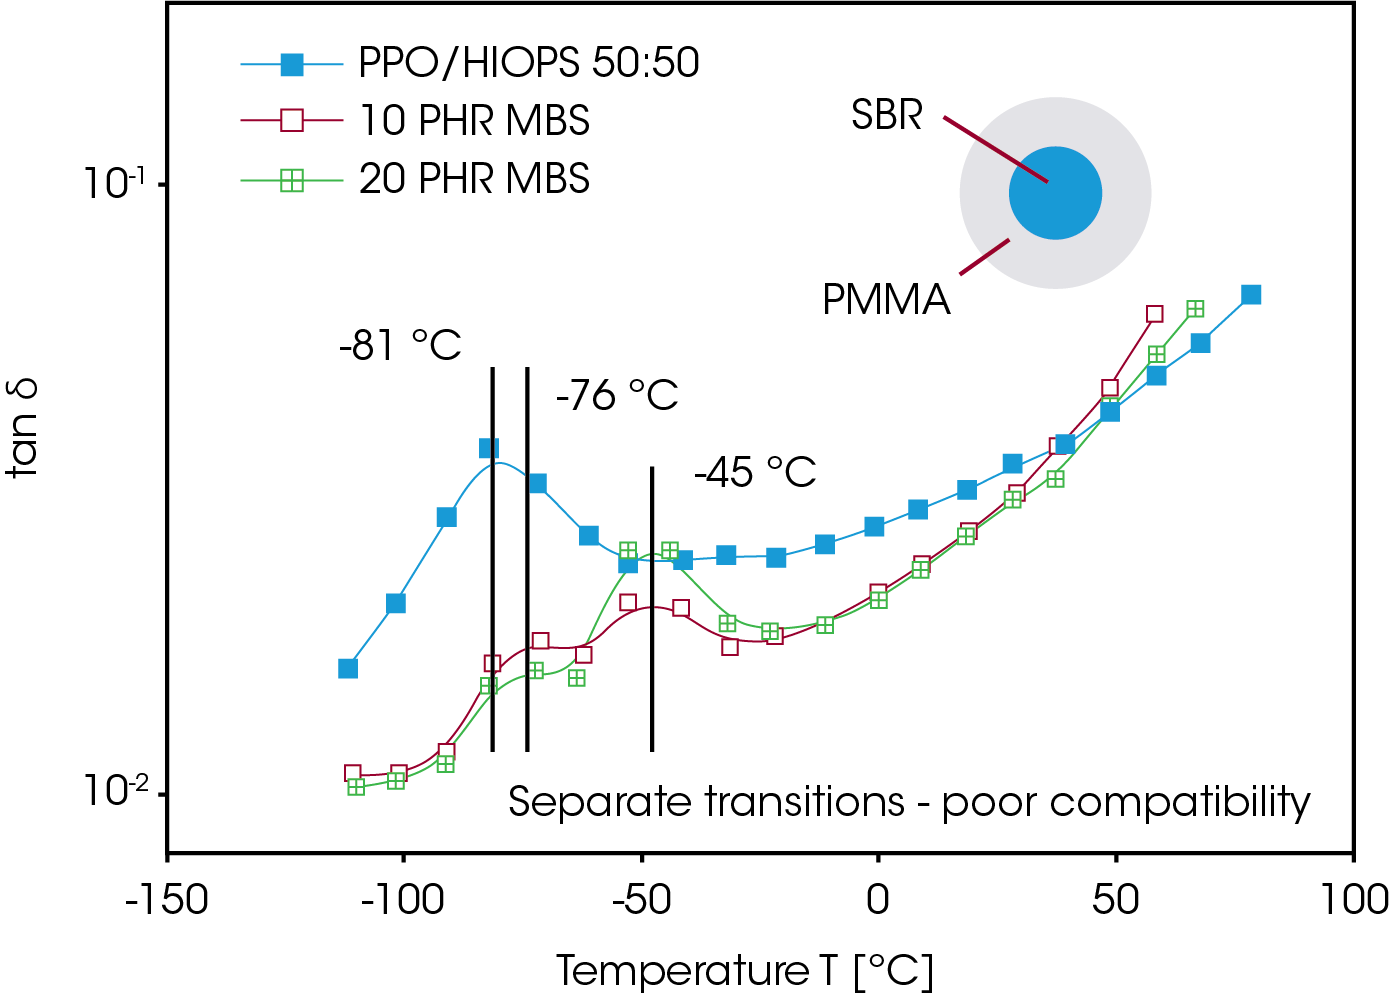
Incompatible blends show distinct glass transitions for each component. However, the value may change in relation to the pure components. Homogeneous blends exhibit only one glass transition. Thus the evaluation of the glass transitions provides information about compatibility and interphase effects. Figure 3 shows the tan δ trace of an PPO/HIPS 50:50 blend, modified with MBS a (methyl-metacrylatebutadiene- styrene) copolymer2. The modifier shows as an additional transition at -45 °C, independent of the concentration. The poor compatibility is a result of the specific structure of the MBS, which consists of a PMMA shell imbedding a core of SB rubber.
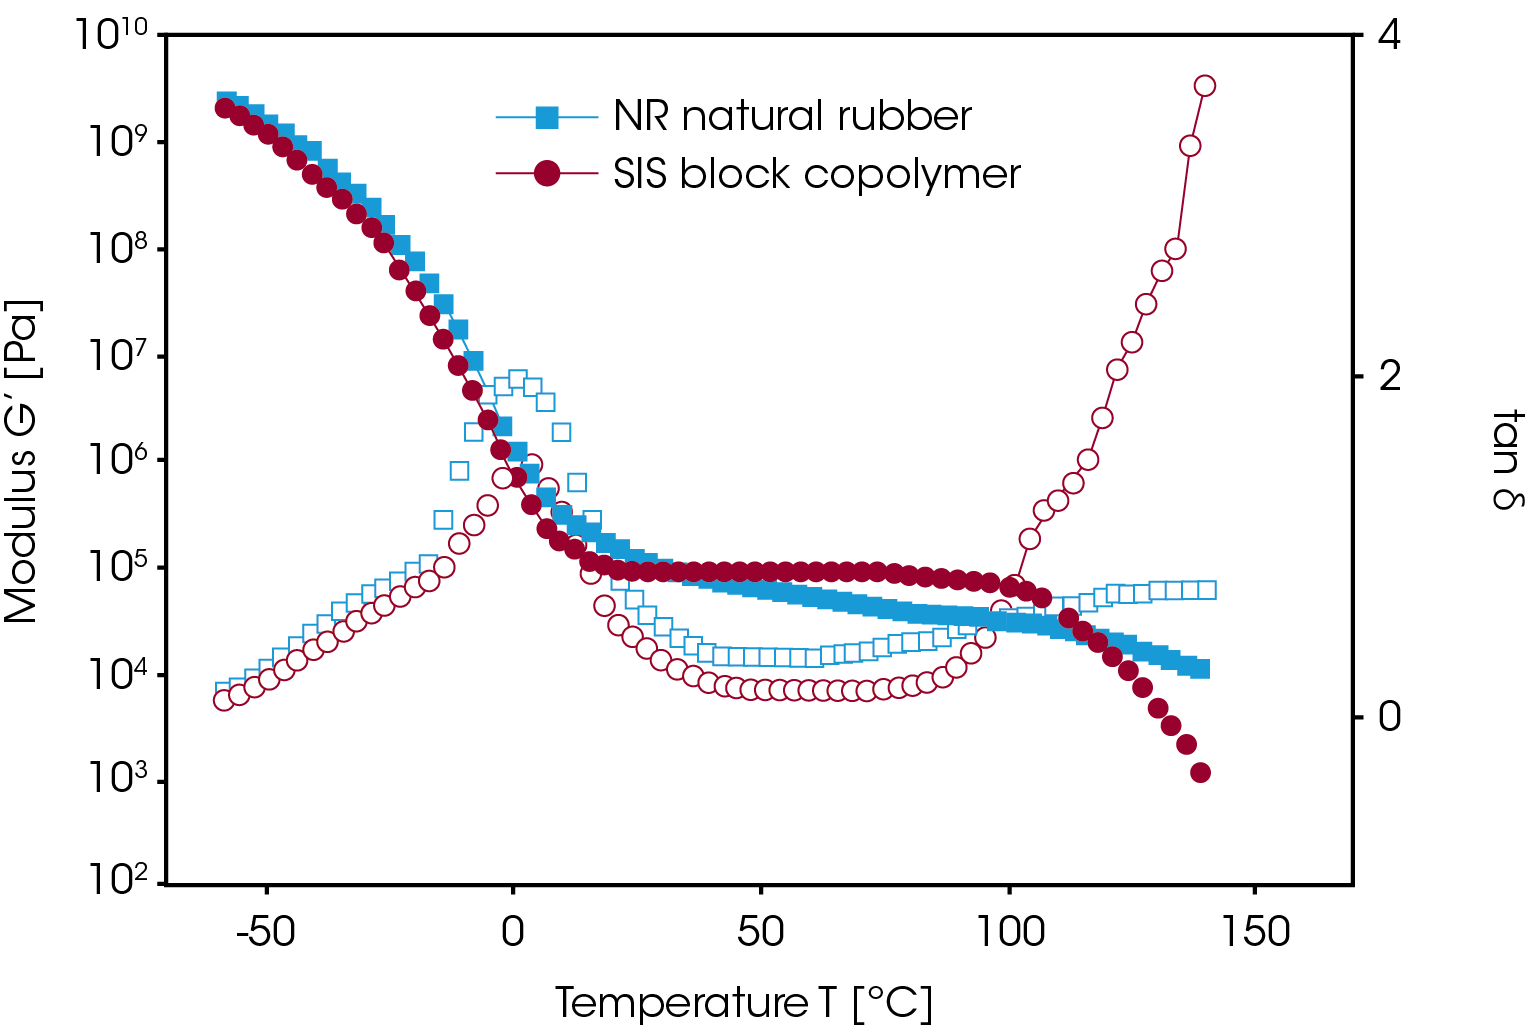
Blending also provides a means to modify the elastic modulus. Pressure sensitive adhesives PSA have the best adhesion properties when the modulus is between 5×10⁵ and 105 Pa at use temperature. By varying the content of tackifying resins in a natural or synthetic rubber matrix, the modulus can be adjusted as required (Figure 4).
Process flows induce orientation of the dispersed phase in non- compatible blends. As a result of this fact, the morphology can be modified to change the final product specific properties; a good example is the improved gas barrier in blow molded beverage bottles. Since non-compatible blends undergo coalescence in the melt state, compatibalizers such as copolymers are added to stabilize the morphology. Another technique to stabilize the morphology is reactive blending, which involves in situ chemical reactions at the interphase.
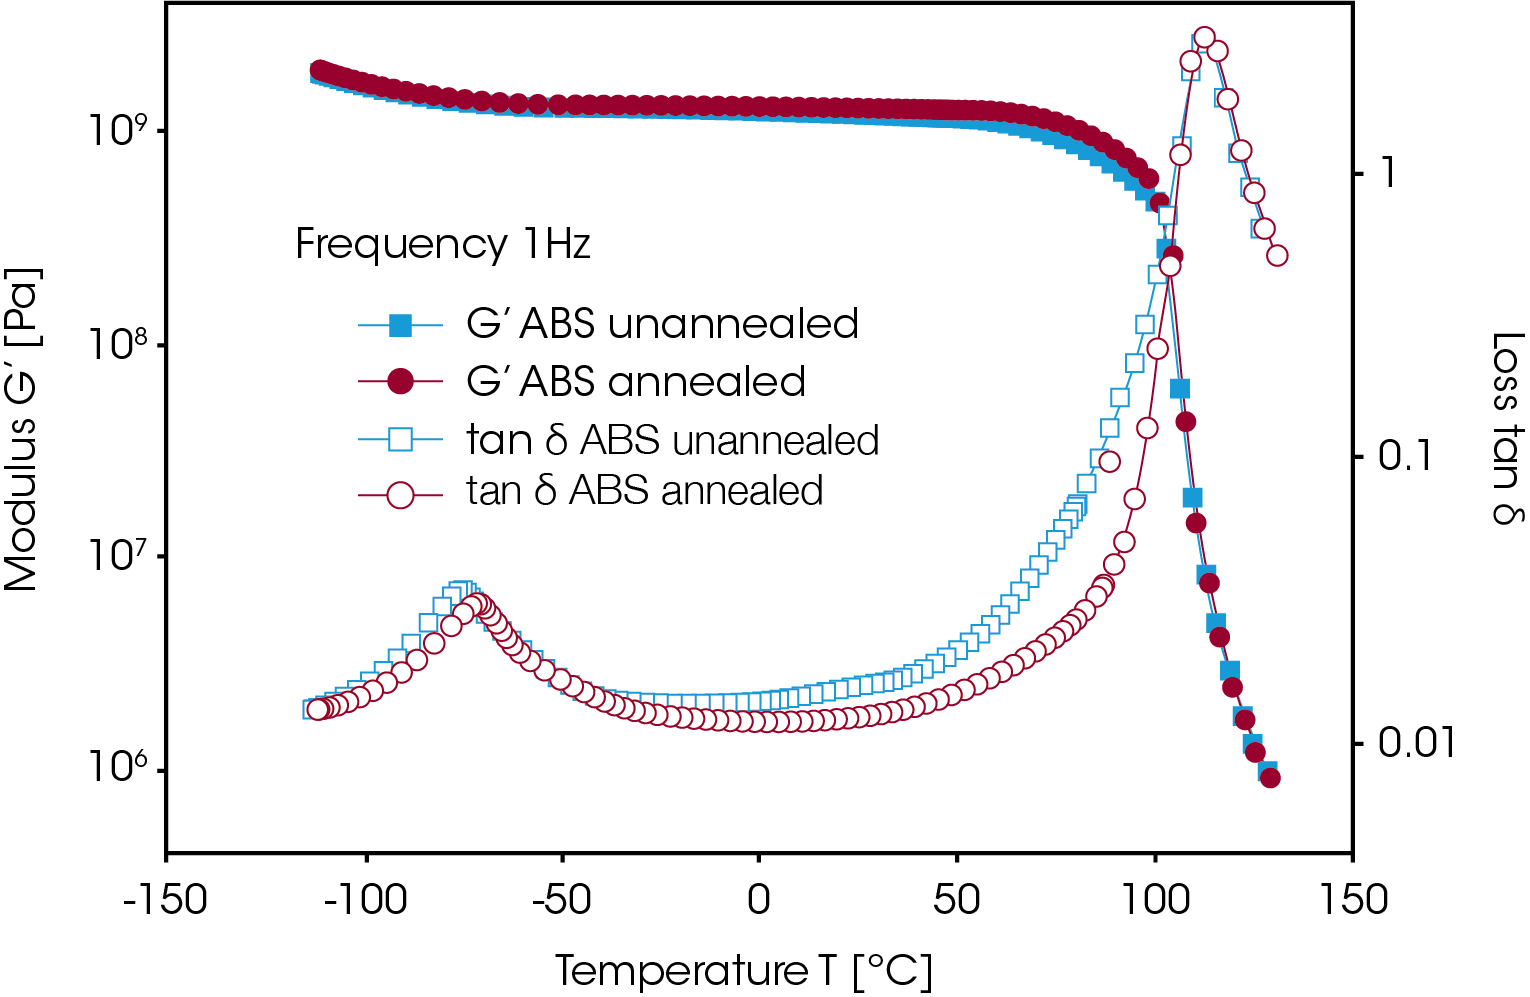
Sporadic surface crazing and cracking problems on the molded ABS parts are a result of too much orientation and residual strains. Torsion tests on the solid sample in the glass transition region can be used to perform relative comparisons of the amount of residual strains in an injection molded part. The data shown in Figure 5 are DMA traces on freshly molded samples and on companion pieces annealed under vacuum for eight hours at 180 °C. The storage modulus G’ and tan δ were measured at a frequency of 1 Hz and a strain of 0,07% at temperatures from -120 °C to 130 °C. Clear differences were found between the annealed and unannealed samples between 0 °C and 100 °C: the sample with residual strains had a higher tan δ over a wide range of temperatures below the glass transition temperature Tg. This relates to the relaxation of the backbone conformations of the oriented styrene-acrylonitrile component in the continuous phase. The intensification of the loss dispersion just below the glass transition is a sensitive monitor of molecular orientations in polymers.
Effect of multi-stage drawing and moisture on the morphology of fibers
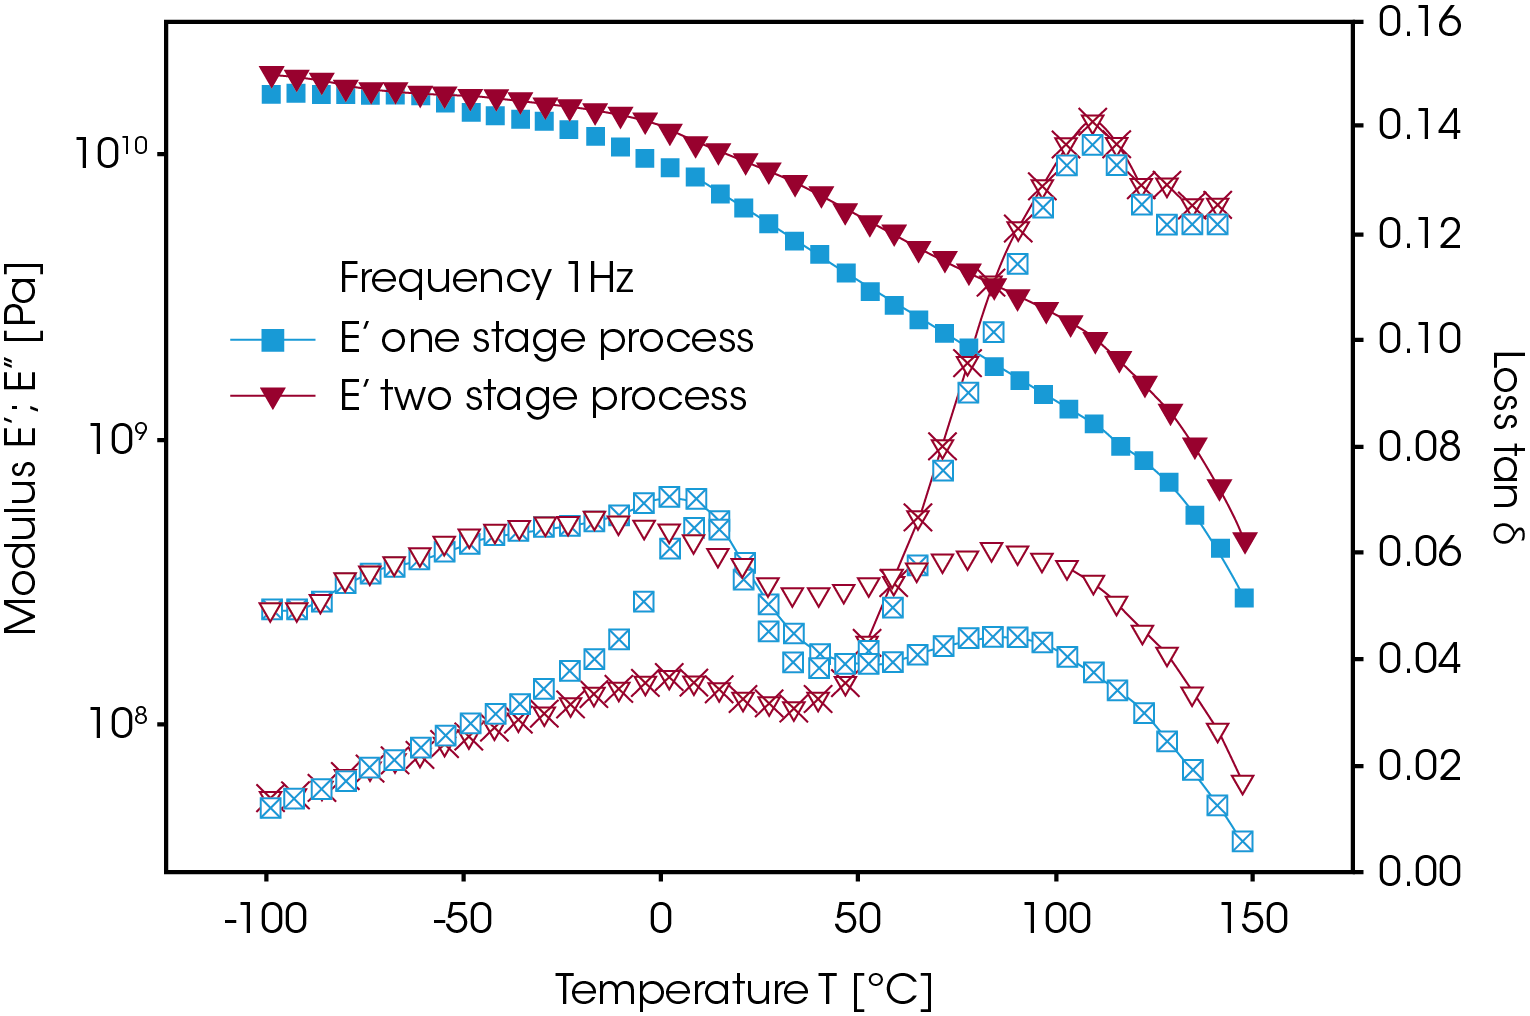
The morphology and final performance of synthetic fibers depend to a large extent on their processing conditions. The extent and rate of draw is an important variable, with significant effects on the final properties. The drawing process results in molecular orientation and may enhance crystallization as well as orient the crystals themselves3. Both phenomena impart high strength and can affect end- use performance. The glass transition is a good indicator of morphological changes and the change in size of the transition can be related to changes in crystallinity4. Figure 6 shows the elastic modulus and the damping of two fibers from the same PP grade drawn down to the same extent; one fiber was drawn down by a one stage process while the second was produced in a two-stage process. The two-stage drawn fiber has a higher elastic modulus at temperatures above the glass transition (-11.5 °C). This can be related to increased crystallinity due to a higher degree of orientation5. Although the glass transition at -11.5 °C is the same for the two fibers, does the two-stage drawn fiber show a smaller damping peak which also indicates a higher crystallinity. If crystalline and amorphous phases coexist in a material, then a reduced damping peak corresponds to an increased degree of crystallinity. These crystalline regions act as crosslinking points that inhibit the sliding motion of the molecular chains, thus providing a fiber which exhibits greater strength.
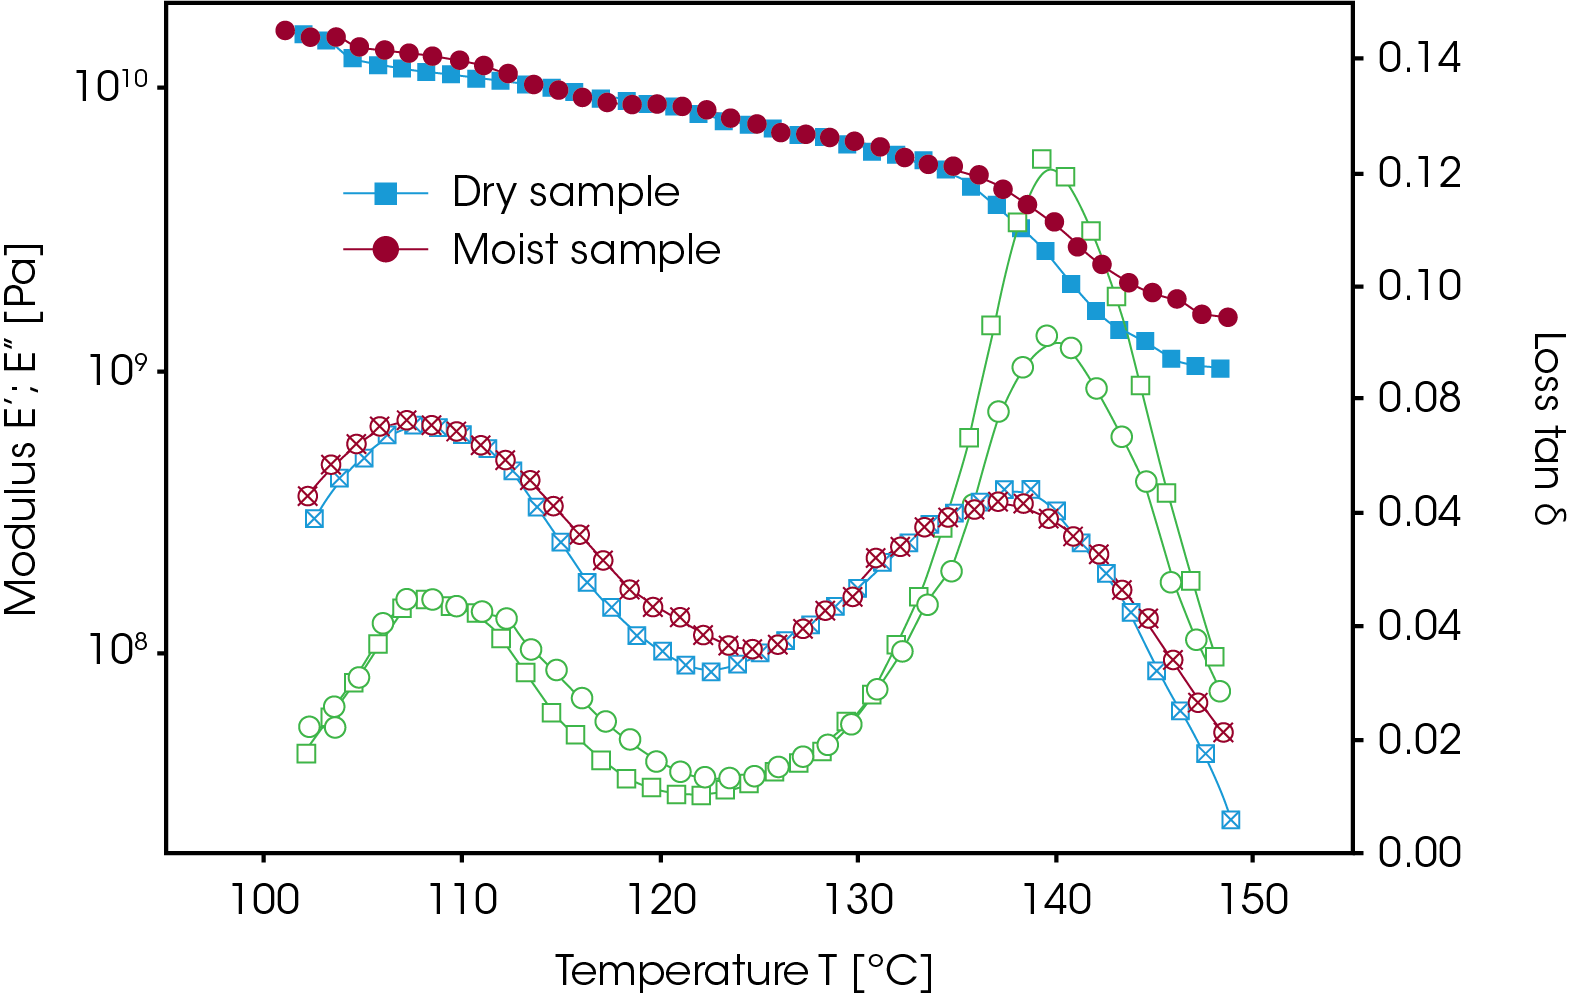
In condensation products such as nylon, the moisture content of the resin is a critical variable. In Figure 7, the DMA traces of nylon fibers made from moist and pre-dried pellets in an extrusion process are shown. The elastic modulus of the moist pellets has a higher value above the glass transition, which is evidently due to crosslinking reactions during the extrusion process. On the tan δ curve, both Tg and the ß transition occur at the same temperature. Clearly the pre- dried sample has a higher damping peak than did the moist sample. Since the moisture content can affect the degree of crystallinity, the pre-dried sample would produce a fiber with a lower degree of crystallinity. In this situation, the moisture plasticizes the nylon and greatly increases the crystallization kinetics.
Improving the Impact Behavior of Polystyrene Juice Cans
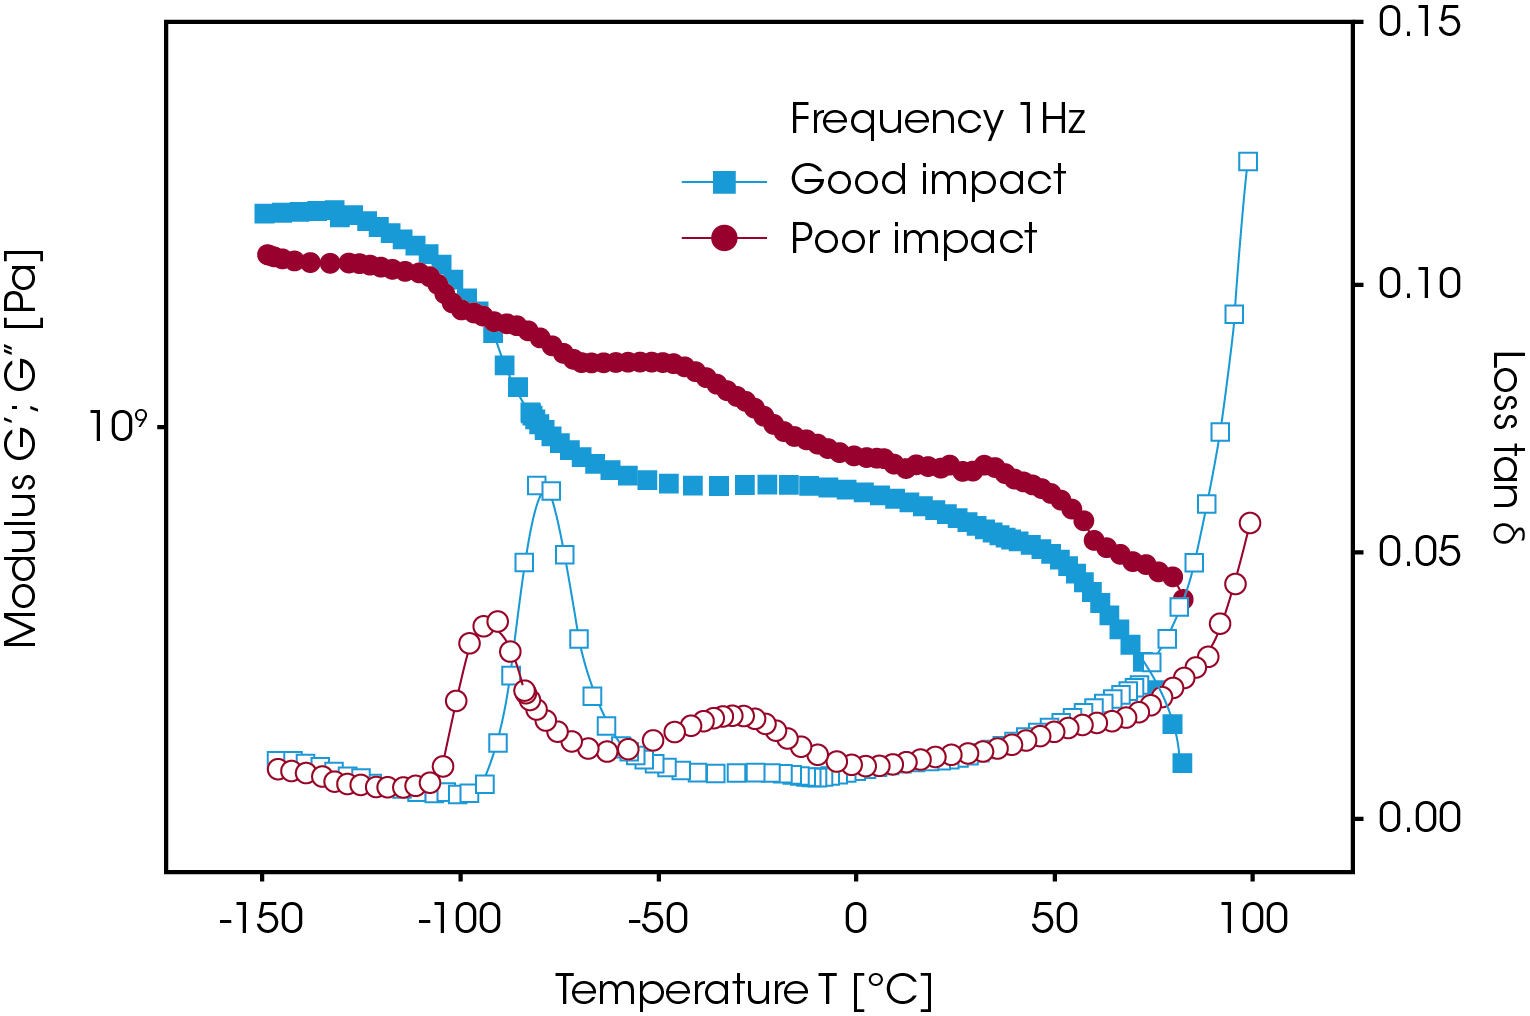
Orange juice can be molded from rubber-modified high impact polystyrene (HIPS) resins exhibited variations in impact resistance. High impact phenomena are related to mechanical deformations in the order of milliseconds. Due to the equivalence of time and temperature, fast mechanical processes at ambient temperature correlate with low speed testing at low temperature. As such energy absorption, represented by the magnitude of tan δ at the ß peak, measured at frequencies of 1Hz correlate to toughness and impact resistance (Figure 8). The shift in the glass transition temperature Tg and the ß peak is due to compounding effects either to compatibilization of the rubber and polymer phase. In this instance, the differences in tan δ result from variations in the quantity and type of rubber impact modifier.
Toughness and flexibility of adhesives
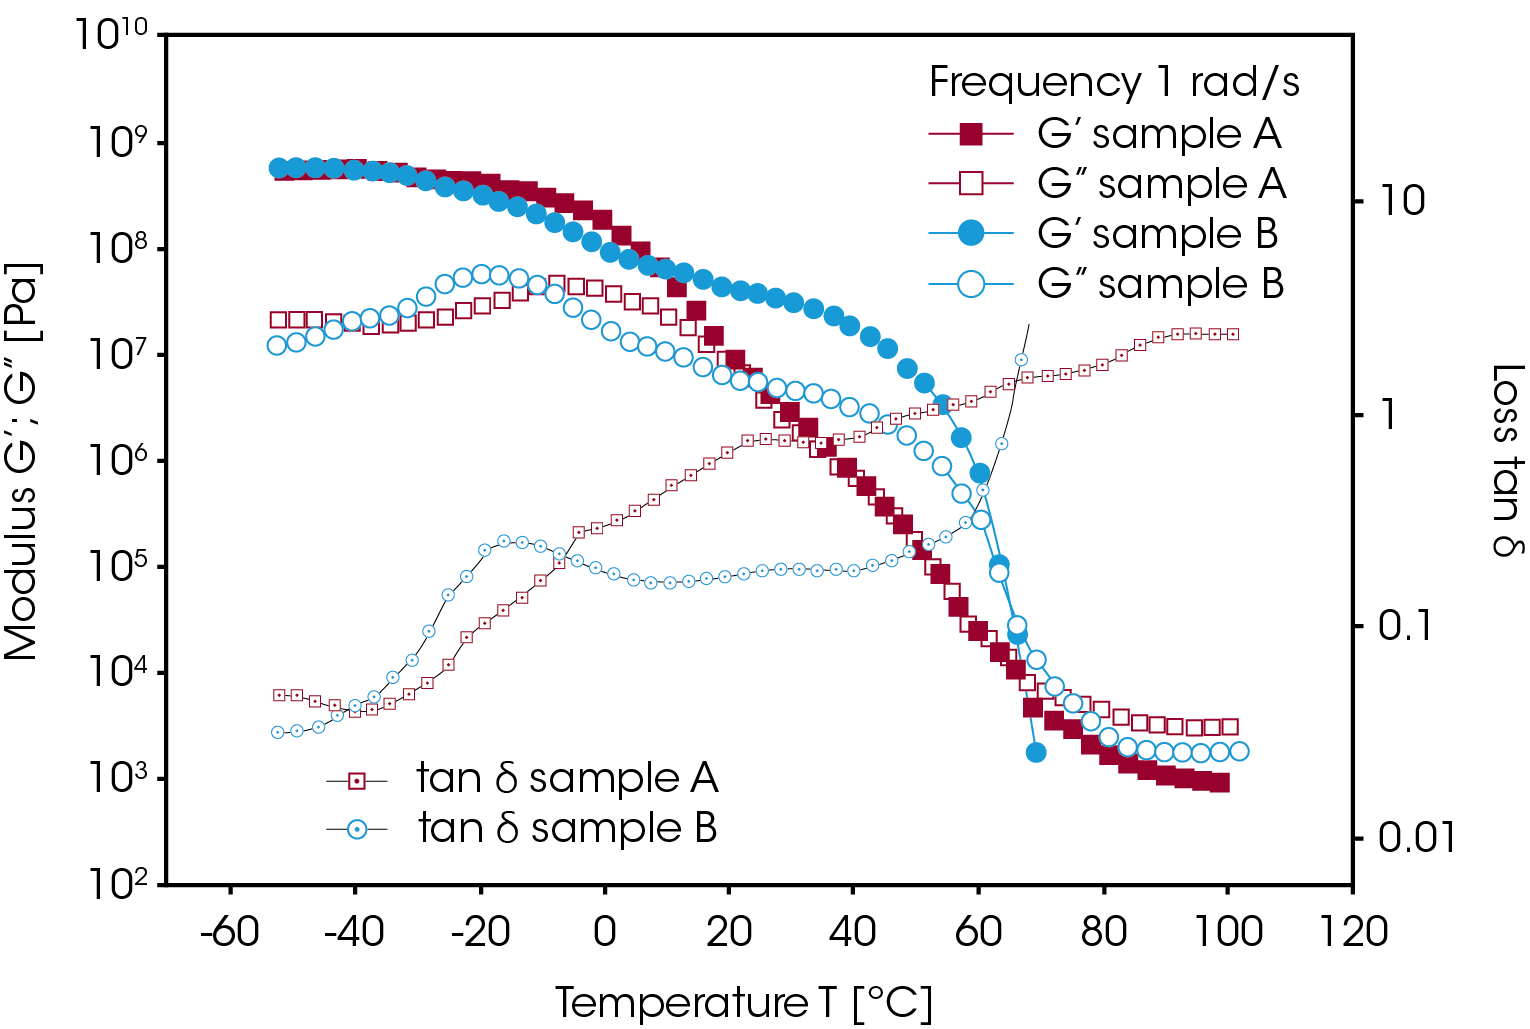
Hot melts need to be tough and flexible at use temperature for most applications. Book binding compounds must not become brittle over the expected use temperature range. Figure 9 shows the dynamic modulus and the loss behavior for a typical hot melt (block copolymer). The differences in storage modulus indicate a significant performance difference at use temperature. The level of the loss modulus can be related to the flexibility of the adhesive. Toughness can be correlated quantitatively to the transition represented by tan δ.
Conclusion
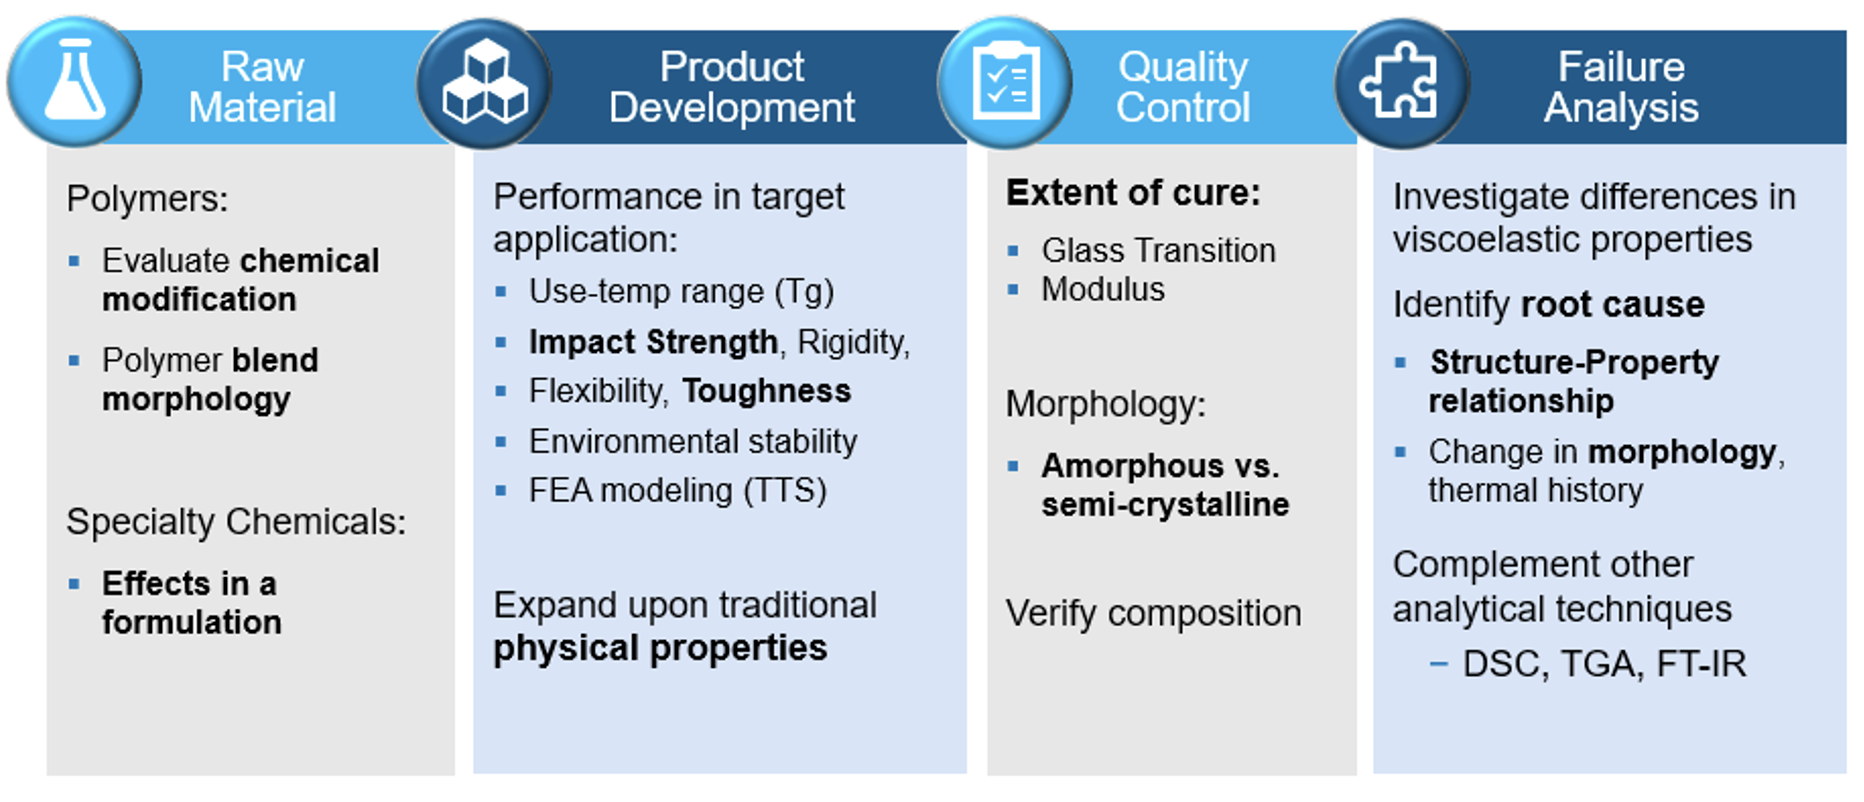
Dynamic Mechanical Analysis (DMA) is an extremely powerful technique to characterize the thermal and mechanical properties of solid samples. DMA allows users to characterize the viscoelastic properties of the material such as storage modulus, loss modulus and tan δ. These properties help understand the final performance properties of the solid products and tie it to the material chemistry. It is also one of the most sensitive techniques to measure the glass transition temperature of a material which can be used for quality control, development, informing processing conditions, and troubleshooting failed products. A representative chart of the application of DMA at different stages of manufacturing is shown below.
References
- Friedrich, C. et all., J.Rheol. 39, (6), 1411 (1995).
- Ma, C.C.M., et all. Advances in Polymer Blends and Alloys, Vol. 22, A Technomic publication ISBN 87762-670-7
- Rong, S.D.; William, H.L.“Dynamic Mechanical Measurements of Monofilaments”, University Toronto Press (1985)
- Knox, J.R.“Dynamic Mechanical Analysis” chap 4 of Thermal Analysis of Polymers, University of Illinois Press (1987)
- Nielsen, L.E.“Mechanical Properties of Polymers and Composites”, Vol.1, Maecel Dekker, New York 1974
- Bamborough, D.; Dunckley, P. Adhesives Age, November 1990
Acknowledgement
Revised By A. Franck
Click here to download the printable version of this application note.

