Keywords: Gelatin, gelation, viscoelasticity, concentration, moduli crossover, rheology
RH116
Abstract
Gelatin when appropriately processed forms soft gel networks which can critically influence the final texture, viscoelasticity, and water retention of a product. The concentration of gelatin in solution plays a large role in the kinetics, and in the final viscoelastic properties of the formed gel network after setting. Rheology allows for the rapid analysis of gelation kinetics and viscoelastic properties simultaneously, at a variety of compositions and processing conditions. In this application note, a TA Instruments ARES-G2 rheometer was used to characterize the kinetics and viscoelastic properties of dessert gelatin mix solutions prepared at a variety of concentrations and temperatures. The Advanced Peltier System (APS) used features precise temperature control and distribution. Temperature ramps and subsequent oscillatory time sweep experiments were used to rapidly cool and measure the gel properties respectively.
Introduction
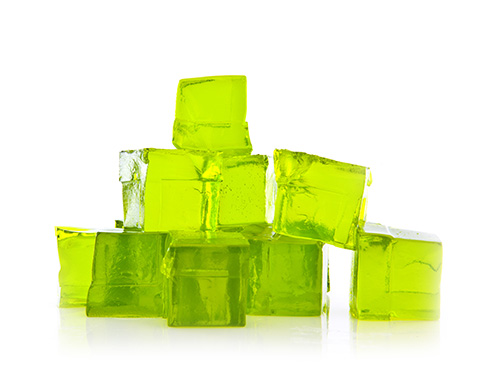
Gelatin is an oligomeric biopolymer typically obtained through the thermal hydrolysis of collagen, which can be sourced from various from the skin, tendons, or bones of animals such as cows, pigs, fish. Gelatin is desirable because as the name suggests it can have gel-like properties at certain conditions. As an additive (or standalone) to food or cosmetics, it can be used as a thickening agent, a texture modifier, and as a means to retain water in a product. [1,2] Physically the gelatin can “gel” or form a network at sufficiently low temperatures (<40 °C). At these temperatures the individual molecules can fold into coil structures, and once coiled the molecules can hydrogen bond with surrounding polar water molecules. Since hydrogen bonds are weak non-covalent bonds, this mode of gelation is thermo-reversible, with a critical temperature where the coils unfold, and the gel network disassembles.[2] The rate of gelation, or the overall gelation kinetics are dependent on many factors, including temperature, concentration, pH, solution composition, etc. [3]
Since Gelatin is an oligomeric biopolymer, a single sample can have a distribution of properties, including chain length distribution and amino acid composition of individual chains. These are largely dependent on the mode of processing the collagen precursor. In the case of thermal hydrolysis, the presence of acids and/or enzymes, and the processing temperature and pressure all can influence the final structure and properties of the resulting gelatin. The molecular weight of the gelatin extracted relates to the final strength or stiffness of the gel, this is captured in the measure of the bloom of a given gelatin. The higher the bloom, the higher the strength of a prepared gelatin, and hence a higher molecular weight (among other factors).[4]
Rheology is a very important tool in the characterization of gel networks, as it can capture gel storage and loss moduli, viscosity as a function of shear rate, and can measure gelation kinetics (time of gelation). For products incorporating gelatin, gelatin concentration and gelation conditions can have an enormous effect on the final product properties. Here, the gelation kinetics of an off the shelf gelatin mix is characterized at several concentrations and temperatures using small amplitude oscillatory measurements. Demonstrating the ease of optimizing the formulation and processing of gelatin containing solutions using a TA Instruments ARES-G2 Rheometer.
Experimental
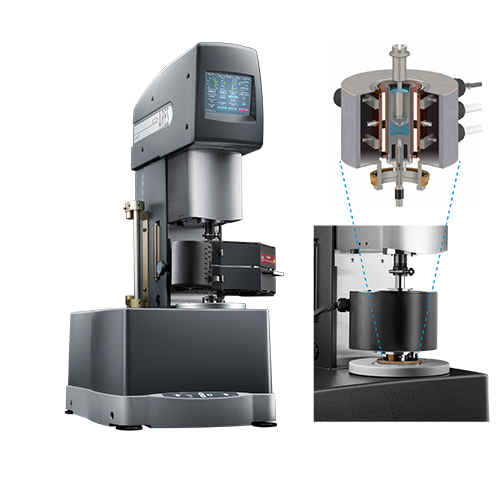
A commercial food grade dessert gelatin was used for this study. Measurements were performed on a TA Instruments ARES-G2 rheometer (shown in figure 2) with the Advanced Peltier System (APS), using a cup and DIN rotor. The ARES-G2 is a research level rheometer and features a separate motor and transducer which minimizes inertial effects. The APS is a comprehensive temperature control system, with options for both concentric cylinder geometries and plate geometries. Tests were performed by heating gelatin solution of various concentrations (20%, 25%, and 30%) to 75 °C, where the mixture was stirred at a shear rate of high shear rate for 30 seconds. Afterward, the solutions were cooled down (quenched) to the set isothermal gelation temperature at a cooling rate of 15 °C/min, well above a cooling rate required for nonisothermal gelation.[5] After a brief low temperature equilibration for 10 seconds, an oscillation time sweep test was programmed with a frequency of 1Hz, and a strain of 2.5%, which is within the linear region of the sample. Gelation time was defined by the crossover of the storage and loss moduli, G’ and G’’ respectively. [5,6,7]
Results and Discussions
It is well known that gelation kinetics of gelatin are strongly influenced by temperature. Figure 3 shows the development of gelation over time for the 30% concentration gelatin mix solutions at the various isothermal gelation temperatures. This is observed by the increase in both the storage (G’) and loss moduli (G’’), where a time of gelation (tGel) can be described as the point where the storage modulus exceeds the loss modulus. The storage modulus indicates a solid like response, whereas the loss modulus indicates a liquid like response. The most rapid development of the storage modulus is observed at the lowest processing temperature of 10 °C, and the time of gelation follows an exponential relationship following increases in temperature. Additionally, since the networks form at different rates at different temperatures, at a given time into the gelation, the gels can exhibit largely different mechanical behavior, stemming from the differences in magnitude of storage modulus.
Figures 4 and 5 compare the gelation kinetics of the various concentrated gelatin solutions at temperatures of 10°C and 17.5 °C respectively. At 10 °C (Figure 4) the 25% and 30% solutions gel relatively fast, while the 20% solution requires a significantly longer duration of time to undergo gelation. At 17.5 °C (Figure 5) the gelation kinetics are significantly retarded for all the solutions, indicated by the moduli crossover shifting to the right to longer times. Additionally, the gels formed here have significantly lower modulus, representative of the decreased strength of the hydrogen bonds of the gelatin molecules to the water solvent.
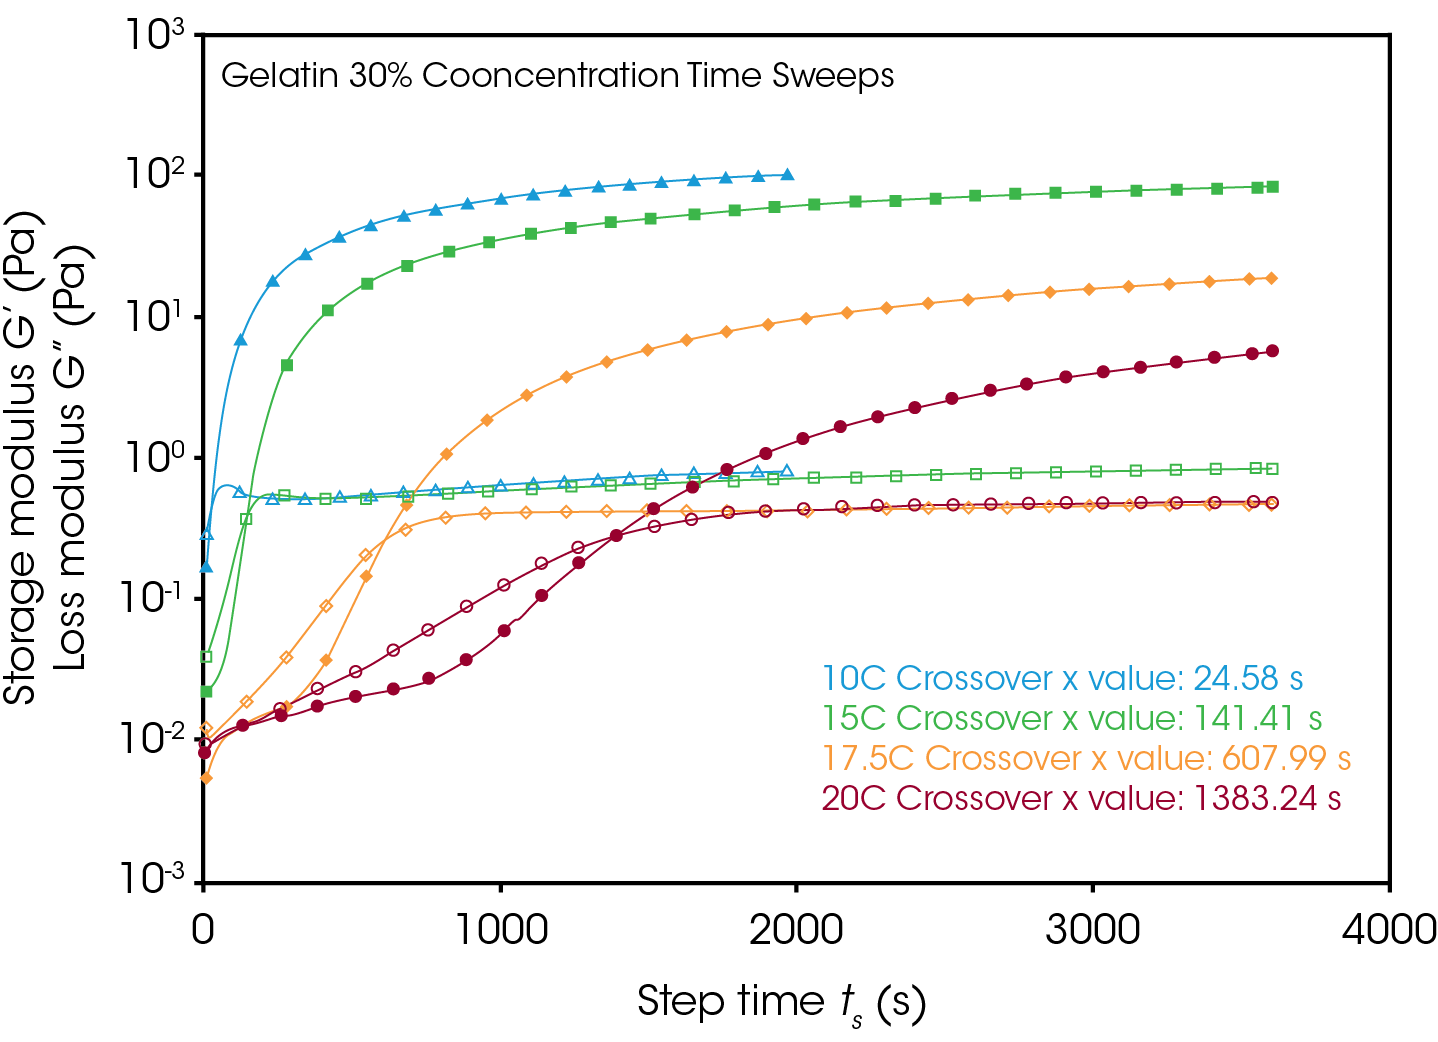
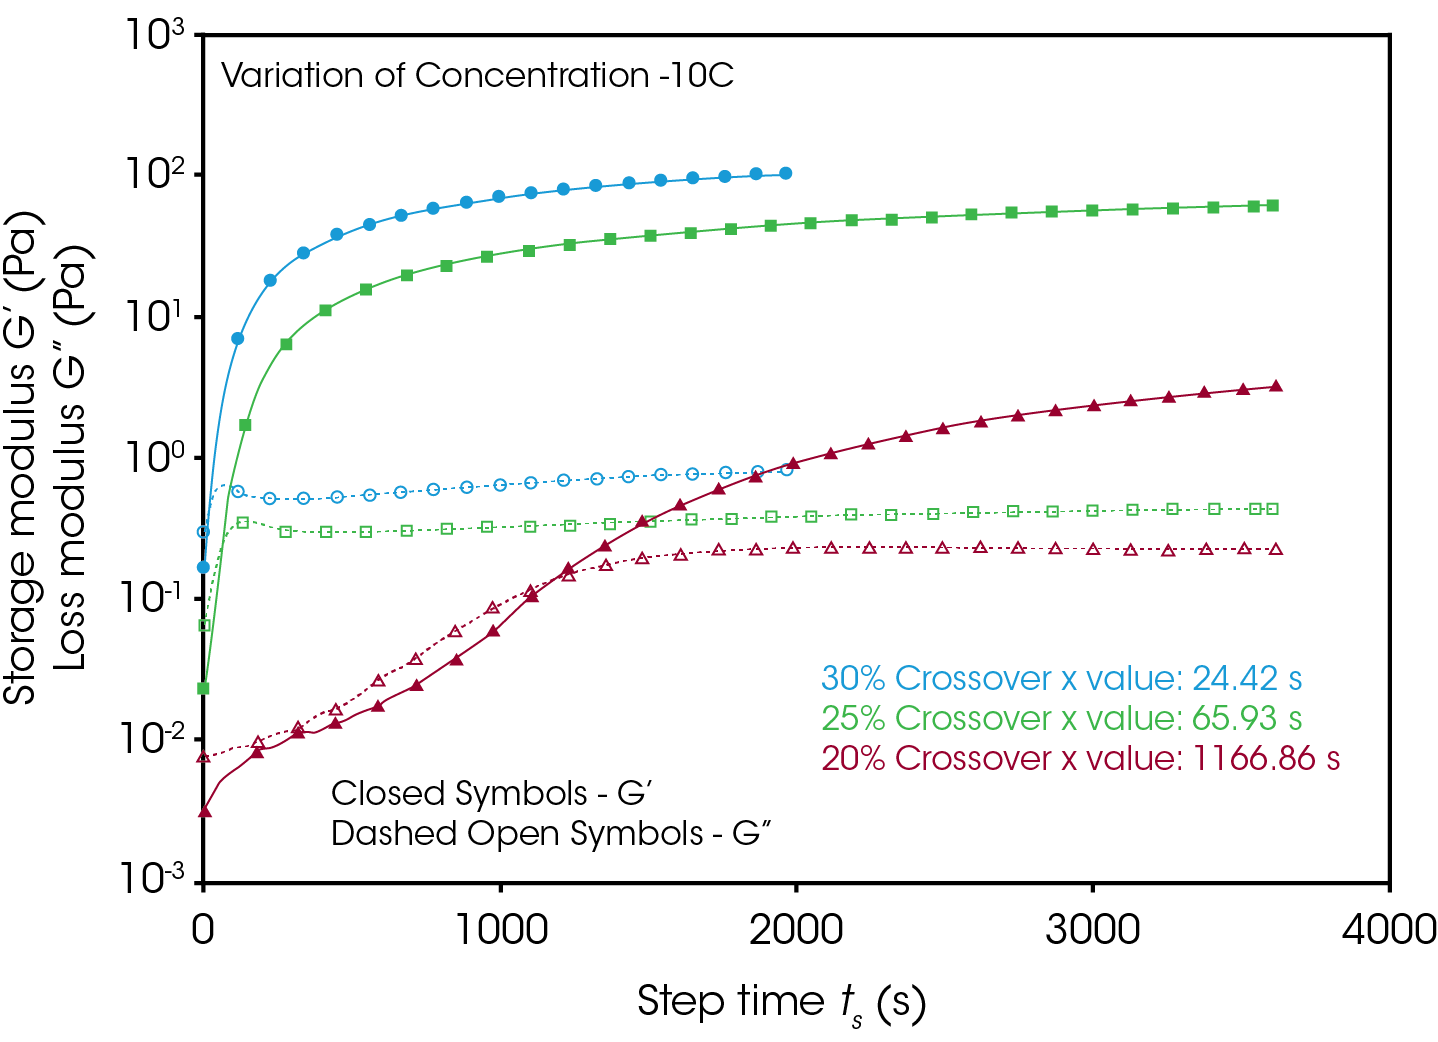
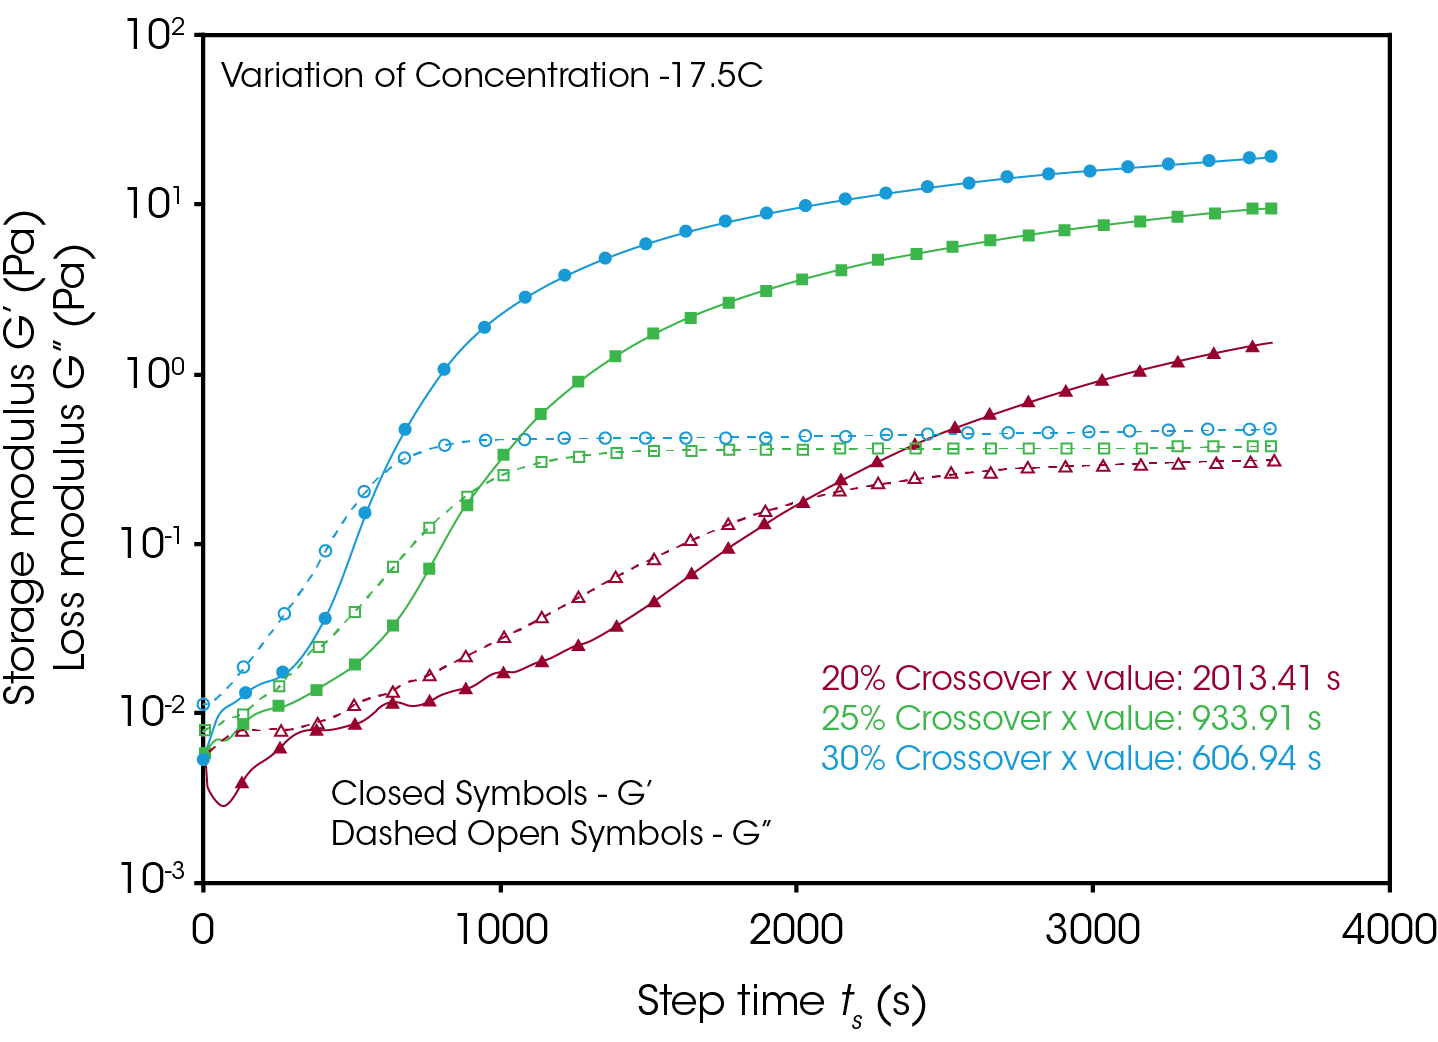
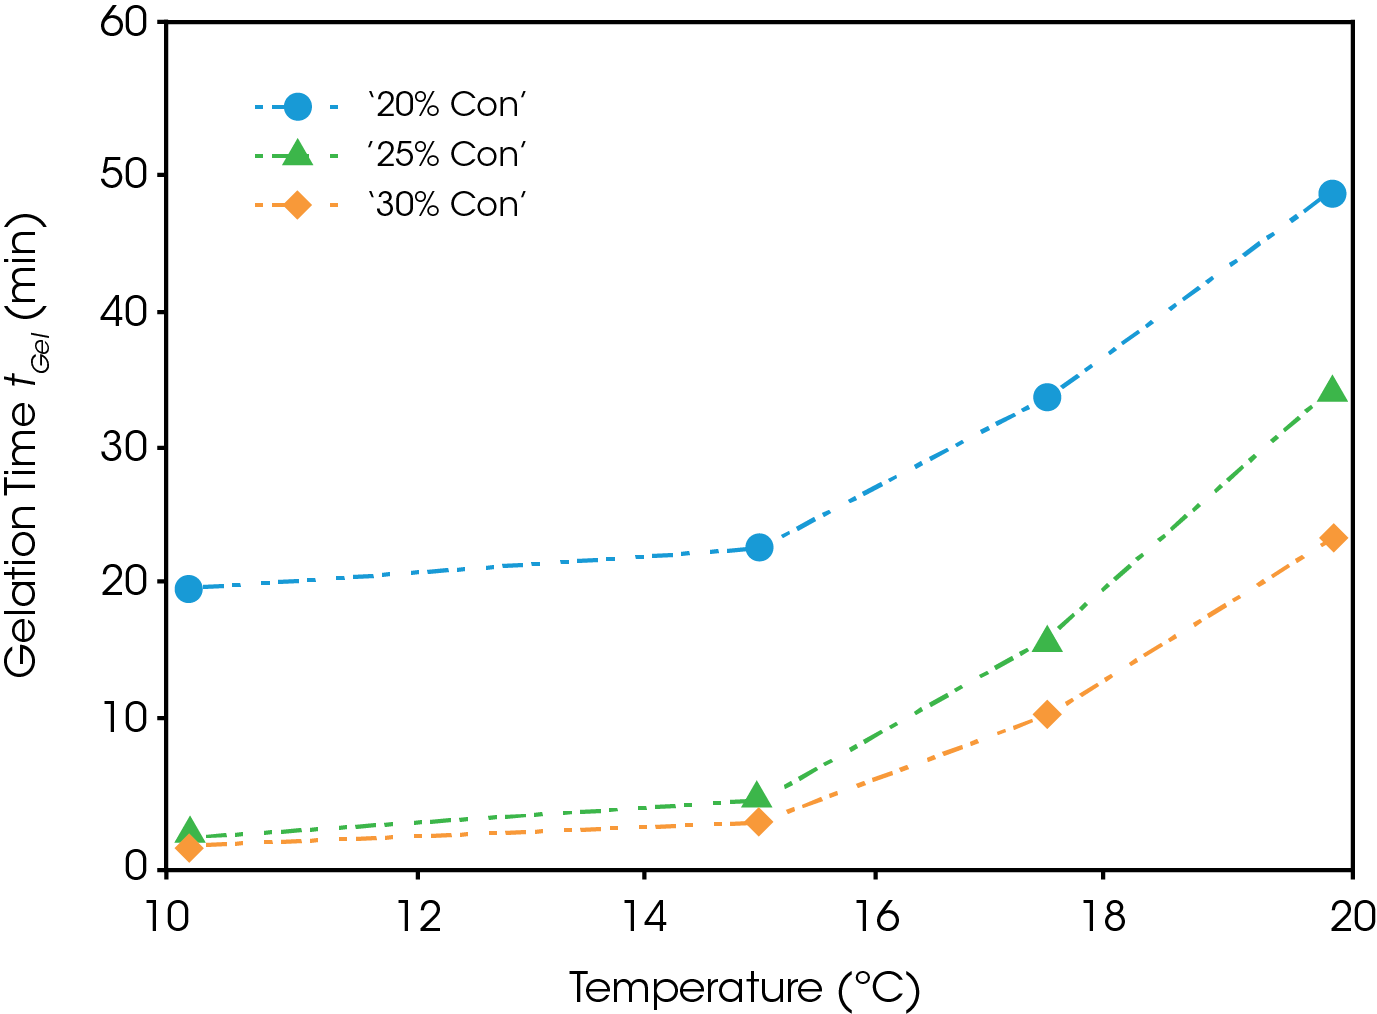
Figure 6 shows the gelation time plotted as a function of temperature for each of the concentrations. It is noted that the gelation time is a strong function of both temperature and concentration. An increase of concentration from 20% to 25% greatly decreases the gelation time, while an additionally increase to 30% has a marginal effect except at higher temperatures. All three curves for the various concentrations follow the same trend, with gelation time exponentially increasing with temperature. Extrapolating from this, gelation at higher temperatures above 20 °C and below the critical temperature for gel formation, may take on the order of hours.
Conclusions
Dessert gelatin mix solutions of varying concentration were prepared and loaded into a TA Instruments ARES-G2 rheometer equipped with an Advanced Peltier System (APS) and cup and bob geometry, where the viscoelastic properties of the solutions were measured as a function of time during isothermal gelation. The experiments here demonstrate the ease of quantifying both gelation kinetics as well as the mechanical robustness of the gels formed at the respective temperatures and comparing these characteristics as a function of concentration. The ARES-G2 rheometer is able to capture these measurements beautifully, with the precise temperature control that the APS system provides. These methods allow for the optimization of gel composition, gel processing, and overall gel stability, leading to superior product development, cost reduction, and performance.
References
- Fonkwe, L. G., Narsimhan, G., and Cha, A. S.,”Characterization of gelation time and texture of gelatin and gelatin–polysaccharide mixed gels” Food Hydrocolloids, 2003, Vol. 17}
- Djabourov, M., Lechaire, J. P., & Gaill, F. “Structure and rheology of gelatin and collagen gels” Biorheology, 1993, Vol. 30
- Avallone, P. R., Raccone, E., Costanzo S., Delmonte M., Sarrica, A., Pasquino, R. and Grizzuti, N., “Gelation kinetics of aqueous gelatin solutions in isothermal conditions via rheological tools” Food Hydrocolloids, 2021, Vol. 111
- Ahmed, M. A., Al-Kahtani, H. A., Jaswir, I., AbuTarboush, H., and Ismail, E. A. “Extraction and characterization of gelatin from camel skin (potential halal gelatin) and production of gelatin nanoparticles”, Saudi Journal of Biological Sciences, 2020, Vol. 27
- Ahmed, J., Ptaszek, P., and Basu, S., “Rheological Properties of Gelatin and Advances in Measurement (Chapter 15)”, Advances in Food Rheology and Applications, 2017, 377-404
- Winter, H. H. and Chambon, F., “Analysis of Linear Viscoelasticity of a Crosslinking Polymer at the Gel Point”, Journal of Rheology, 1986, Vol. 30
- Chen, Tianhong, “Rheological Analysis of Hydrogel Materials”, TA applications note. https://www.tainstruments.com/pdf/literature/AAN033.pdf
Acknowledgement
This paper was written by Keith Coasey, Ph.D., Rheology Applications Engineer at TA Instruments.
Click here to download the printable version of this application note.

