Keywords: Bacteria Growth, Calorimetry, Metabolism, Detection, IMC, Antibiotics
MC155
Introduction
Isothermal Microcalorimetry (IMC) is a detection method that works with both solid and liquid samples. It is a fast and affordable technique that does not rely on an optical measurement. Therefore, a variety of medias can be used without compromising results. A typical growing bacterium generates 2 pW of heat.1,2 This means only 100,000 bacteria need to be present to give rise to the growing heat signal, which indicates a positive growth.3 In addition, detection is safe from contamination since ampoules can be autoclaved and sealed prior to measurement. This method is also very simple, as analysis consists of determining if the heat flow signal is rising above a baseline heat signal.
E. coli is known to have a typical growth curve which consists of five phases: lag phase, log phase, stationary phase, death phase, and long-term stationary phase (LTSP) when in nutrient-sufficient media. When considering the ability to measure the growth of bacteria with IMC generally the phase of most interest is the exponential or log phase; essentially how fast can one determine if bacteria is present in a sample. There has been significant work done looking at using IMC to characterize the growth patterns of bacteria3-9 and even converting isothermal microcalorimetry data into biologically meaningful data such as growth rate, lag phase, or maximum growth.4
Materials and Method
Sample Preparation
Disposable glass ampoules and lids were autoclaved prior to the inoculation. Ampoules were filled with 1 mL of media and inoculated with E. coli to achieve a target concentration of 106 – 102 colony-forming units (CFU). One ampoule was prepared with only media to serve as a control. Lids were crimped closed to ensure a sterile environment was maintained throughout experiment.
Isothermal Calorimetry
The ampoules were lowered into the equilibration position for 15 minutes to bring them to 37°C prior to lowering into the measuring position. The samples were incubated at 37°C for 12+ hours in a TAM IV 4 mL multicalorimeter with a built-in reference of 8.4 J/K.
Data Analysis
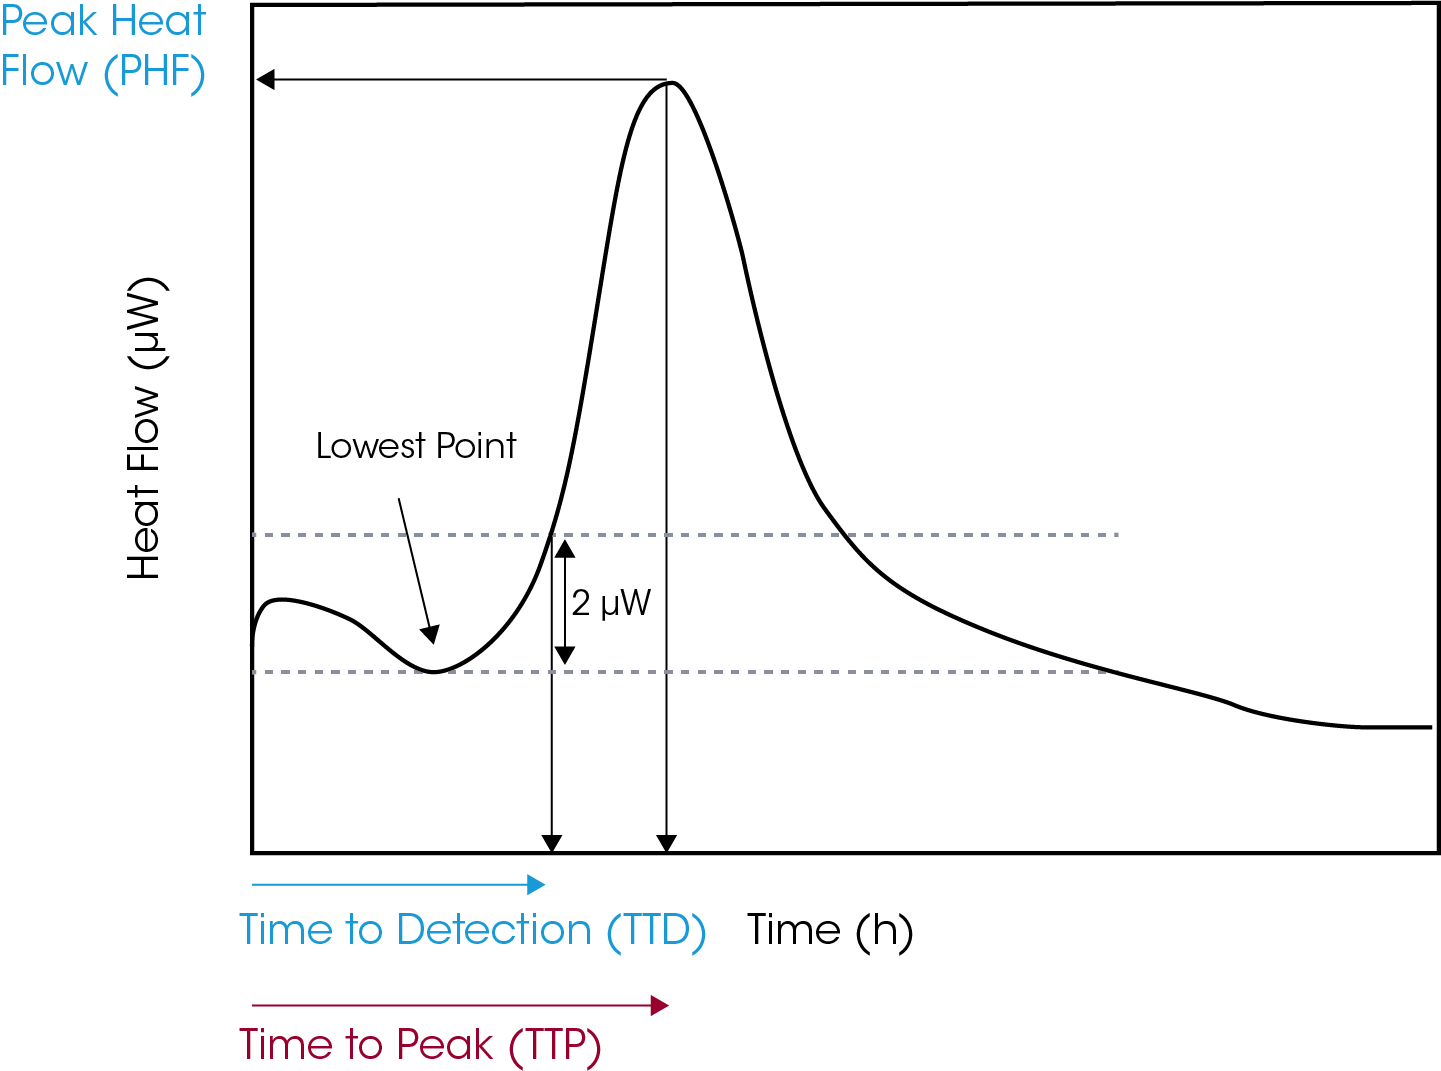
Positivity or time to detection (TTD) was defined as heat flow of at least 2 µW above the lowest value of the power–time curve, Figure 1. Time to peak (TTP) was calculated by determining time to reach peak heat flow, Figure 1. It is important to consider the start time as time of inoculation and not the time the sample was inserted into the measuring position of the instrument.

Results and Discussion
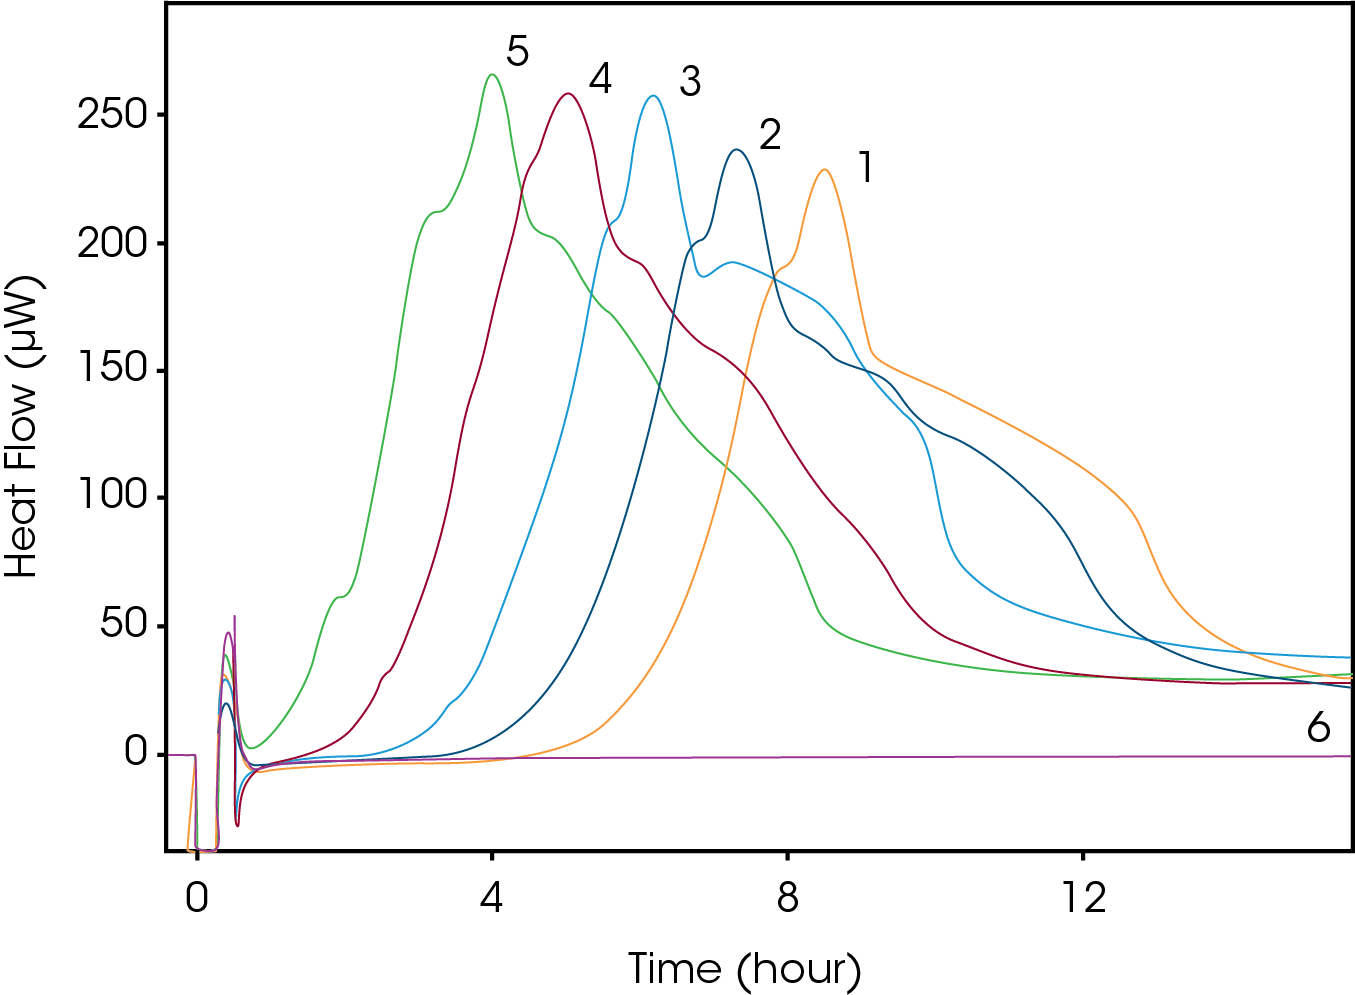
The growth curve of E. coli at five different starting CFUs is shown in Figure 2 (1=102, 2=103, 3=104, 4=105, 5=106, 6=media). Each curve has a similar heat profile; however, we can see a delay in the TTD and TTP based on the starting CFU. The times for each sample are shown in Table 1.
Table 1. Time to Detection and Peak Results
| Sample | Starting CFUs | TTD | TTP |
|---|---|---|---|
| 1 | 102 | 4 hrs 20 mins | 9 hours 3 mins |
| 2 | 103 | 3 hrs 30 mins | 7 hrs 50 mins |
| 3 | 104 | 2 hrs 20 mins | 6 hrs 43 mins |
| 4 | 105 | 1 hr 20 mins | 5 hrs 35 mins |
| 5 | 106 | 50 mins | 4 hrs 33 mins |
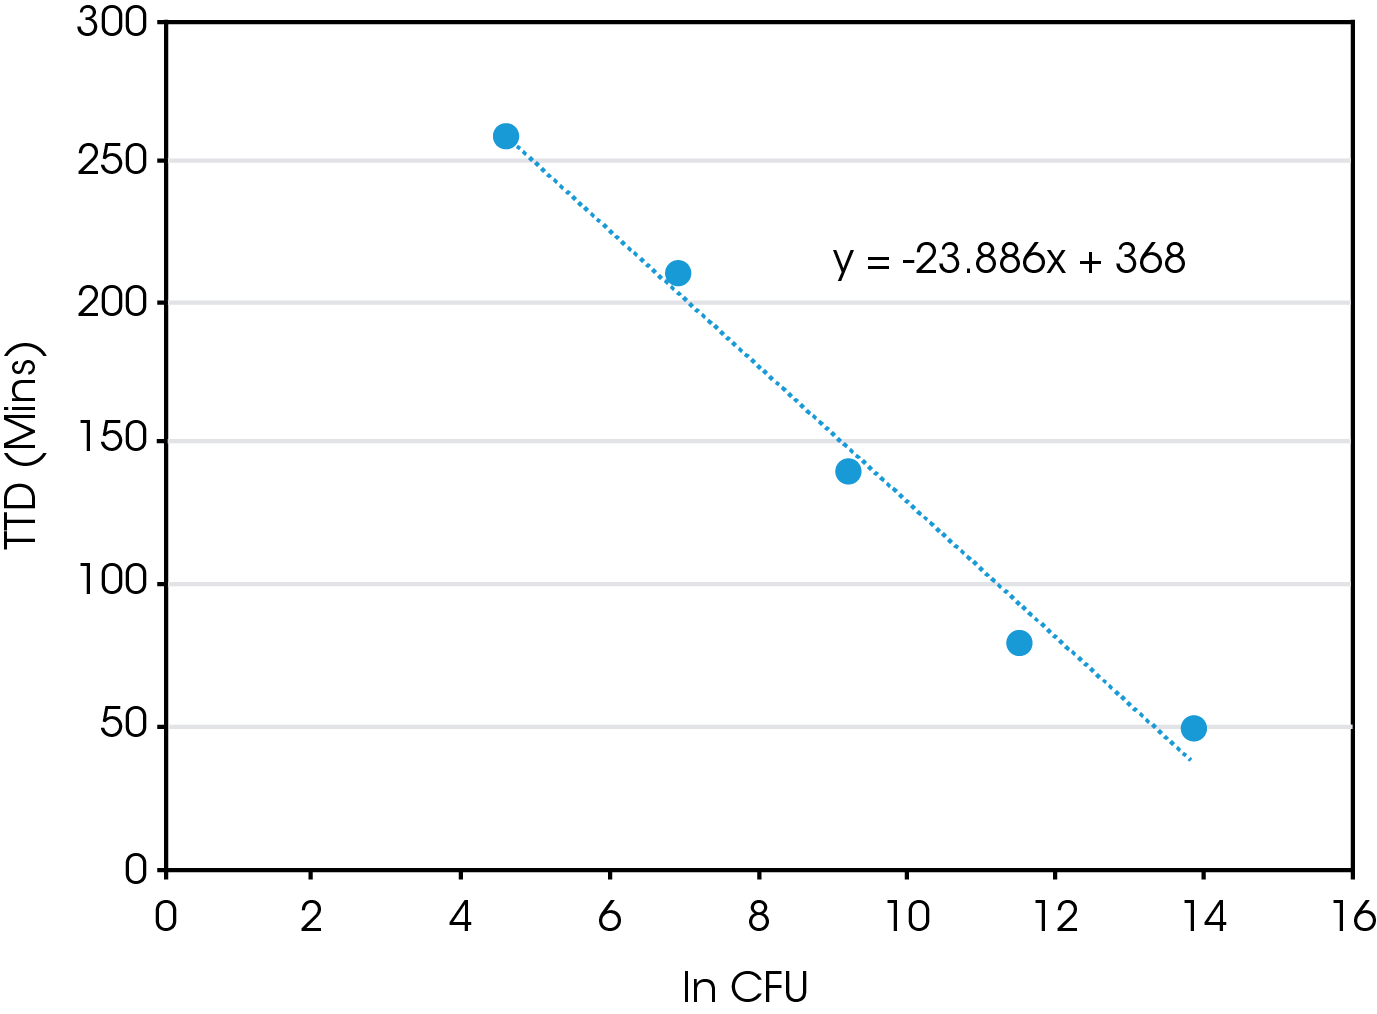
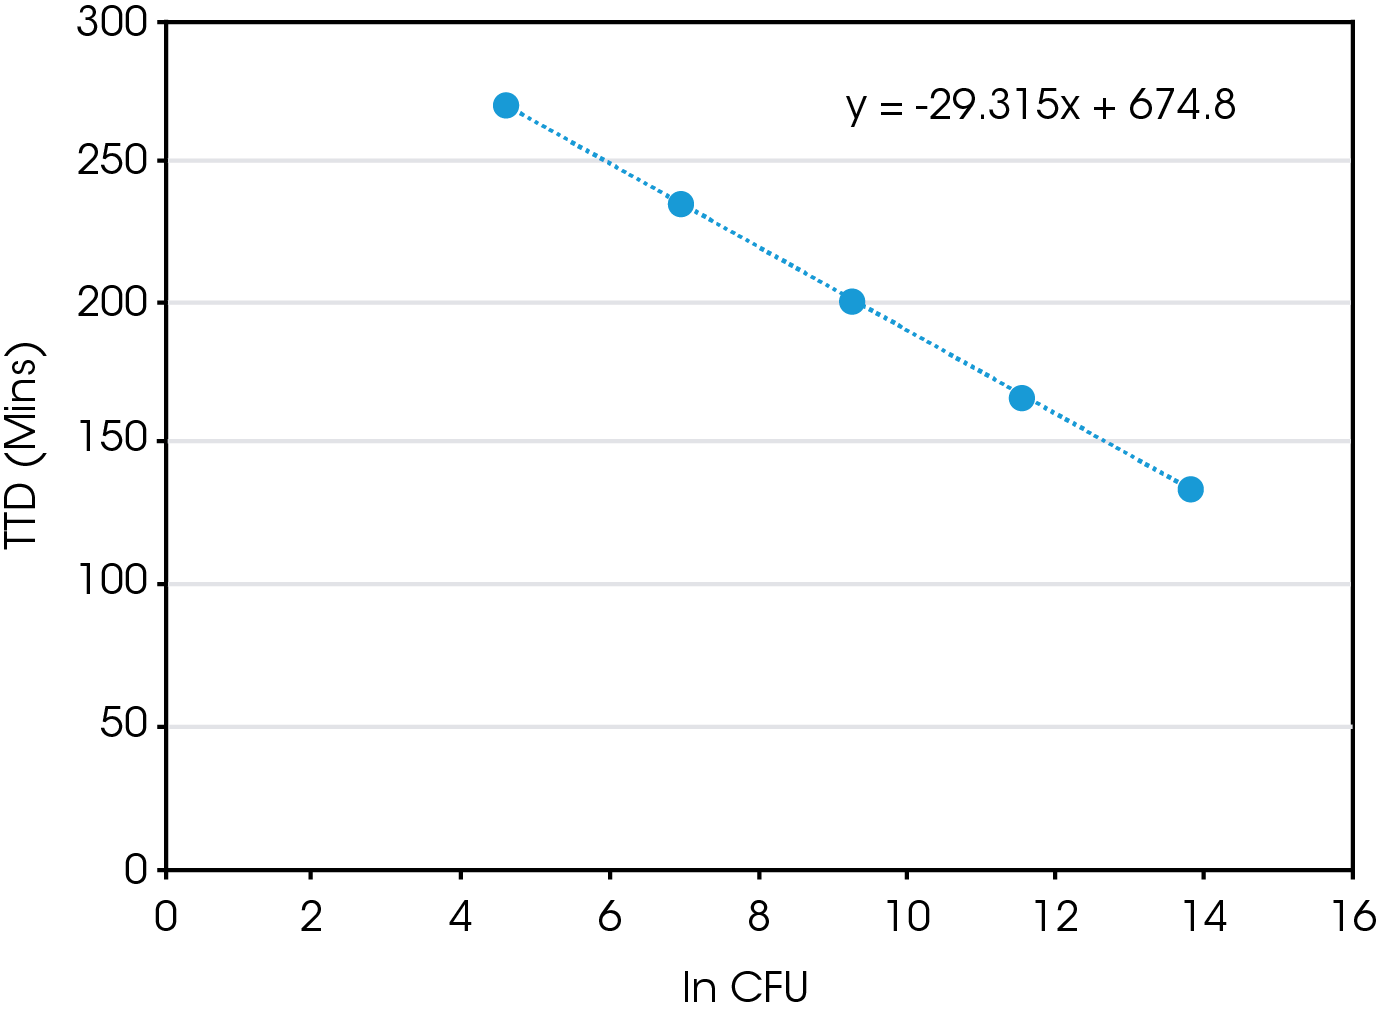
There is a direct correlation between the starting CFU and both TTD and TTP. When plotting TTD vs ln (CFU), Figure 3, there is a linear relationship. So, using this equation one could estimate the time needed to determine positive growth of a E. coli sample with a known CFU. However, what is probably more relevant is once you have measured the TTD using IMC one could determine the starting CFU of an unknown sample. The same is true for the TTP, as there is also linear relationship present between TTP and ln (CFU), Figure 4.


Conclusions
In this application note we discussed the usage of IMC in measuring bacteria growth. We used E. coli as a model system, however, IMC could be used for any bacteria strain or cell type since this technique is measuring the heat generated from growth. Also, since an IMC heat flow curve is specific to a bacteria strain, similar to a fingerprint, IMC could also be used to identify which type of bacteria might be present in a sample as well.9 IMC can also be used to study the effects of antibiotics by monitoring changes in the heat flow pattern with and without antibiotics present.8 Overall, IMC is a fast and easy method to study bacteria growth and can be used with a variety of sample types and media.
References
- Higuera-Guisset J, Rodrıguez-Viejo J, Chacon M, Mun˜oz FJ, Vigues N, Mas J. “Calorimetry of microbial growth using a thermopile based microreactor: Thermochimica Acta 2005, 427:187–91
- James AM. “Thermal and energetic studies of cellular biological systems” Bristol: IOP Publishing; 1987, 221
- Braissant, O, Wirz D., Gopfert B., Daniels A.U. ‘‘The heat is on’’: Rapid microcalorimetric detection of mycobacteria in culture” Tuberculosis, 2010, 90: 57–59
- Braissant, O., Bonkata, G., Wirz, D., Bachmann, A. “Microbial growth and isothermal microcalorimetry: Growth models and their application to microcalorimetric data” Thermochimica Acta 2013, 555:64– 71
- Braissant, O., Wirz, D., Göpfert, B., Daniels, A.U. “Use of isothermal microcalorimetry to monitor microbial activities” FEMS Microbiology Letters, 2010, 303:1–8
- Tellapragada, B., Hasan, A., Antonelli, A., Maruri, C., de Vogel, D., Gijón, M., Coppi, A., Verbon, W., van Wamel, G. M., Rossolini, R., Cantón, R., Giske, C.G. “Isothermal microcalorimetry minimal inhibitory concentration testing in extensively drug resistant Gram-negative bacilli: a multicentre study” Clinical Microbiology and Infection, 2020 26: 1413.e1-1413.e7
- Fricke, C., Harms, H., Maskow, T. “How to speed up the detection of aerobic microbial contaminations by using isothermal microcalorimetry” J Therm Anal Calorim, 2020, 142:1933–1949
- von Ah, U., Wirz, D. Daniels, A. “Isothermal micro calorimetry – a new method for MIC determinations: results for 12 antibiotics and reference strains of E. coli and S. aureus” BMC Microbiol, 2009, 9:106
- Boiling, E., Blanchard, G., Russell, W. “Bacterial Identification by Microcalorimetry” Nature, 1973, 241:472–473
Note: This work was done with the TAM IV 4 mL multicalorimeter, but similar studies could also be done on other TAM configurations. The primary factors to consider would be calorimeter sensitivity, sample size and overall heats being measured. Calorimeters with volume sizes up to 20 mL might require a higher detection heat (Δq), up to 10 μW.
Acknowledgement
This paper was written by Calliste Scholl, Applications Engineer at TA Instruments.
Click here to download the printable version of this application note.

