Keywords: Dynamic Mechanical Analysis, DMA, Polymers, Heat Deflection Temperature, HDT, Deflection Temperature Under Load, DTUL, Creep
TA033
Introduction
Material selection in the plastics industry today typically proceeds by a number of different avenues. Successful field experience with a given resin system offers possibly the best indicator of prospects for sound performance in future projects. To that end, applications based data from material suppliers and from trade journals that focus on plastic design is very valuable.
However, with the explosion of new materials geared to meet new market demands, there are often no experimental guidelines. The long term integrity of a material in a given environment must be judged, or guessed at, based on short term properties. The most widely used document in this endeavor is the short term property chart. Usually it is the first piece of information offered to the market place when a new material is introduced. It has become the benchmark that designers and engineers use to compare the relative merits of the various materials available to them.
The inherent problems with selecting materials for long term performance based on short term properties can be readily apparent if one focuses on one thermal property, the deflection temperature under load (DTUL). Also referred to as the heat deflection temperature (HDT), it is considered by many in the industry to represent the upper limit of safe operating temperatures for products fabricated from a given resin system. In the quest for reliable performance at elevated temperatures, this single property is frequently the only criterion used in determining the fitness for use of a given material. In reality, because of factors such as polymer structure, filler loading and type, oxidative stability, molded-in stresses, and part geometry, actual maximum use temperatures may be as much as 150 °C below or above the DTUL.
Using dynamic mechanical analysis (DMA), the operator can continuously monitor the flexural modulus of a material as a function of temperature. This facilitates identification of important transitions such as the glass transition, and quantification of the effects of these changes on load bearing characteristics. DMA also provides quantitative data on the mechanical damping properties of a material, which relate to impact resistance. This enables the effects of long term structural changes that can occur at elevated temperatures such as crosslinking, cold crystallization, and oxidation to be monitored, and the effects of these changes on the practical toughness of a material to be assessed. This must be considered since frequently a resin will undergo an increase in stiffness at the expense of ductility.
In this study, the load bearing characteristics of thermosets and thermoplastics that are commonly considered for elevated temperature service were examined. Most of the investigation was limited to materials with DUTL’s greater than 200 °C and comparisons were made between resins with comparable DTUL values. By operating the DMA instrument in the creep mode, the time dependent aspects of load bearing capabilities were also studied. This method has the advantage of being an isothermal test, which eliminates the thermal lag problems associated with a test that employs dynamic heating. In addition, using creep data developed over relatively short time periods at a variety of temperatures, time-temperature superpositioning can be used to make predictions concerning the long term properties of a material based on tests that take a relatively short time to perform.
Experimental
A wide variety of high performance thermoplastics were supplied as injection molded tensile bars or plaques of 3.18 mm thickness. Most samples contained a 30% glass fiber reinforcement. Thermoset samples were supplied as standard flex bars 127 mm long, 12.7 mm wide, and 3.18 mm thick. Selections were designed to provide comparisons within a material family as well as between resin systems that are typically considered competitive for certain end use markets based on their high temperature performance. Whenever possible, resins of the same DTUL were compared. Phenolic samples were post cured for 24 hours at 150 °C.
Dynamic heating scans were performed at 2 °C/minute from room temperature to a specific end point. For thermoplastics the end point was determined by the loss of a drive signal from the instrument. This indicated that the sample had undergone substantial softening and was no longer supported. For thermosets, the lack of a melting or softening point made it possible to scan well above the DTUL and most samples were heated to 325–350 °C and then examined for physical defects such as blistering.
Heat cycling was conducted by heating at 2 °C/minute to the DTUL and then slowly cooling in air to room temperature. The sample was then scanned during reheat. This enabled evaluations of changes in materials caused by short term high temperature exposure.
Creep tests were modified from the single temperature format. The samples were stressed for 30 minutes at an initial temperature and were then allowed to relax for 15 minutes. The temperature was then increased in increments of 4 °C followed by an equilibration period of 10 minutes before initiation of the next stress/relax cycle. This routine was continued to a temperature of 330 °C or until the sample reached a maximum displacement for the instrument. Initial strains of 0.10-0.15 mm were used which results in 0.70–1.00% strain.
This stairstep method has several advantages. First, it maintains the isothermal nature of the test. Second, regions of stability as well as significant transitions can be studied during the same test, and the test period is only 48–96 hours. Finally, this method provides the opportunity to use time-temperature superpositioning techniques to derive projections about the long term performance of the materials.
Superpositioning was performed using the Williams-Landel-Ferry model or an Arrhenius model depending upon the temperature range being evaluated for a given material. Temperature ranges were limited to provide a maximum of five decades of projection, which limits the extrapolations to a period of ten years based on tests consisting of 30 minute strain segments. Actual tests comprising the initial 30–100 hours of a given time-temperature master curve were run to verify the accuracy of the projections.
Results and Discussion
The property measured by DMA that is of greatest interest in determining load bearing capabilities is the flexural storage modulus (E’) which agrees closely with the flexural modulus as measured by ASTM D-790. For dynamic heating scans, E’ is reported as a function of temperature. Also of importance is the ratio of the storage modulus to the loss modulus (E”) as a material passes through the glass transition. This quantity, tan delta, indicates the balance between the elastic phase and the viscous phase in a polymer. This can relate to impact properties, and is an essential factor in evaluating the effects of post curing and heat aging. Tan delta is also plotted vs. temperature.
Figure 1 plots E’ vs. temperature for three resins with nearly identical DTUL’s; a PET polyester, a polyethersulfone, and an epoxy. The PET modulus begins to decrease rapidly at 60 °C as the material enters the glass transition. The amorphous component in the polymer achieves an increased degree of freedom and at the end of the glass transition the modulus of the material has declined by about 50% from room temperature values.
Because of its crystalline component, the material then exhibits a region of relative stability. The modulus again drops rapidly as the crystalline structure approaches the melting point, the actual modulus of a resin of this type at the DTUL is only 10–30% of the room temperature value. The DTUL of highly filled systems based on these resins is more closely related to the melting point than to the significant structural changes associated with Tg.
Polyethersulfone (PES) is a high performance amorphous resin. Amorphous materials exhibit higher glass transition temperatures than their semi-crystalline counterparts, and maintain a high percentage of their room temperature properties up to that point. However, with the onset of the glass transition the loss in properties is sudden and complete, even for highly reinforced grades. The DTUL’s of these systems are closely associated with the Tg, but almost always fall on the steep-sloped part of the modulus curve. Thus the DTUL occurs in a region of great structural instability and the actual maximum temperature for reliable performance under load is 15–30 °C below the DTUL. (1)
The epoxy is a crosslinked system with a well defined Tg. The temperature dependency of the modulus in such materials is related to the crosslink density. The relationship of the DTUL modulus is similar to that observed for the PET. However, in this case the crosslinked system provides an extended region of stability well beyond the Tg and the DTUL. Thus, while both thermoplastic systems are no longer solid above 250 °C, the epoxy has structural integrity and virtually the same modulus at 300 °C as it has at 250 °C. It is therefore still serviceable for short term excursions above the DTUL and may prove useful for extended periods under reduced loads providing that it possesses good thermal and oxidative stability.
While phase changes such as Tg and Tm cannot be avoided, the effects of these transitions on the load bearing characteristics of a resin system can be reduced by improvements in reinforcement or through alloying. Figure 2 shows a plot of E’ vs. temperature for a traditional short glass fiber reinforced PBT polyester and a long glass fiber analog. While the DTUL’s are very close, the DMA scans reveal that the long glass provides a 30% increase in initial modulus, reduces the degree of modulus loss due to the glass transition, and provides for a stiffer and more stable compound up to the DTUL.
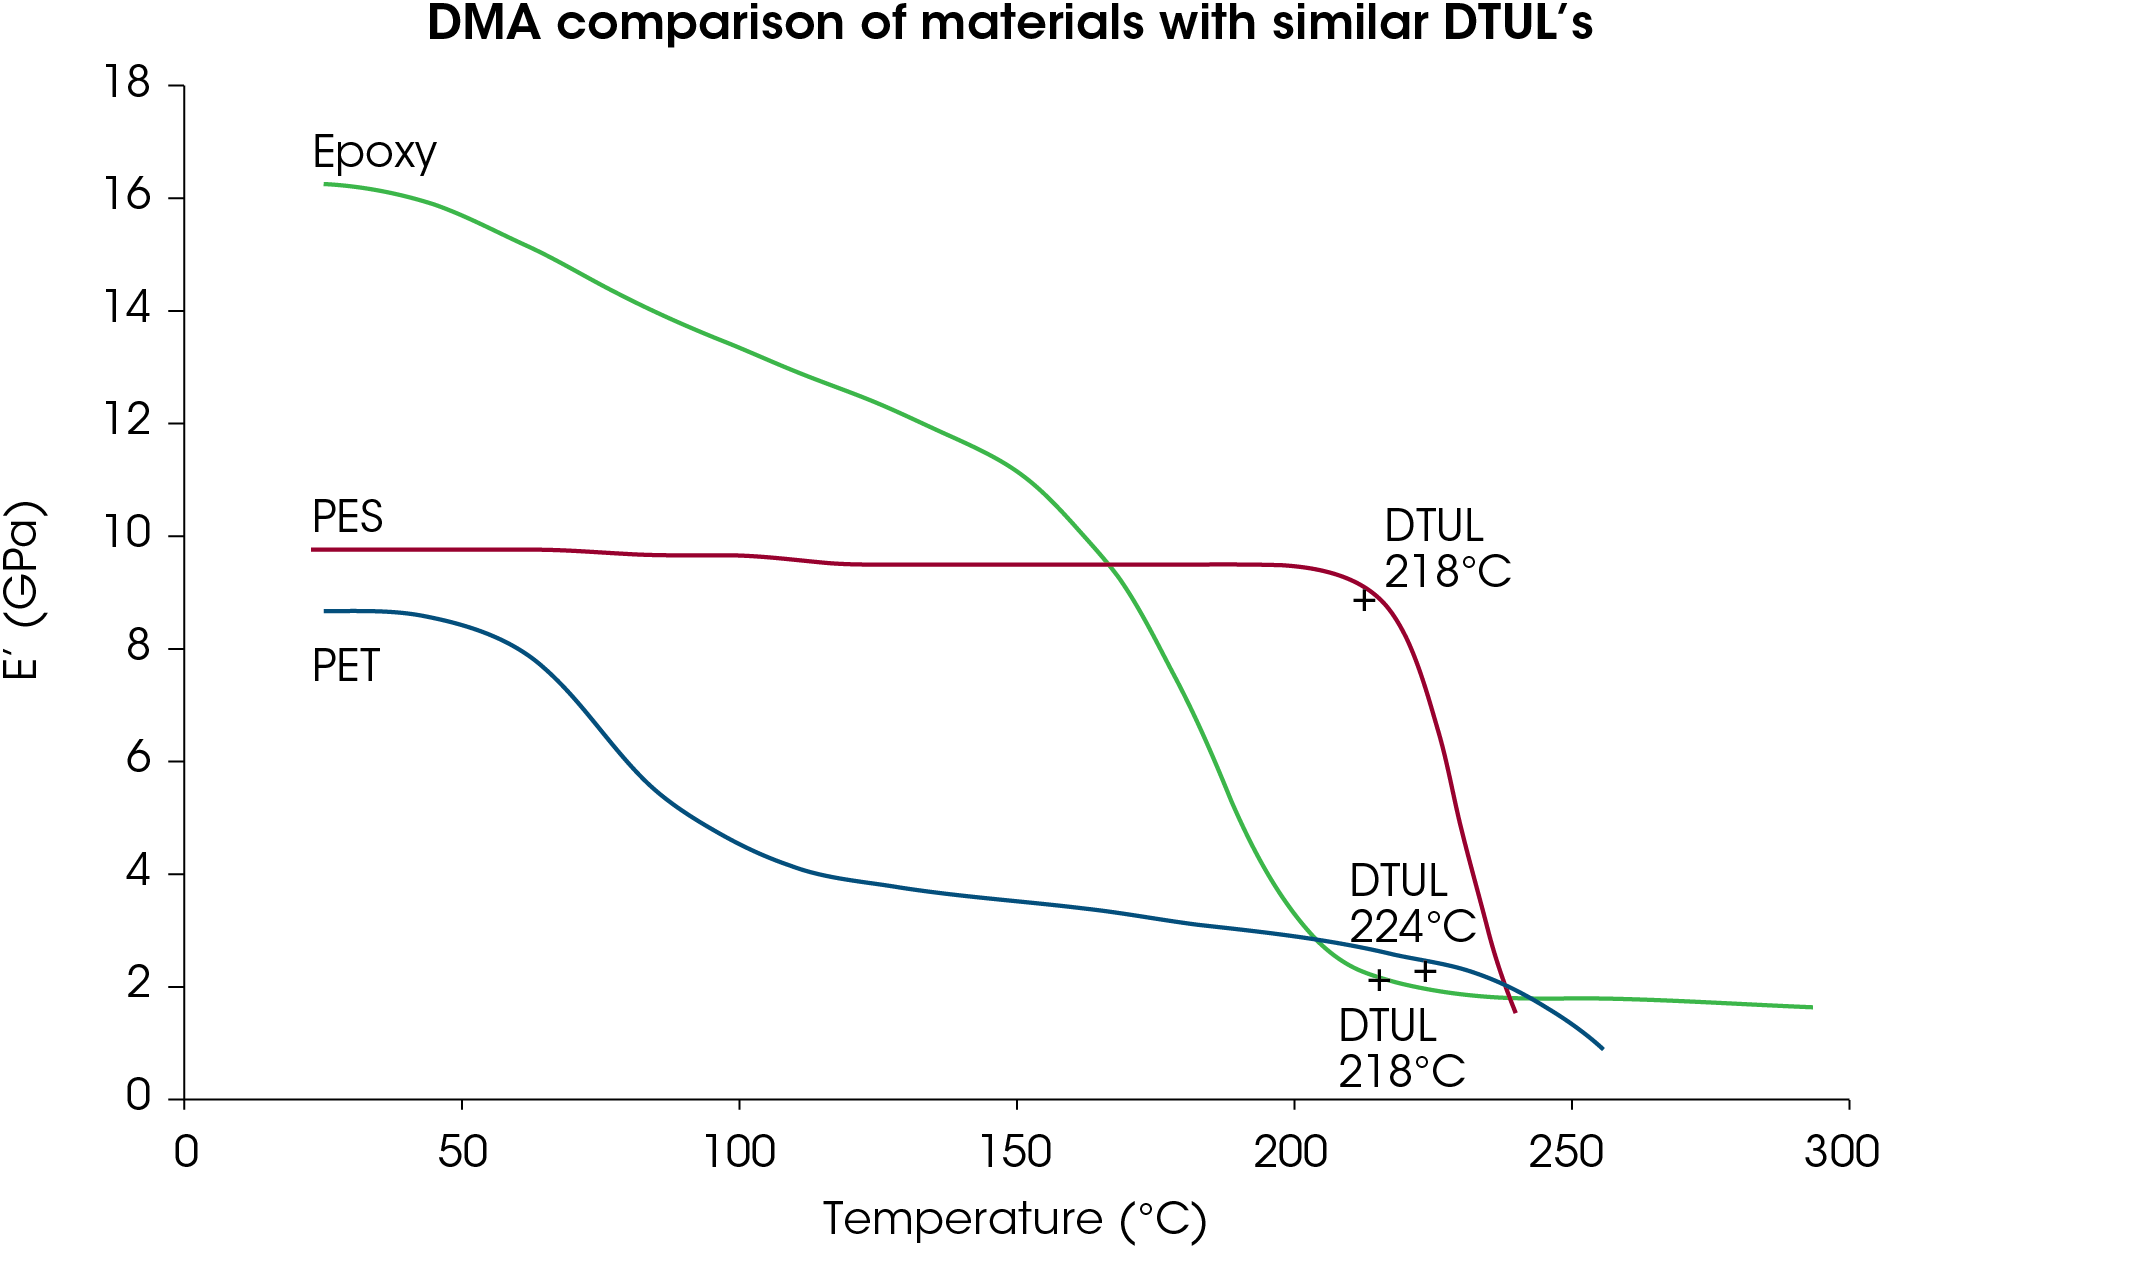
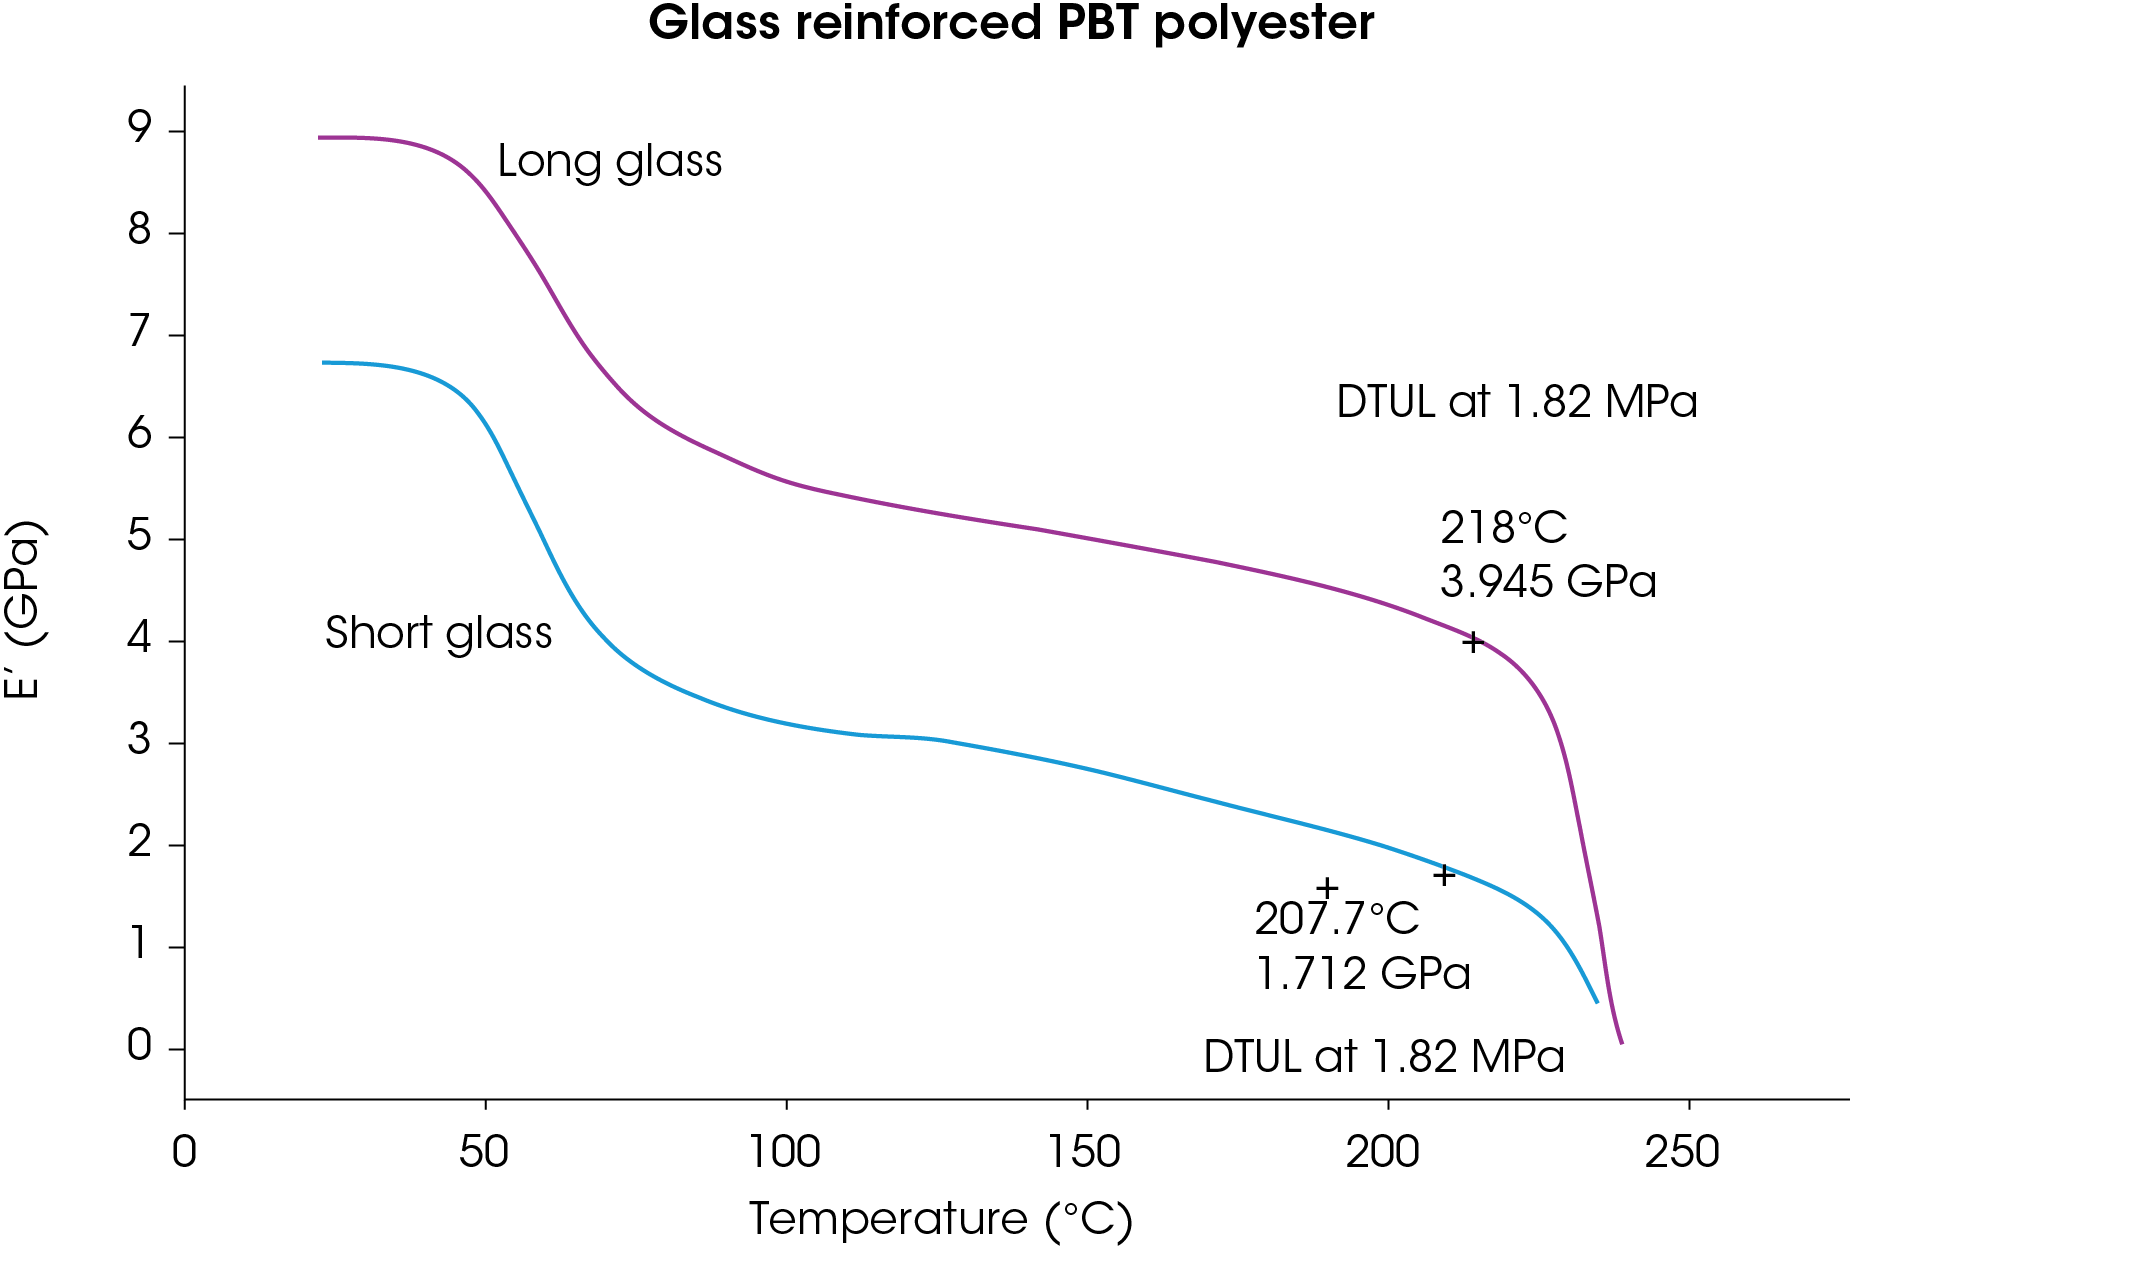
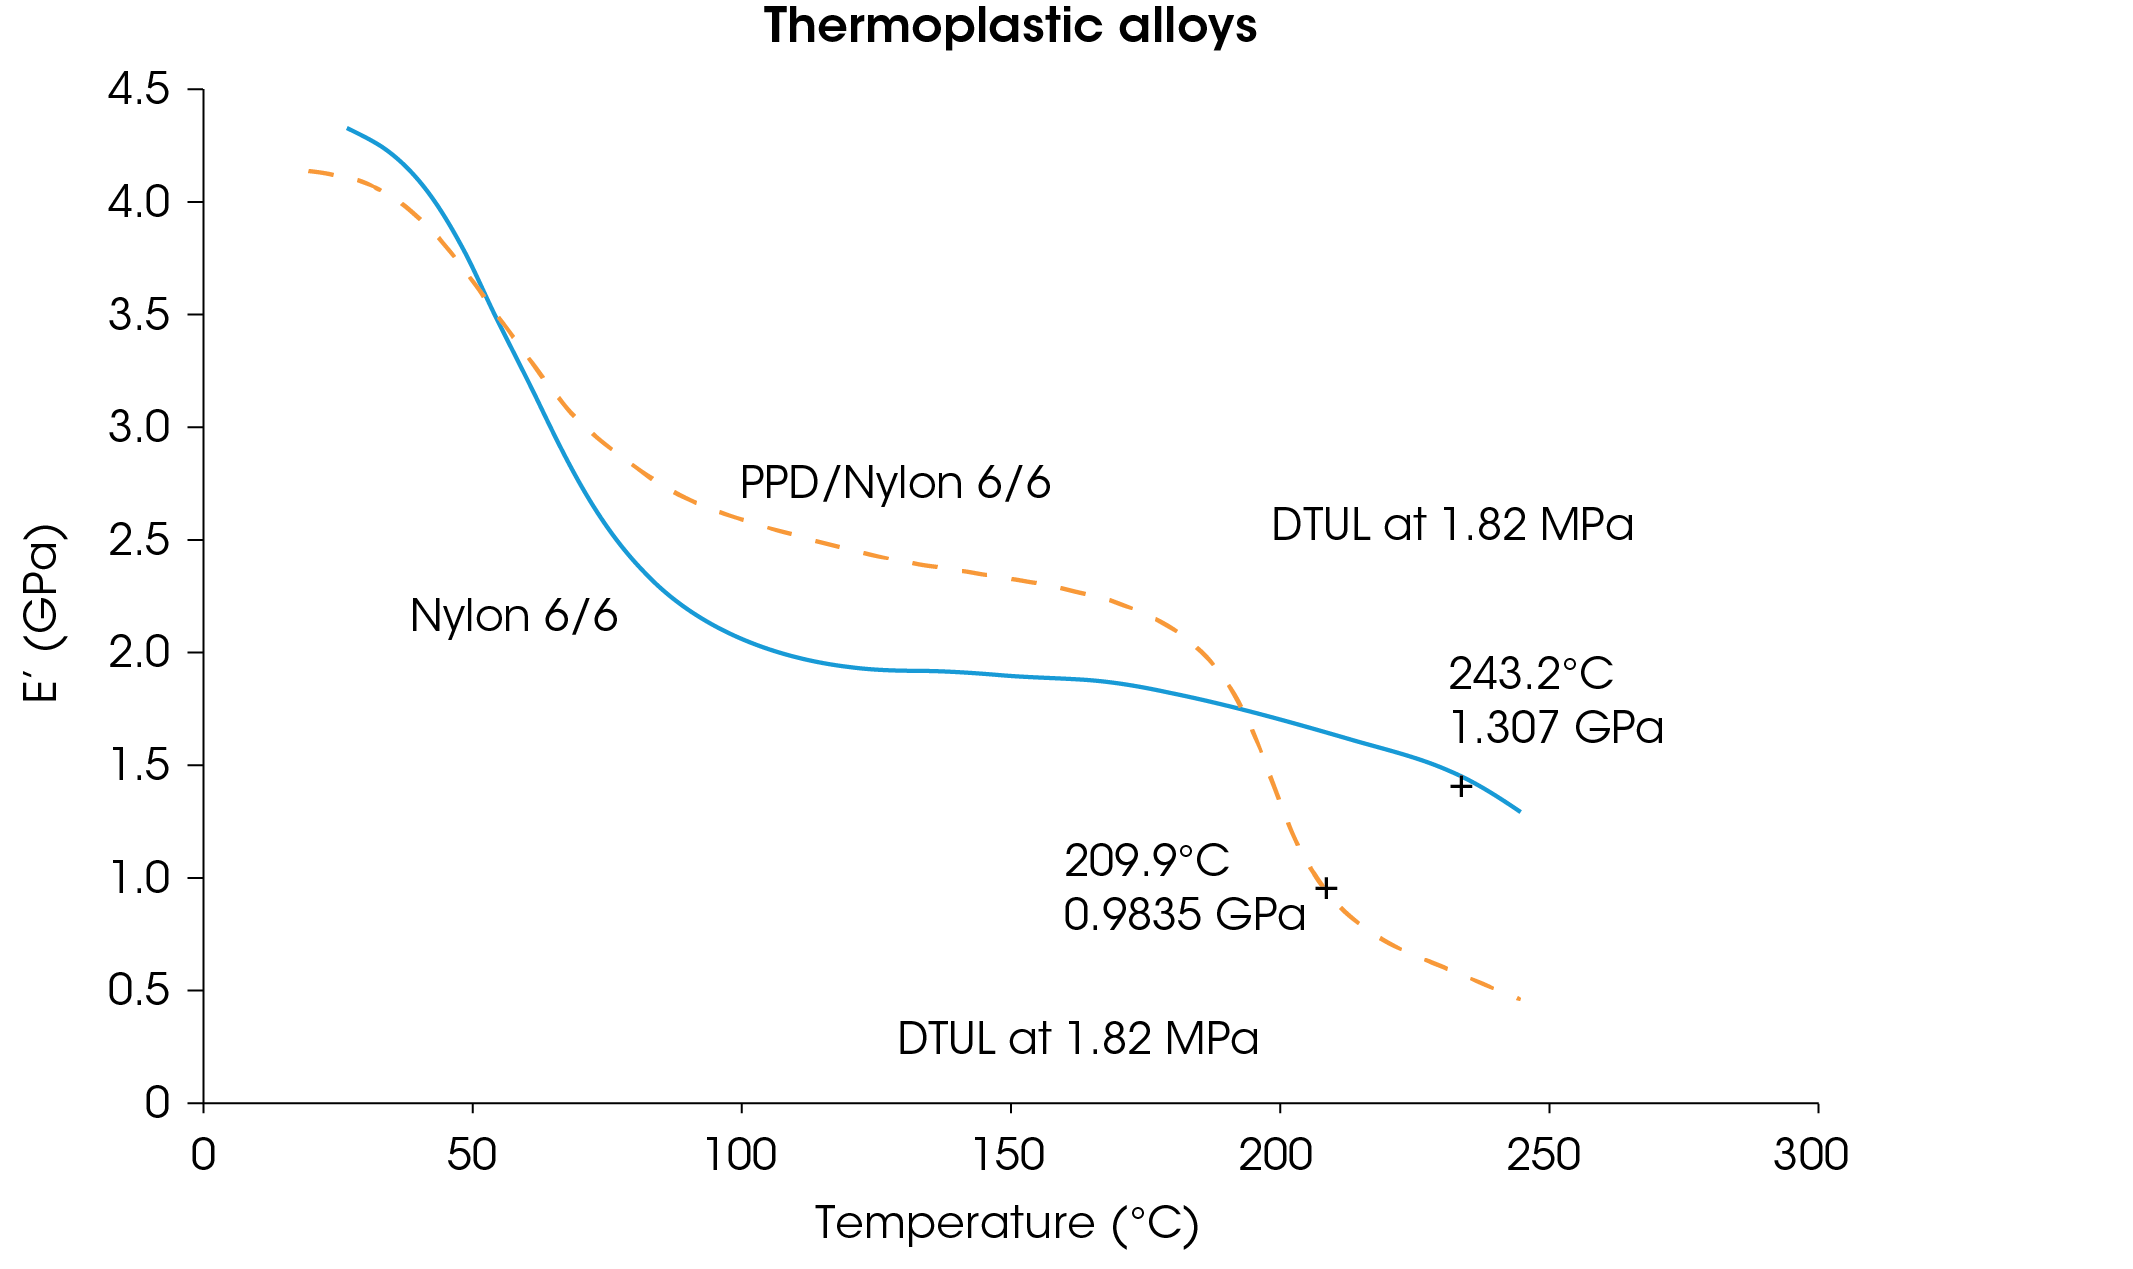
Figure 3 compares a 10% glass reinforced nylon 6/6 with an equivalently reinforced alloy of nylon 6/6 and PPO. The curves clearly show both the advantages and disadvantages of the alloy. The DTUL’s provide little information compared to the complete profile offered by the DMA curves.
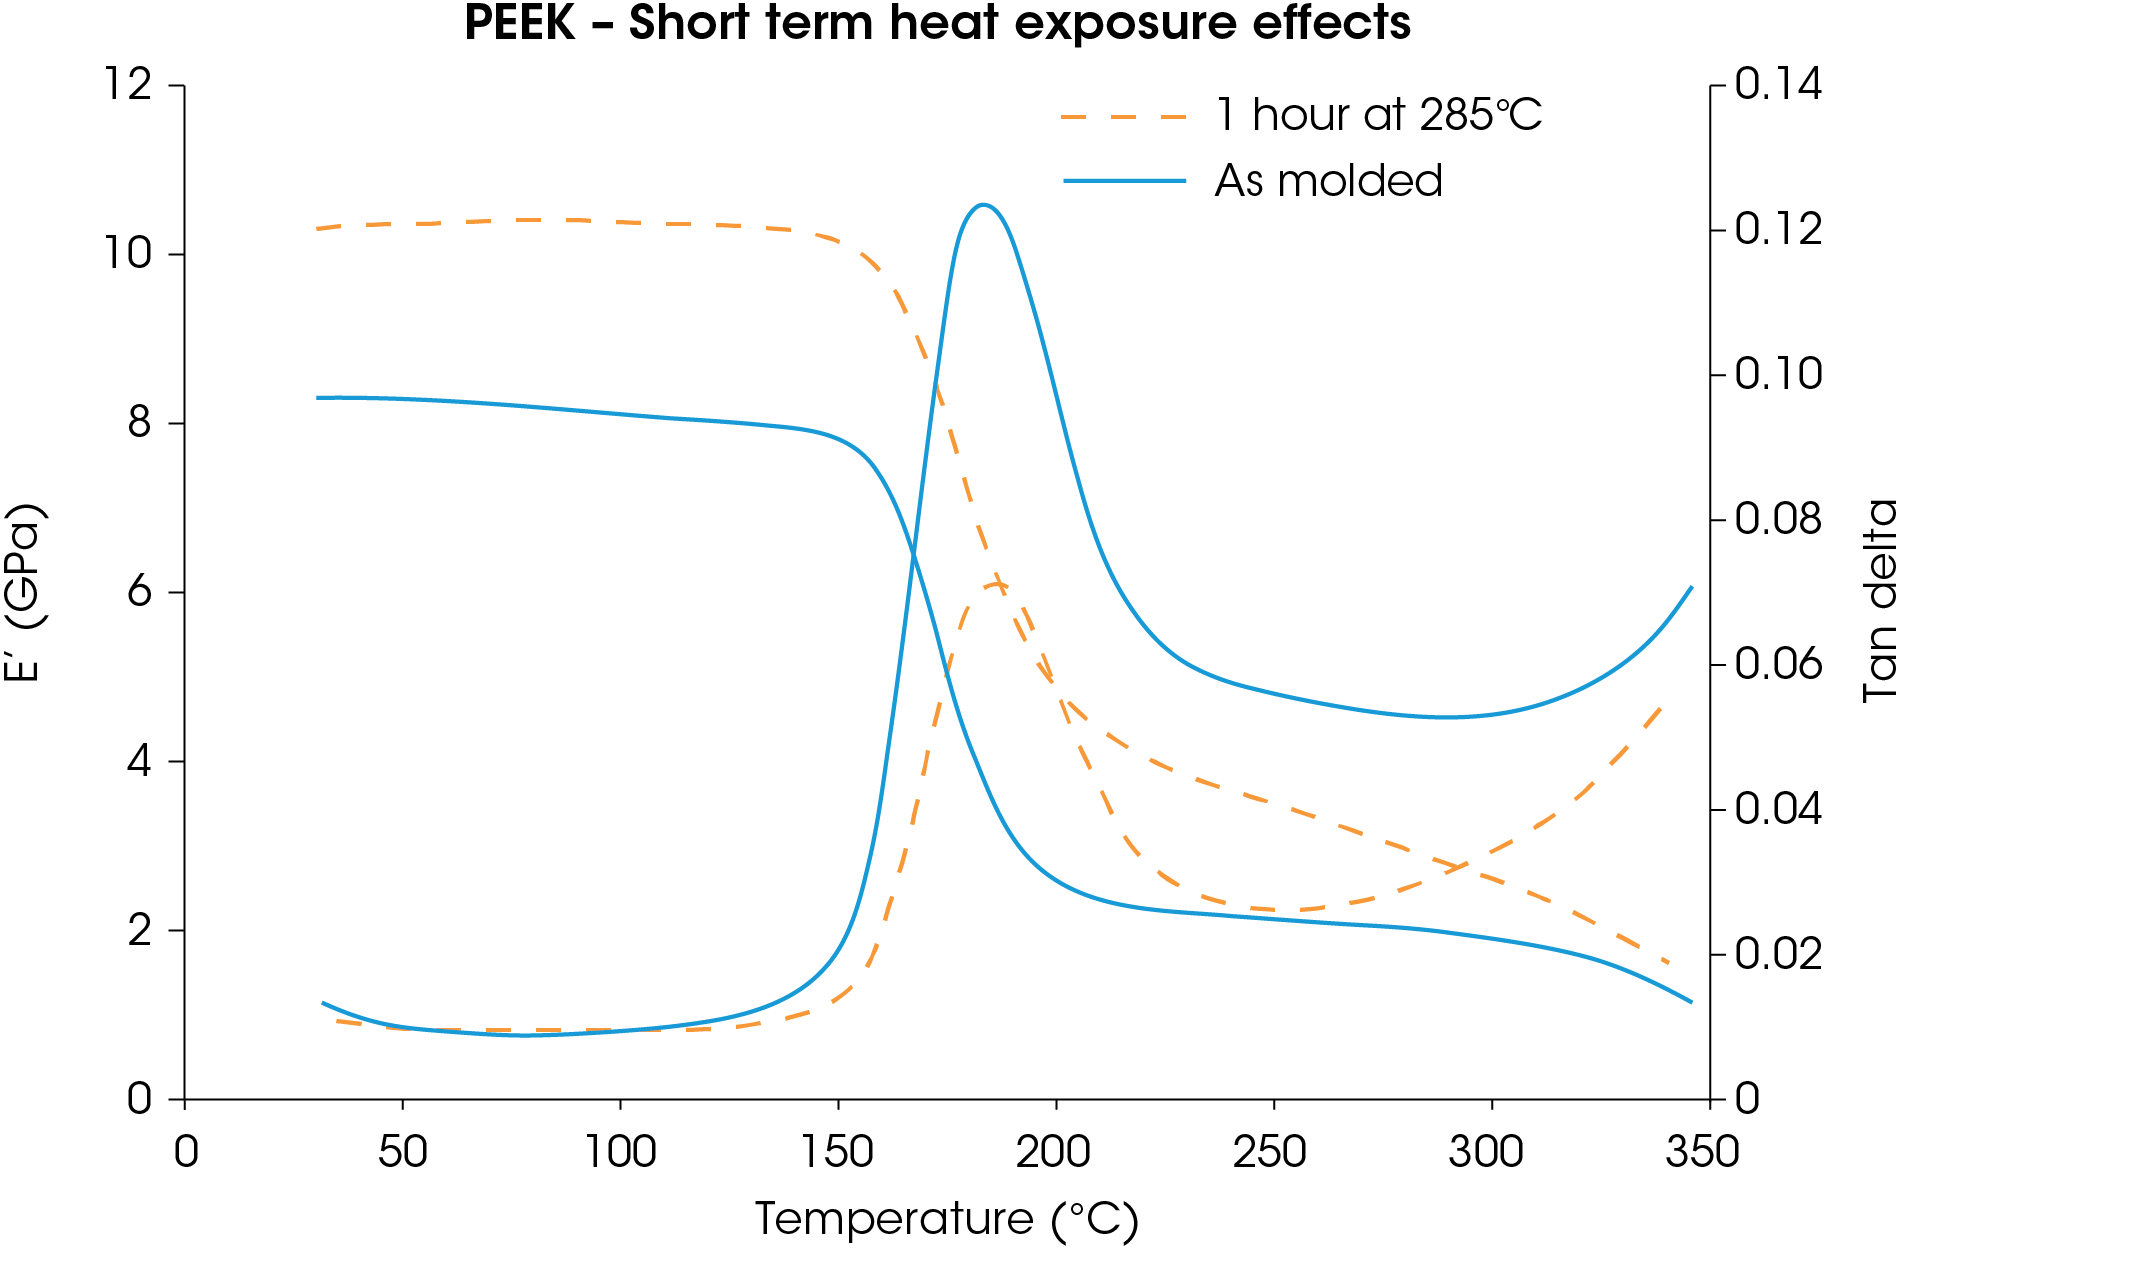
Some semi-crystalline thermoplastic polymers, particularly those with highly aromatic backbone structures, exhibit improved load bearing properties when post baked or exposed to elevated service temperatures. This has effects on properties that are similar to those observed when post curing thermosets, in that stiffness at elevated temperatures improves at the expense of ductility. Figure 4 shows E’ and tan delta vs. Temperature for a reinforced PEEK both as molded and after one hour of exposure at 285 °C. While the room temperature modulus increases by 25% and the effect of the glass transition is reduced, the dampening characteristics of the material have also been reduced and the material is more likely to fail under the sudden stress of impact.
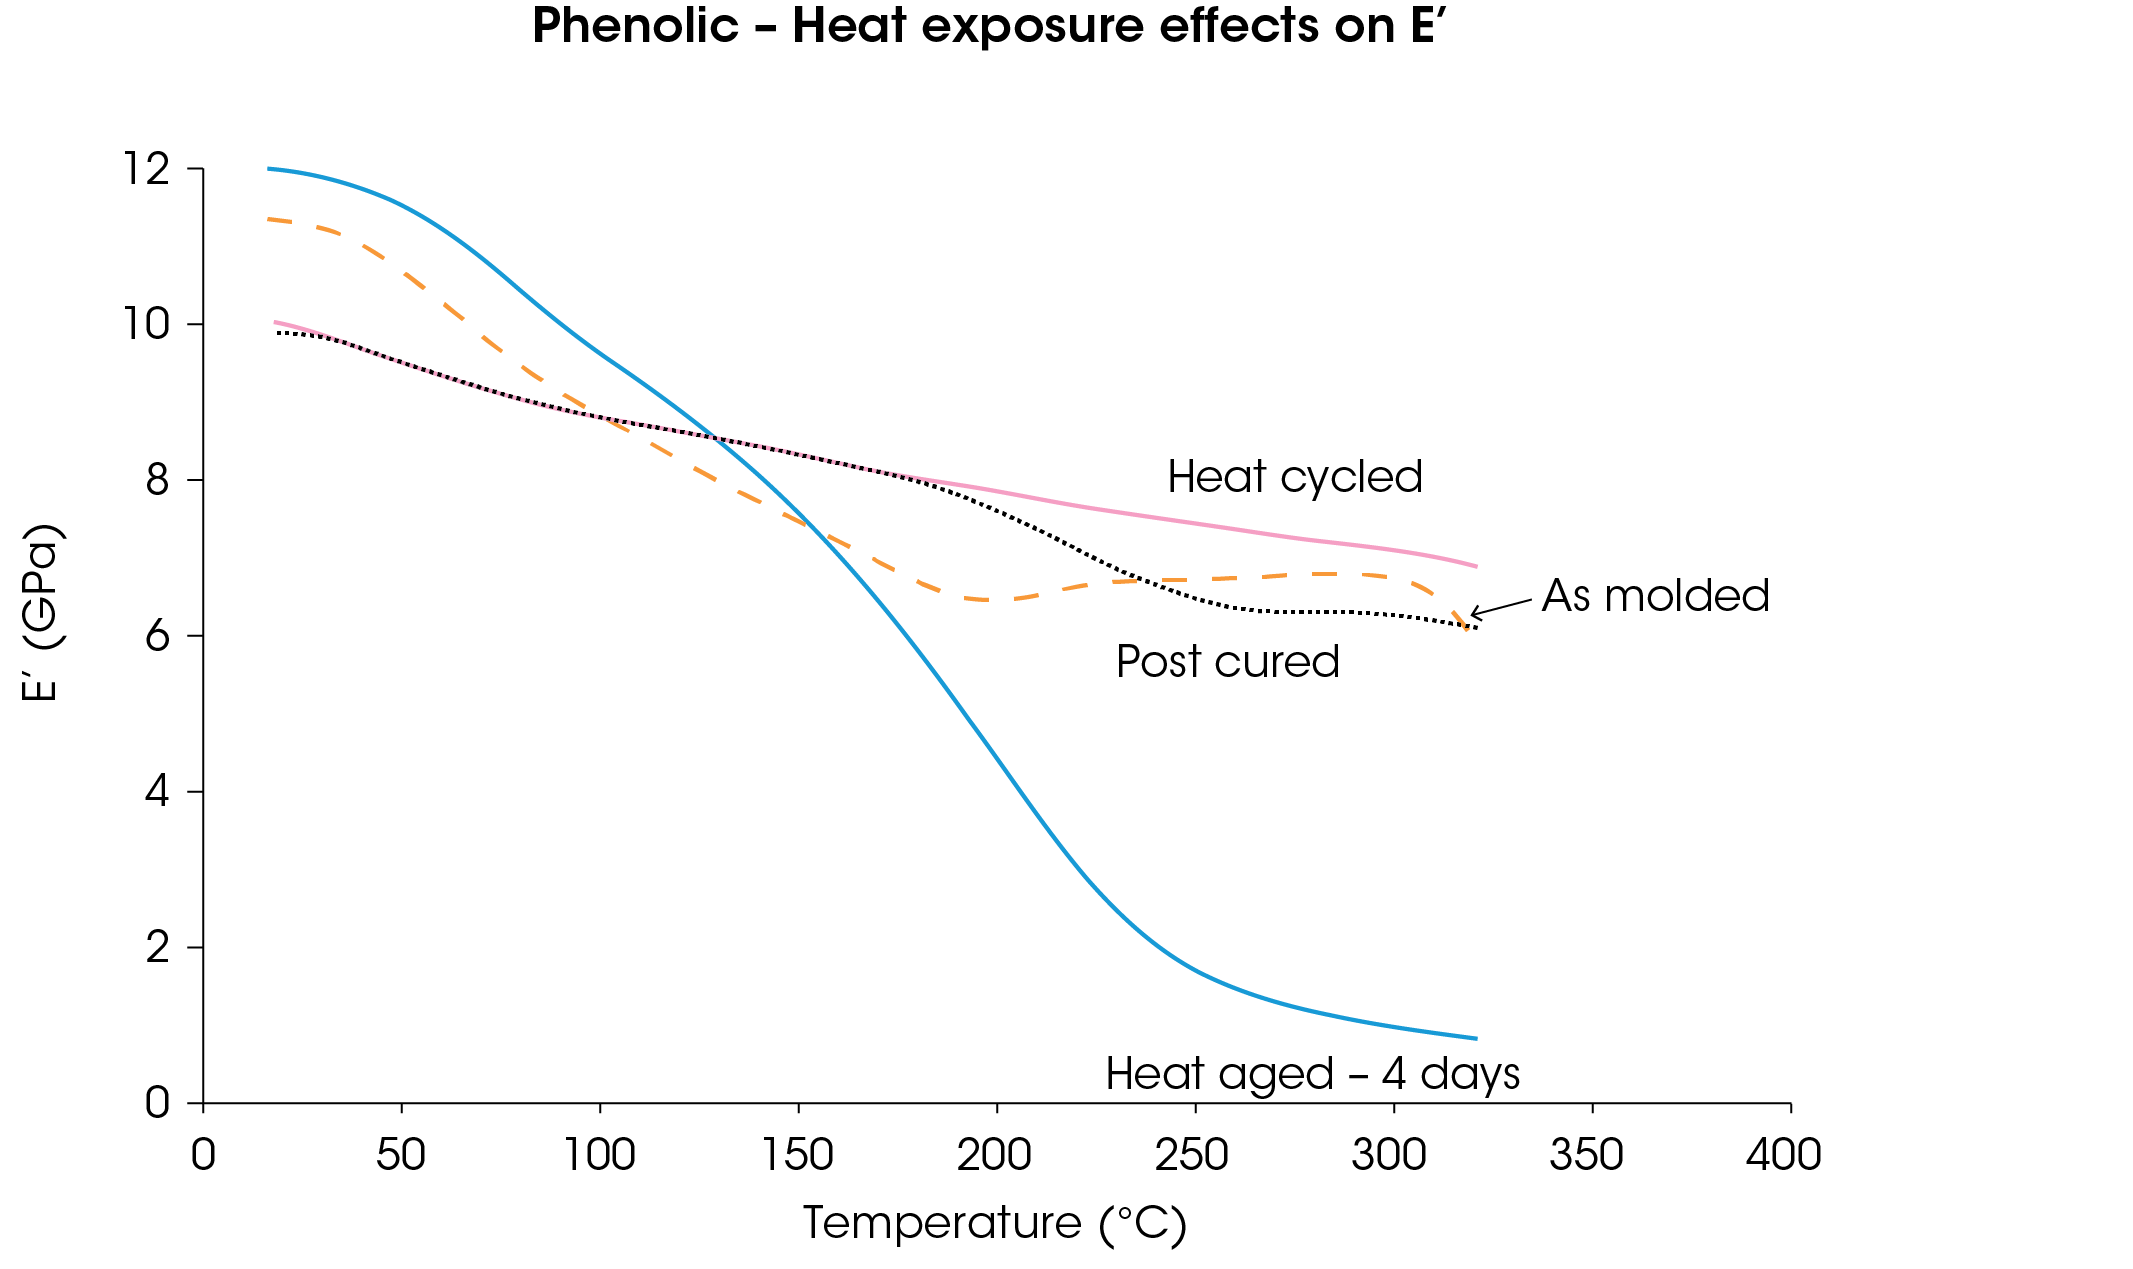
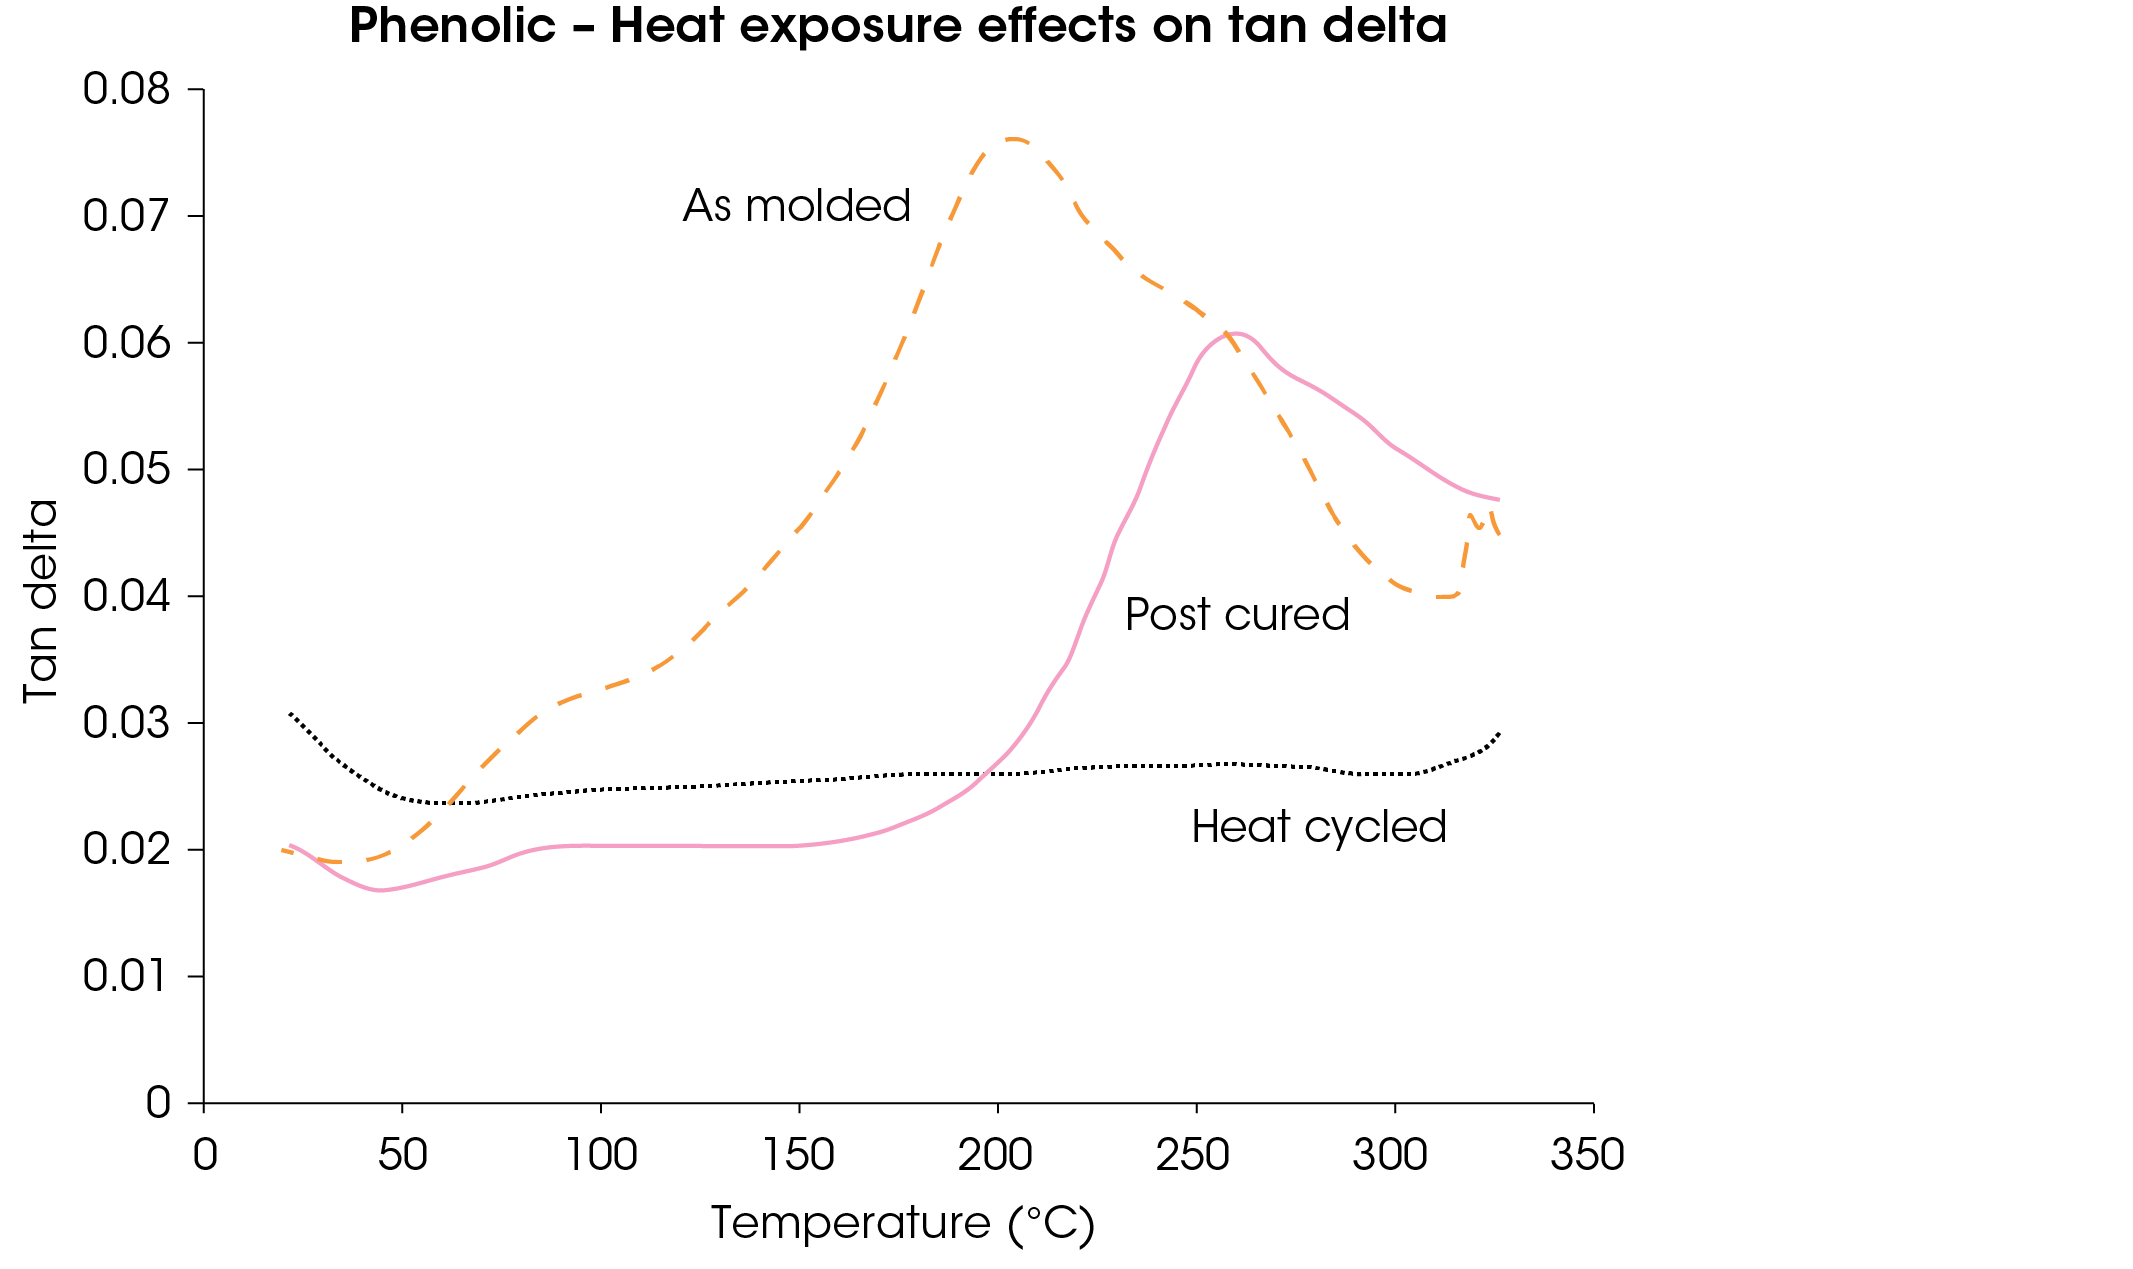
Phenolics display excellent retention of properties at elevated temperatures, but tend to require post curing to develop maximum stability. Phenolics are also prone to oxidation. This initially causes embrittlement and ultimately reduces the effectiveness of the crosslink structure which results in a loss in strength.(2) Figure 5 shows the E’ vs. temperature plots for a high heat phenolic at four different stages; as molded, post cured for 24 hours at 150 °C, heated from 25–315 °C over a three hour period and heating over the same range over a 96 hour period. Post curing has the obvious effect of stabilizing the resin above Tg and provides the best balance of high temperature performance and impact resistance. The three hour heat cycle improves modulus performance, but the tan delta plots in Figure 6 show clearly that this apparent improvement results in a structure with little damping capabilities. The 96 hour heat aging produces sufficient disruption of the crosslink structure to seriously under-mine the high temperature performance of the resin despite the absence of any visual evidence of softening or blistering.
Because polymeric materials are viscoelastic in nature, behavior under load is time as well as temperature dependent. A constant load exerted for a prolonged period of time will produce a decline in modulus just as increases in temperature will. The response of a material to constant loading is expressed as the apparent modulus. The instantaneous modulus is a ratio of applied stress to initial strain:

where E is the flexural modulus, σ is the applied stress, and ε is the resulting strain. If a load is maintained over a period of time the equation is modified to

where Ea is the apparent modulus, σt is the stress applied over time, εo is the initial strain, and ε1 is the continued strain, or creep, that occurs over time. The greater the creep in a material, the greater the decline in modulus.
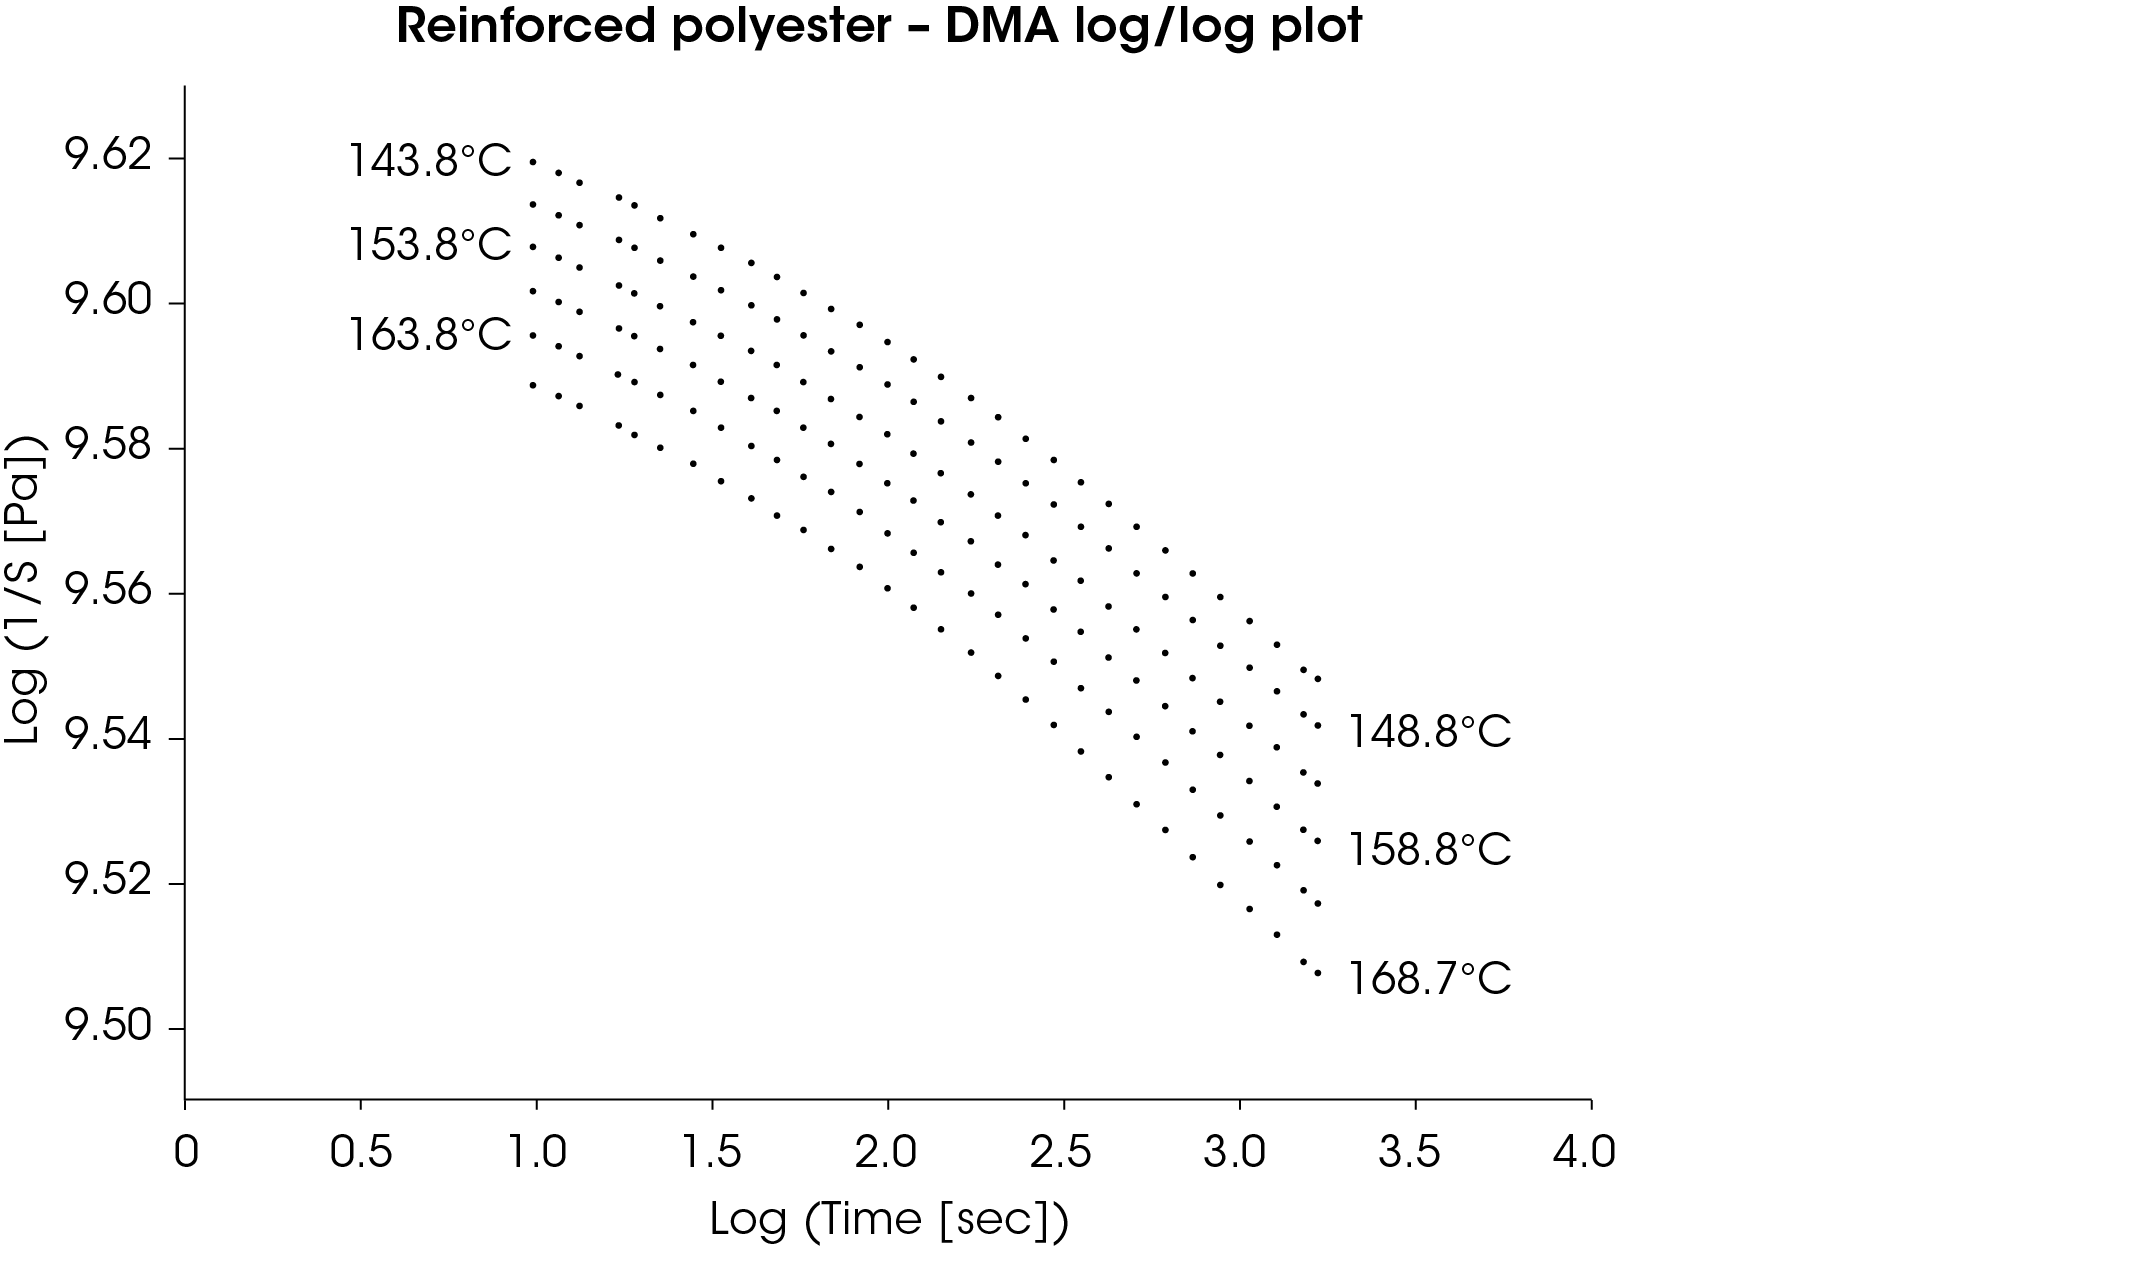
Figure 7 shows a log-log plot of apparent modulus vs. time for a reinforced polyester. Stress was applied for 30 minutes at six different temperatures. This clearly shows that the time dependent effects of a 30 minute loading at 143.8 °C are more significant than the instantaneous effect of a 25 °C increase in temperature. By using the technique of time-temperature superpositioning (3-5), a master curve of the material behavior at a reference temperature can be developed that extends beyond the actual duration of the test.
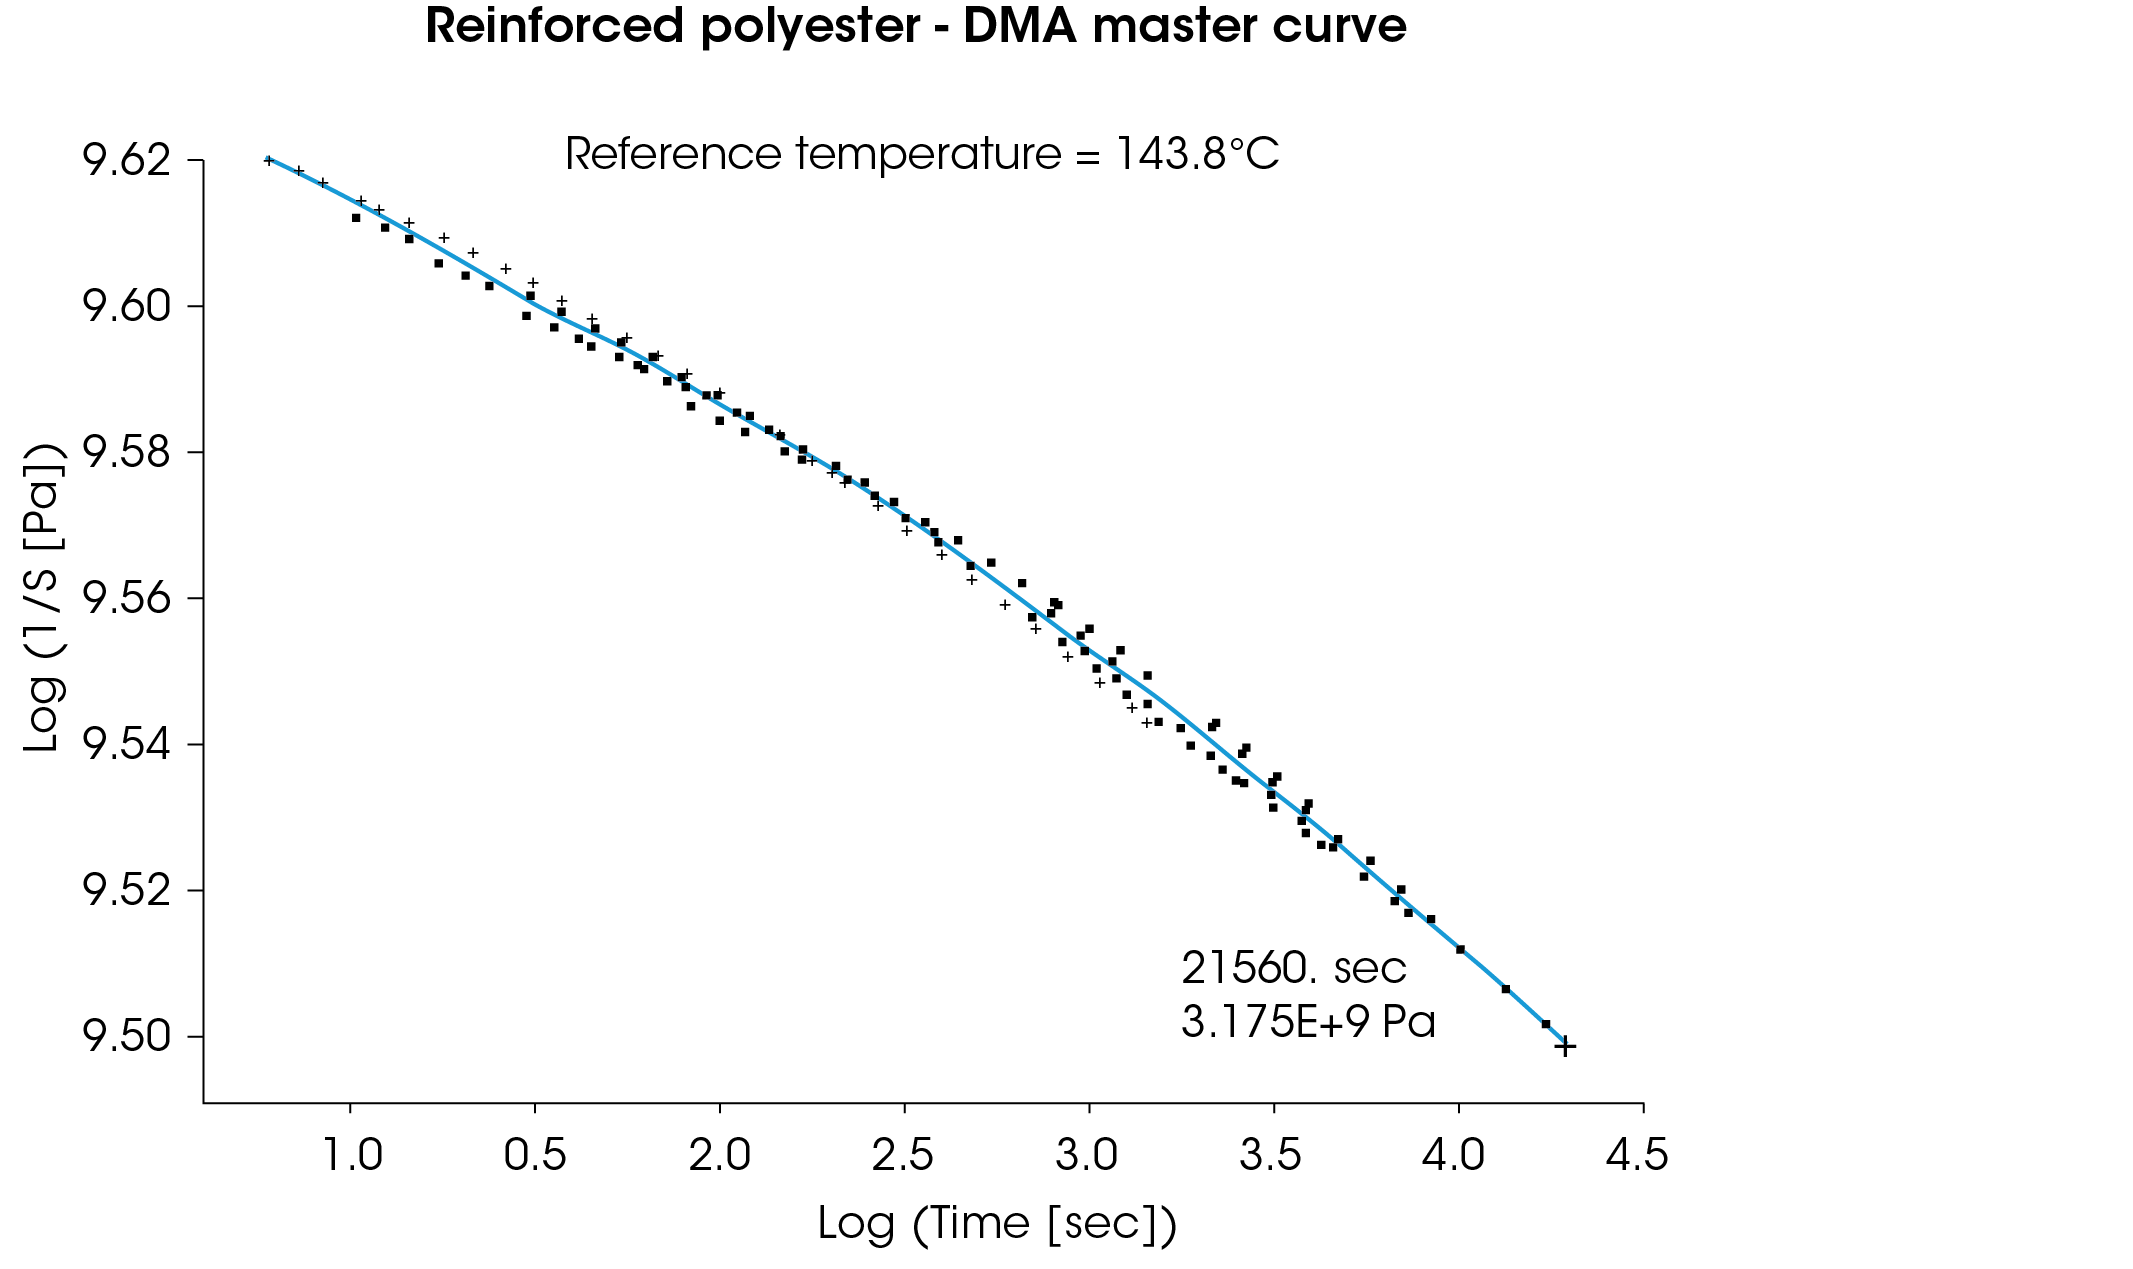
Figure 8 illustrates the master curve generated for a reference temperature of 143.8 °C which shows an endpoint six hours after the time of initial loading and predicts a loss in modulus of 25% over that period. With the use of more temperature steps the master curve can be extended further out in time.
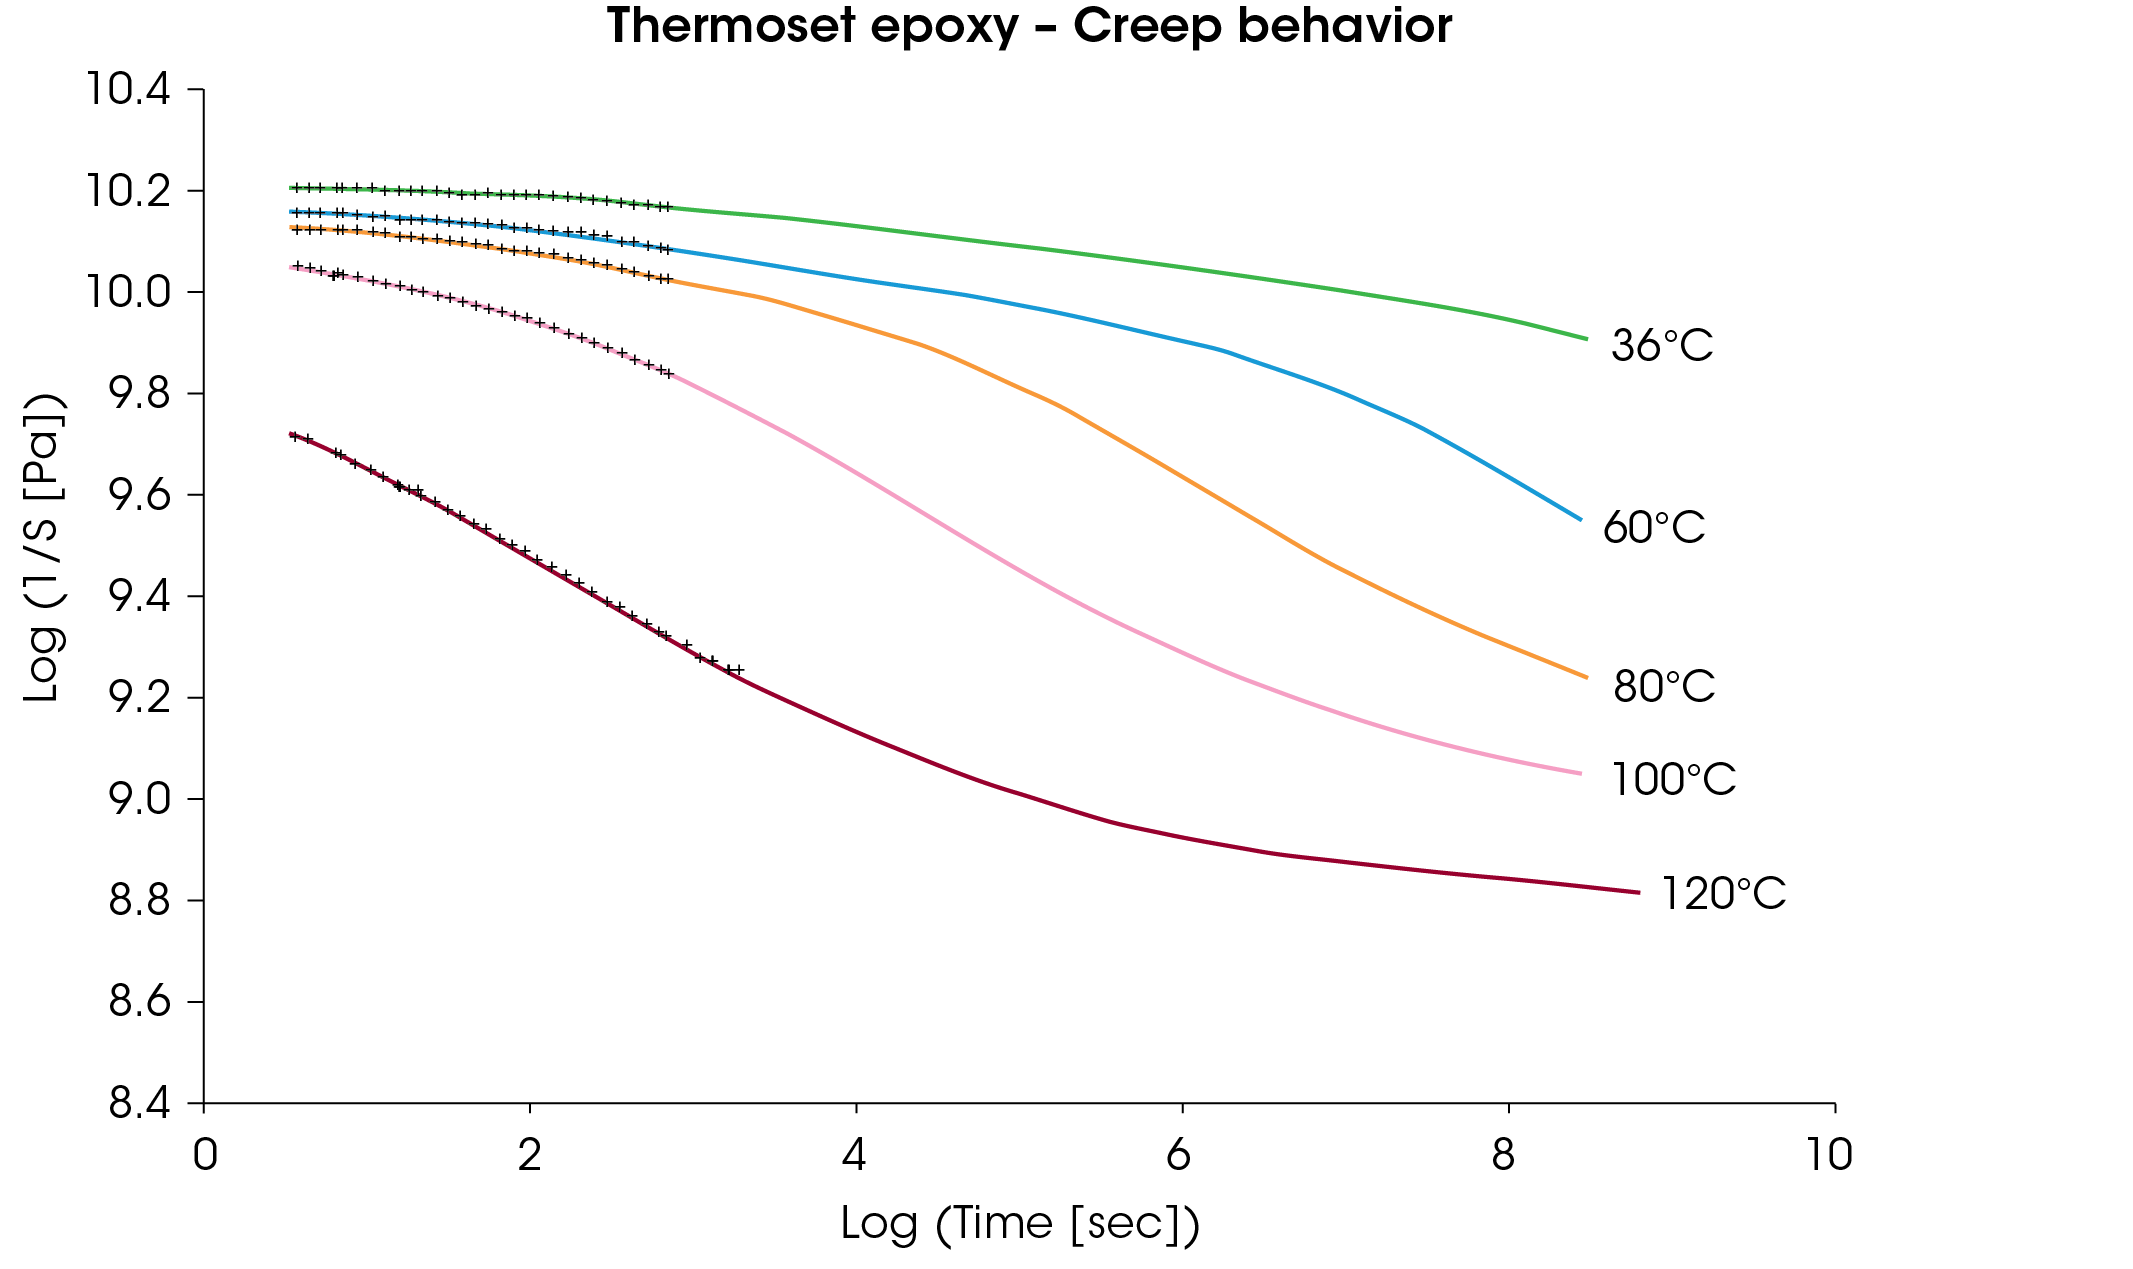
A use temperature that closely approaches a transition will result in large effects on the apparent modulus that may not be readily apparent from an examination of the temperature dependent behavior alone. Figure 9 shows master curves for an epoxy at five different temperatures, four of which are below the Tg of the resin. Despite the relatively minor change in modulus that results from an increase in temperature below Tg, the time related effects become more significant and occur over shorter times as the reference temperature approaches the glass transition temperature.
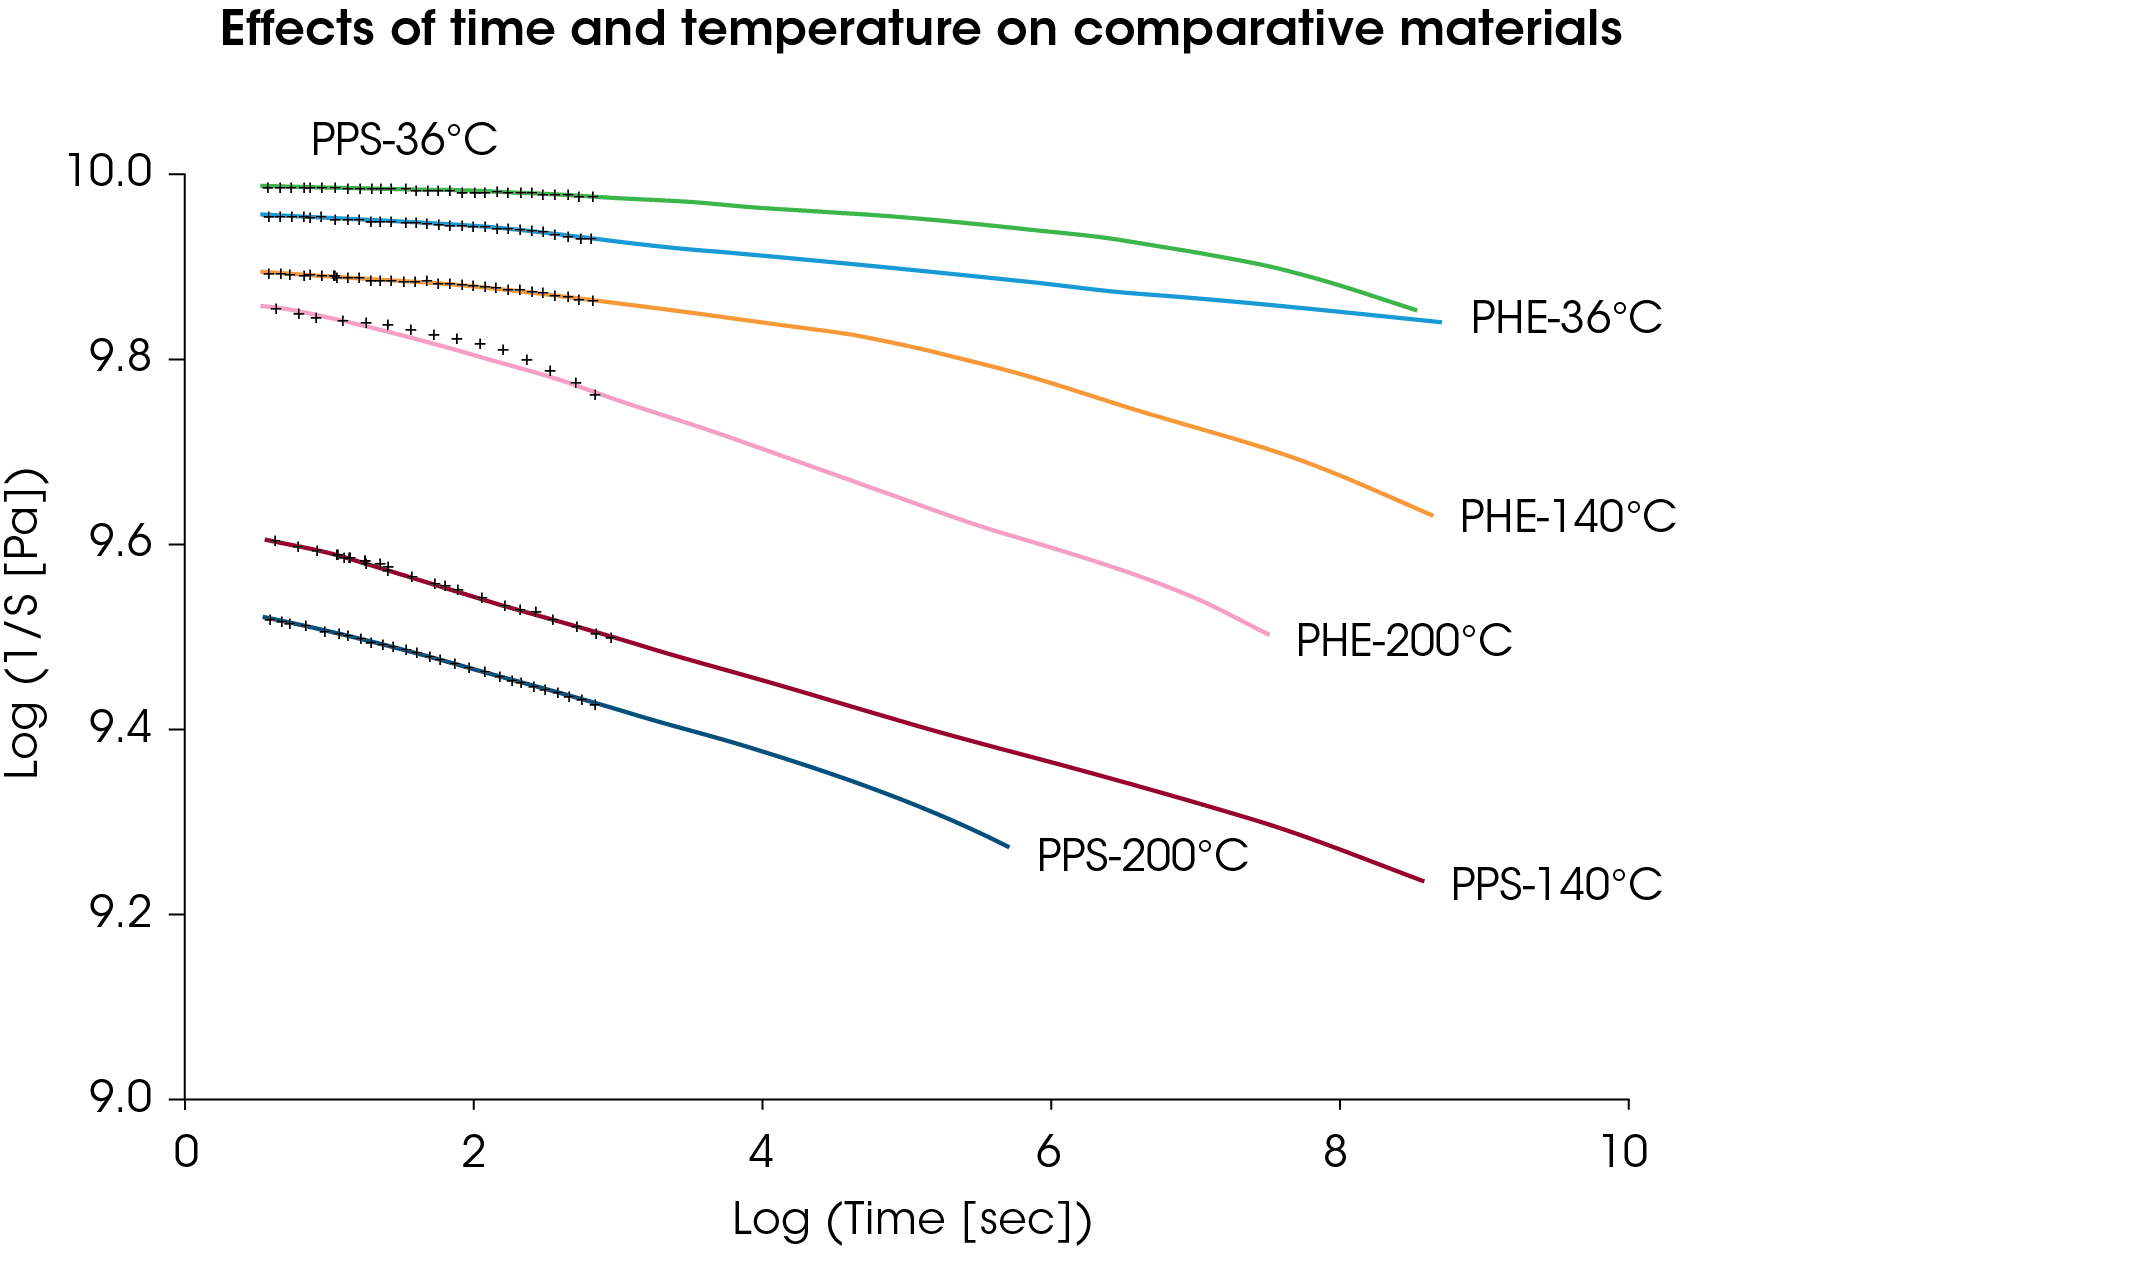
Fitness for use above Tg will depend largely upon the stability of a crystalline or crosslinked constituent. Two materials that may appear equivalent over time at room temperature will behave very differently at elevated temperatures if one material undergoes its glass transition at a lower temperature than the other. Figure 10 shows master curves for a PPS and a high heat phenolic that have the same DTUL. The Tg of the thermoplastic PPS is 105 °C while that of the phenolic is above 200 °C.
The effects of changes in reinforcement are far more evident when evaluated over time. PET polyesters typically display improved stiffness and creep resistance over PBT polyesters, and the master curves for commercial 30% short glass fiber reinforced materials bear this out. However, enhancements to the resin-fiber interface or the use of longer fibers can provide a considerable advantage to the more easily processed PBT across a wide range of temperatures above Tg. DTUL values will still show the PET to have the highest heat resistance but the master curves generated for a reference temperature of 100 °C clearly show the improvements to the PBT resin. Figure 11 shows these curves and notes the property chart DTUL values associated with each resin. Figure 12 compares the apparent modulus vs. time for a PET polyester using 30% glass fiber reinforcement and a 35% glass/mineral combination. At reference temperatures of 100 °C and 150 °C the two materials begin virtually equivalent. However, the improved creep resistance of the system relying solely on glass is very evident.
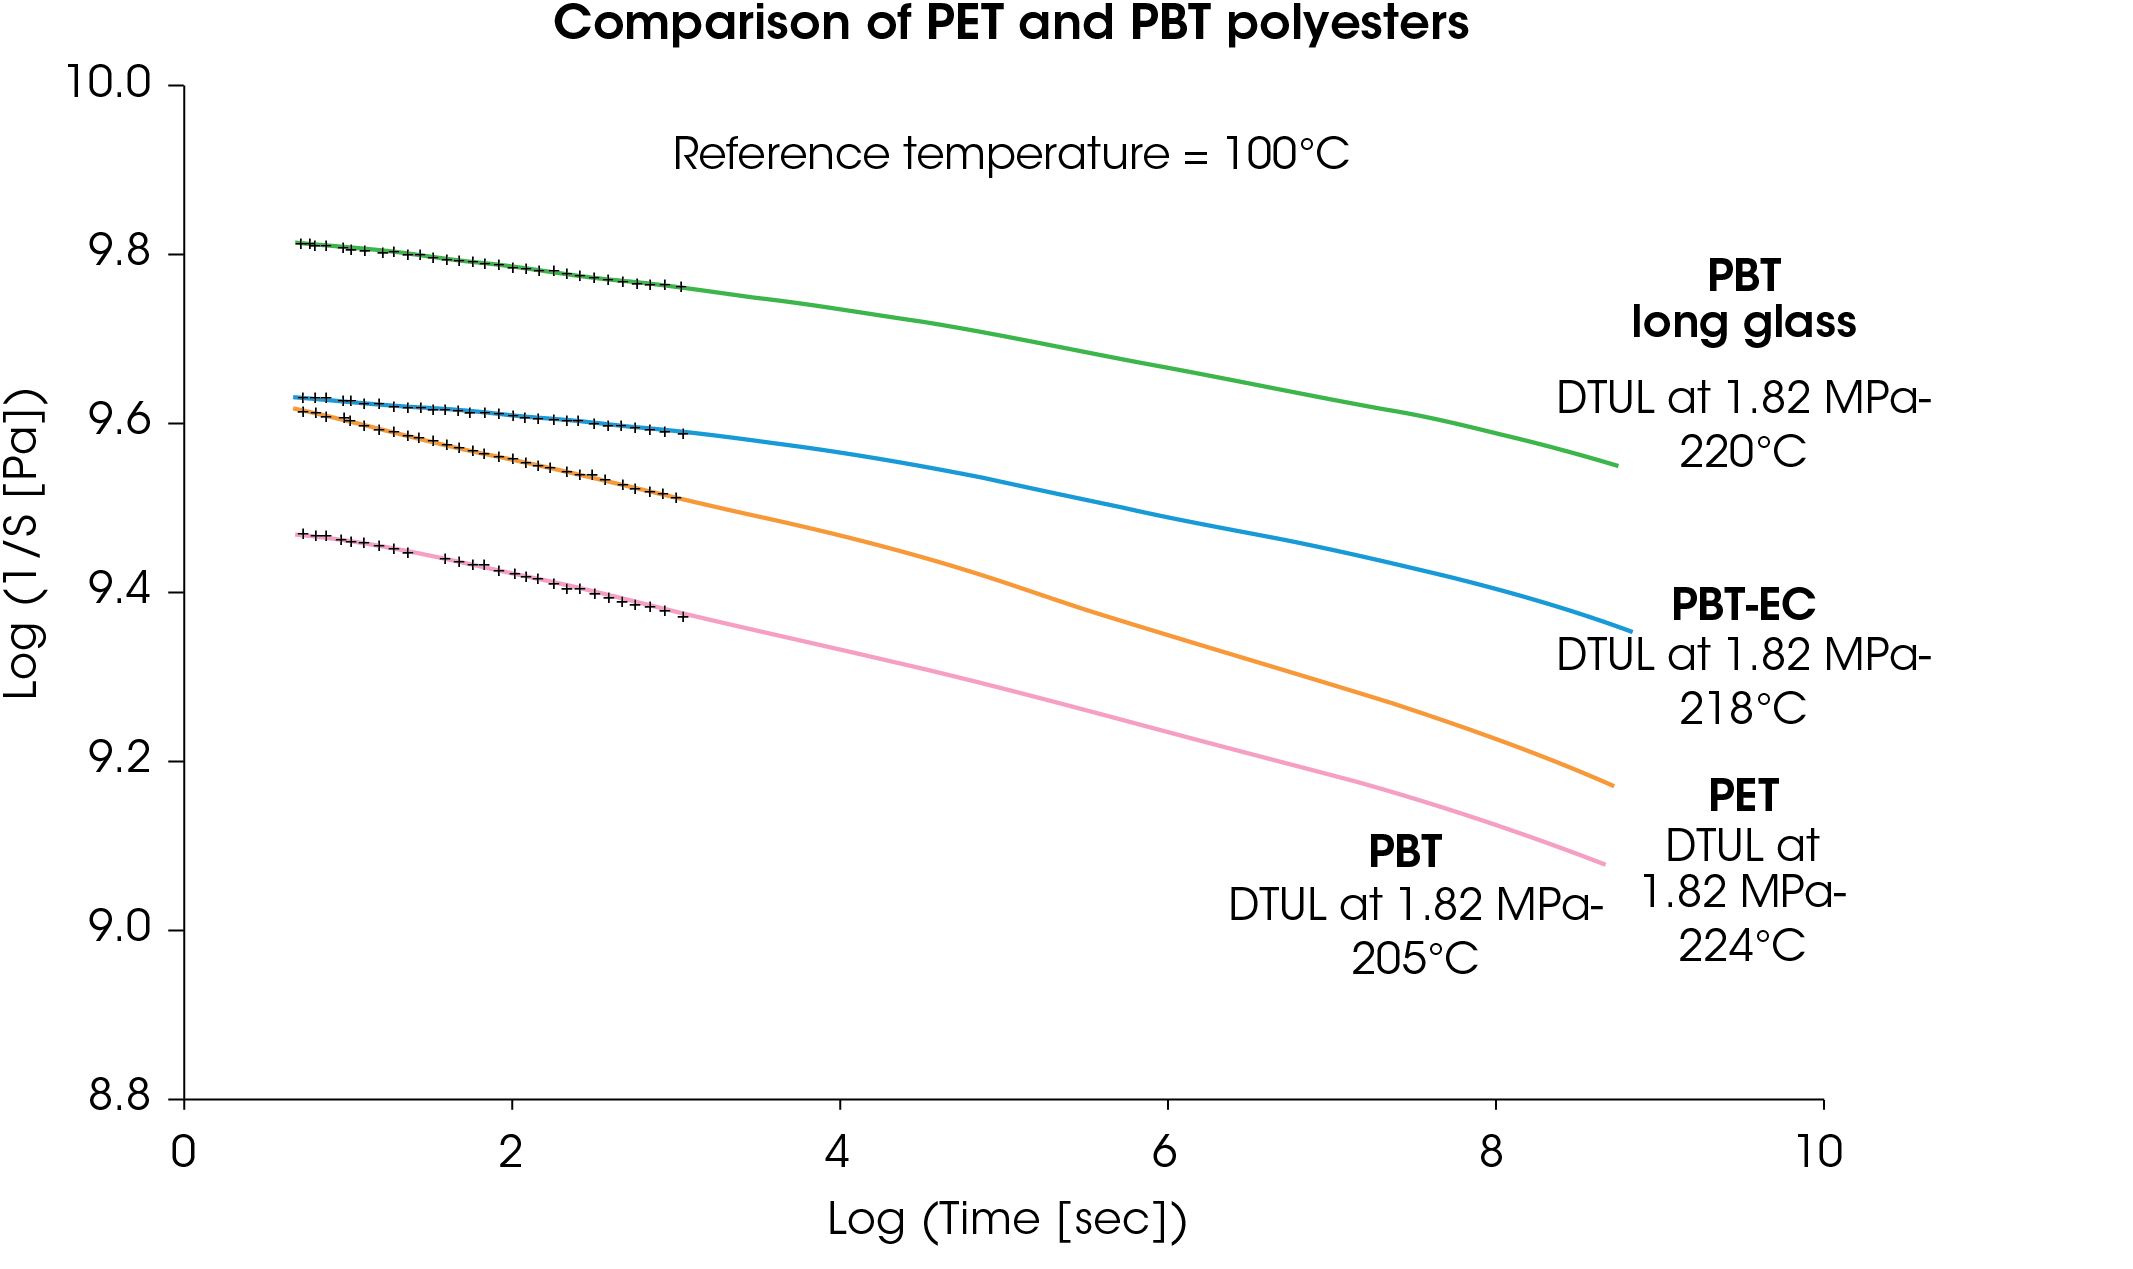
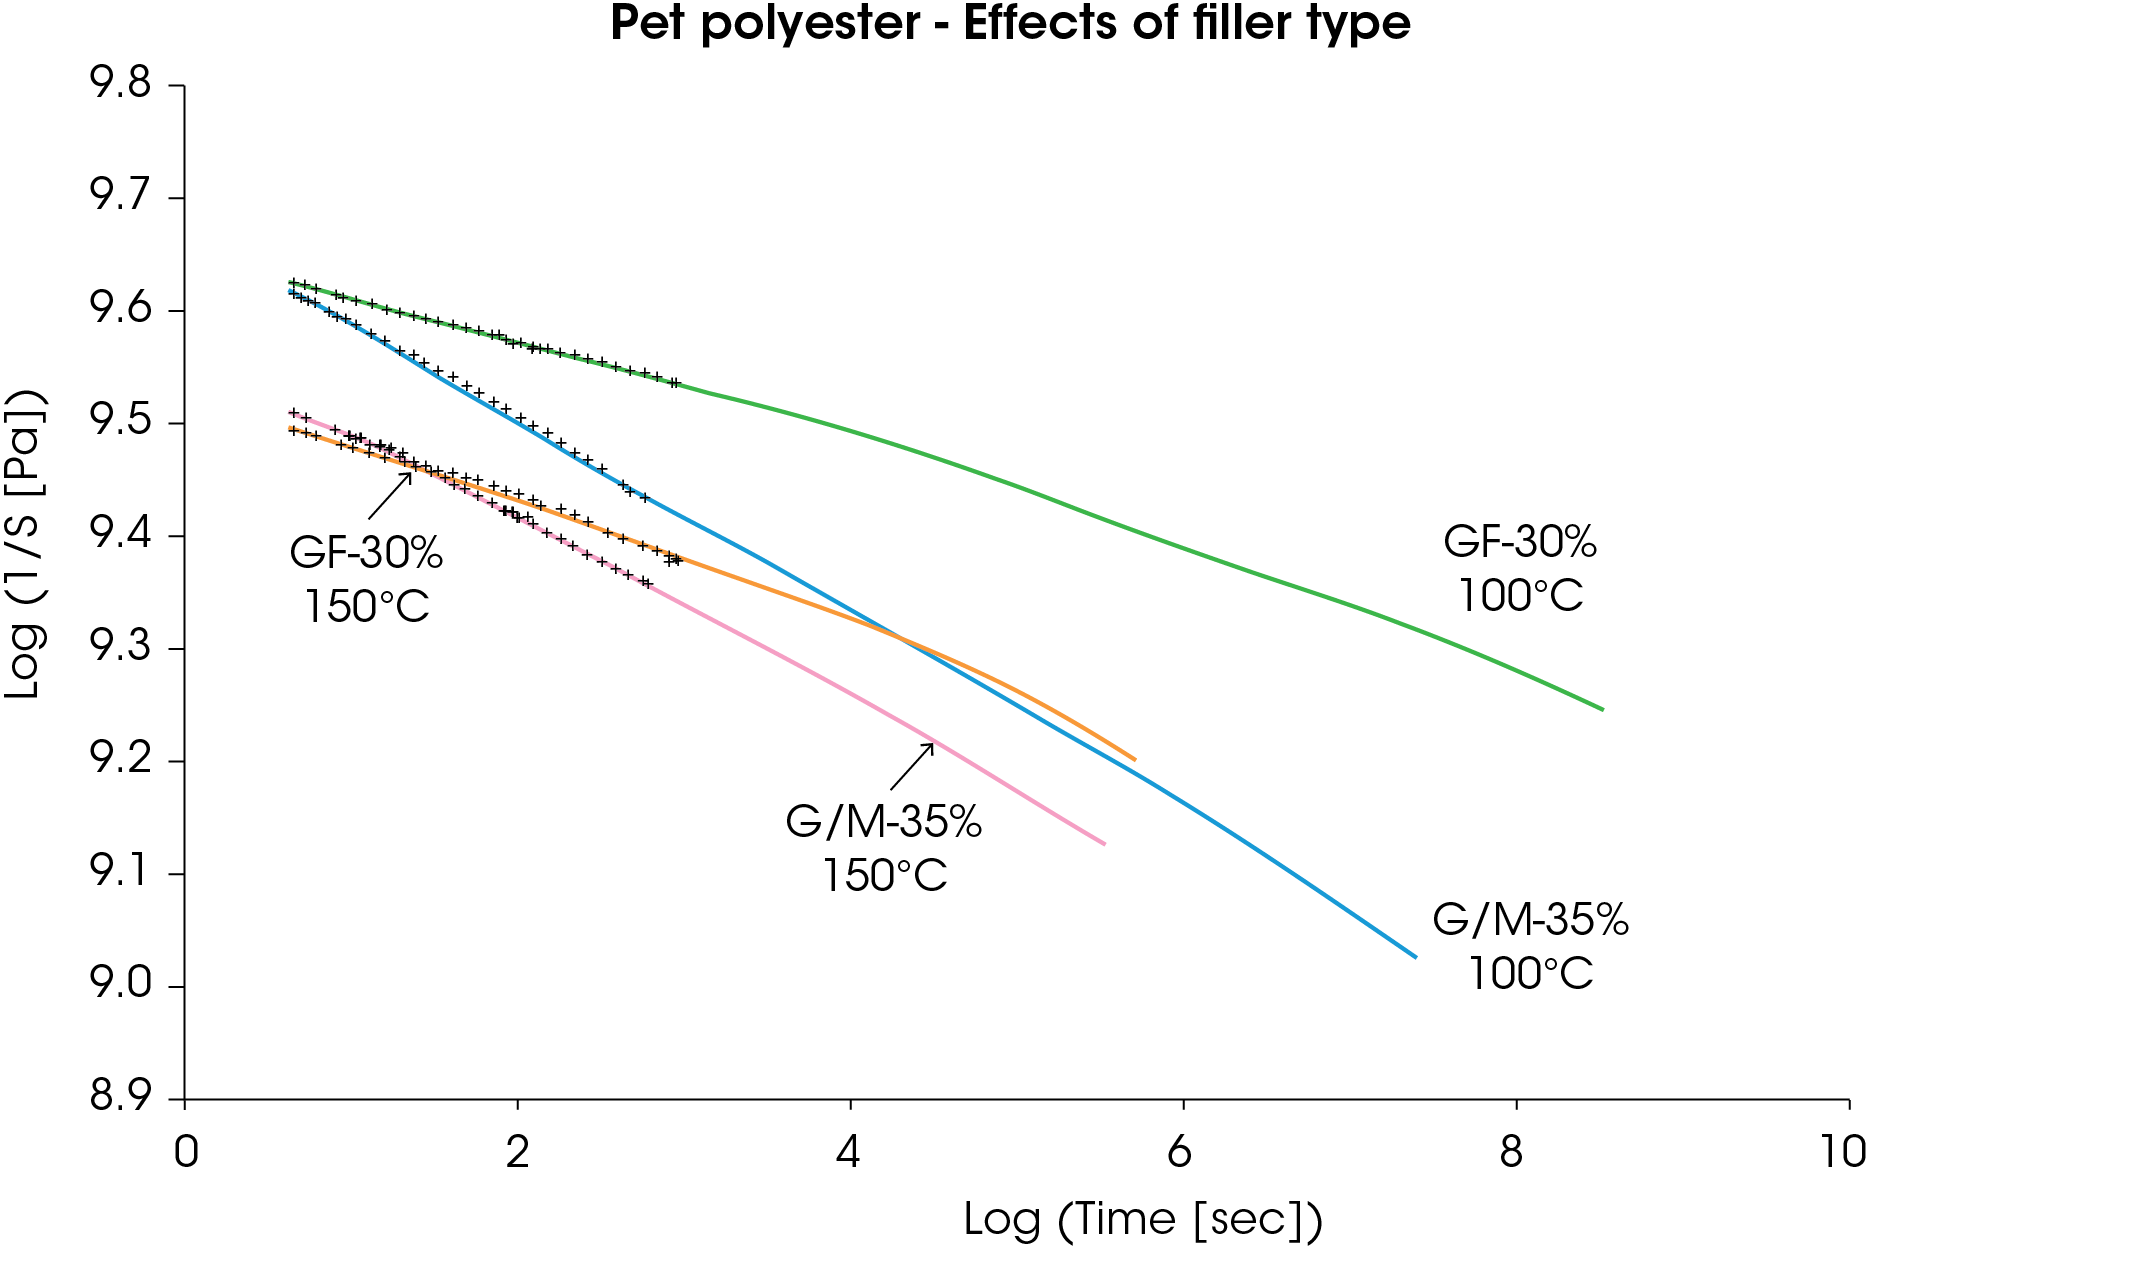
Figure 13 shows the effect of a flame retardant additive on a 30% glass reinforced PBT polyester. While the initial modulus of the flame retardant resin is greater at both reference temperatures, the superior stability of the unmodified resin is evident from the master curves. It takes less than four months for an apparent 50% advantage in stiffness of the FR material to disappear under load at 100 °C.
When small temperature ranges are used to produce the master curves and attention is given to fitting the shift factors to an appropriate model, the accuracy of the master curves proves to be very good within the framework of the short-term tests that have been conducted for verification. Figure 14 plots apparent modulus vs. time on a linear scale for an impact modified phenolic. It compares the predictions of the master curve for a reference temperature of 150 °C with an actual test conducted for 42 hours.
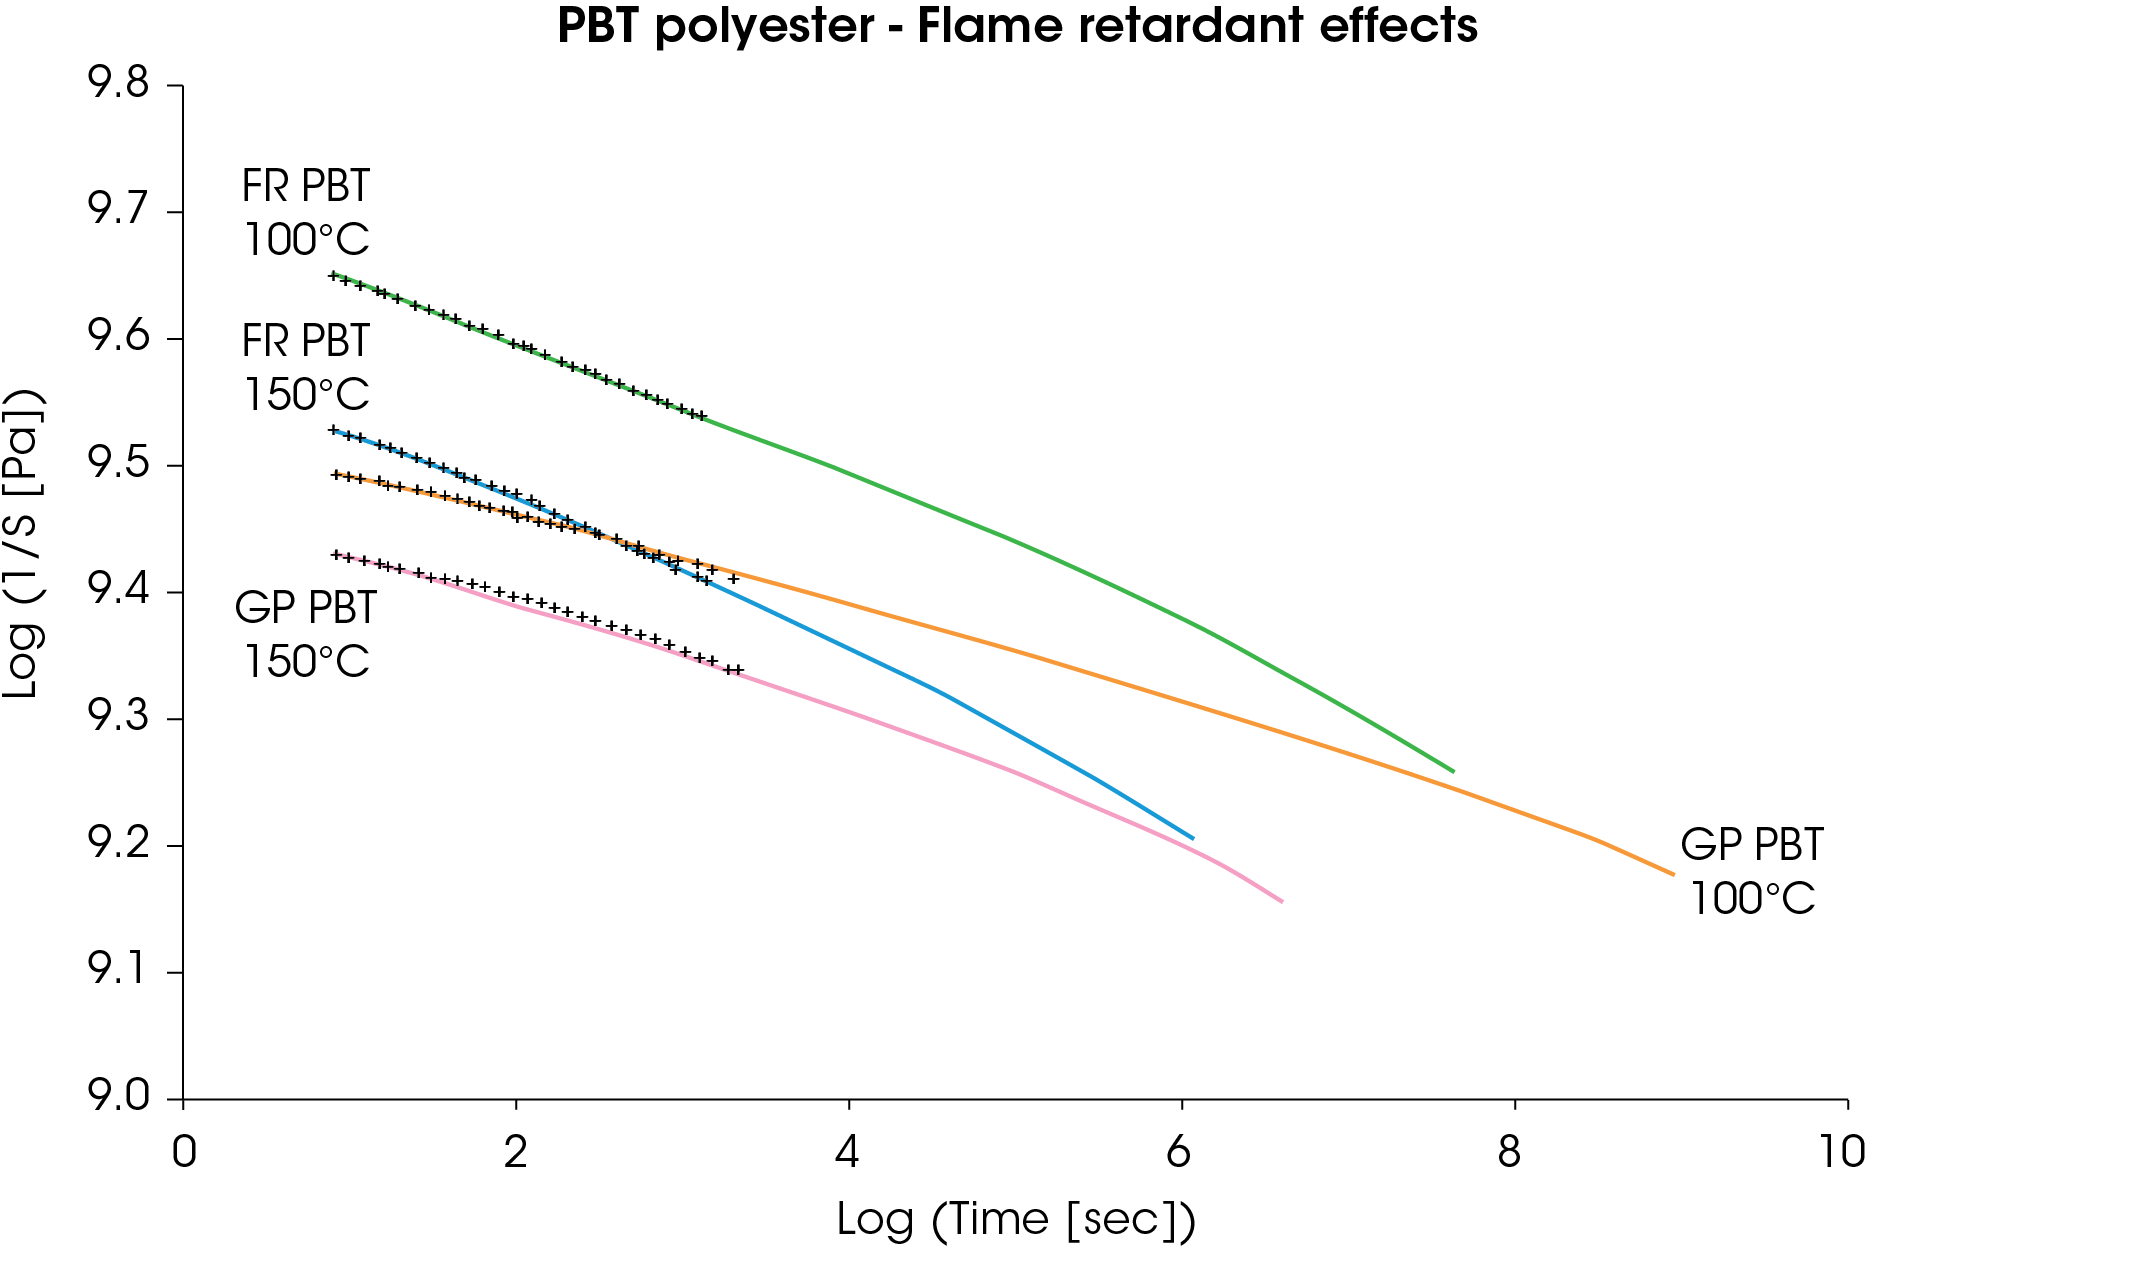
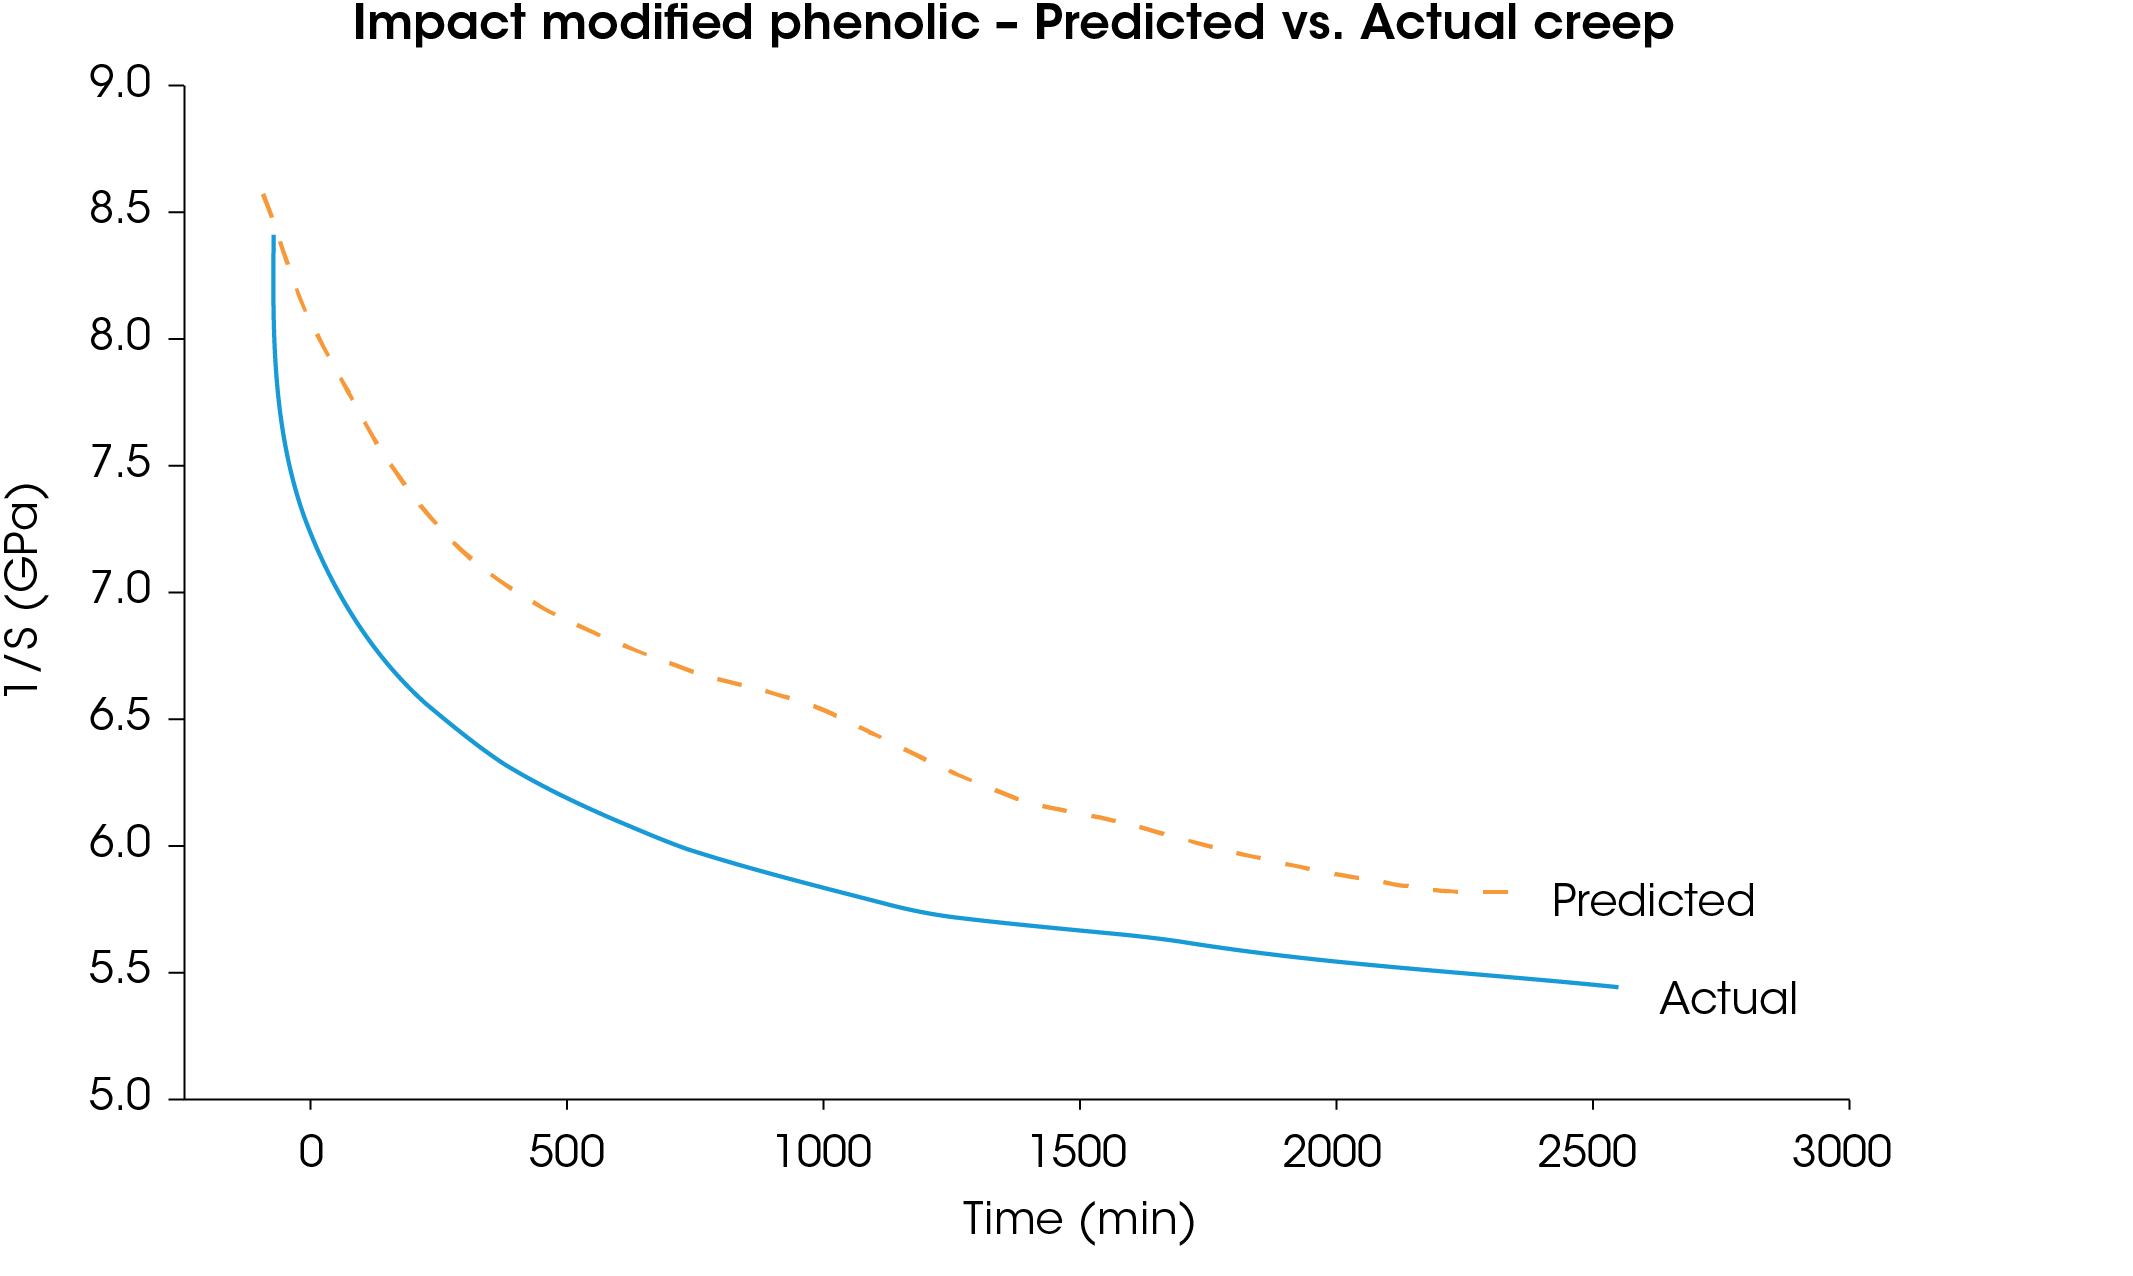
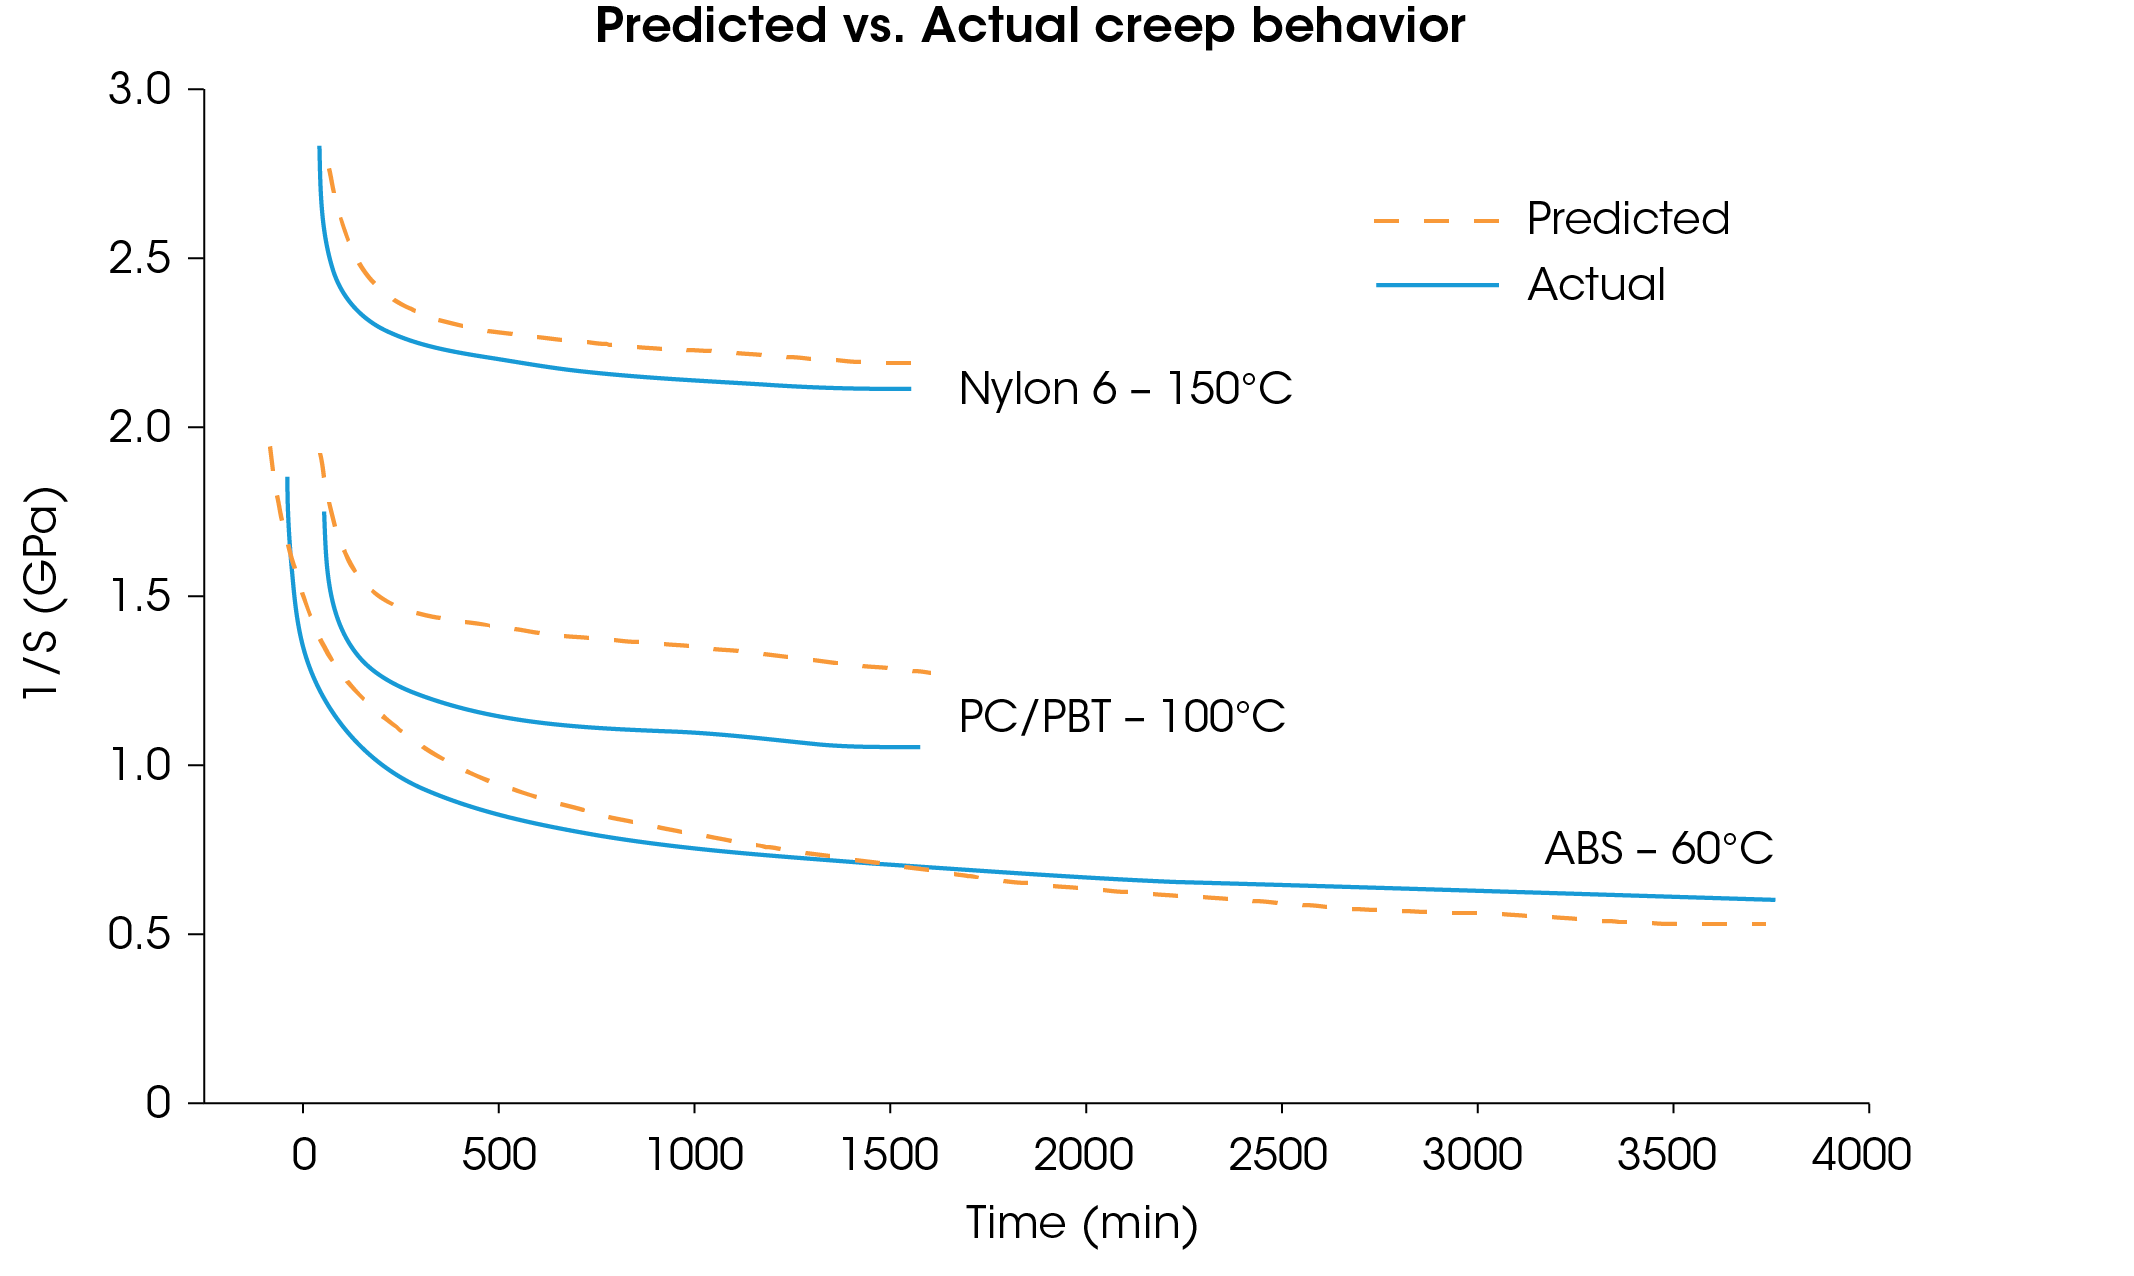
Figure 15 shows the same comparisons for a filled nylon 6 at 150 °C, a filled PBT/PC blend at 100 °C, and an unfilled ABS at 60 °C for actual test periods of 24–63 hours. In all cases the predicted behavior of the material agrees to within 10–15% of the actual response. More importantly, the slopes of the predicted and actual curves are in excellent agreement in the region of the relative stability that occurs after the initial rapid decline. This gives strong indications that the predictive curves will be useful to times beyond those actually tested.
Early experience in solving creep related field problems with this technique have been encouraging. Figure 16 shows predictive curves for three thermoplastics (nylon 6, PBT, PBT/PC alloy) that are candidates for an under the hood automotive application involving a constant load. The plastic components must maintain a spring type compression on a fluid reservoir. The reference temperature for these master curves is 100 °C.
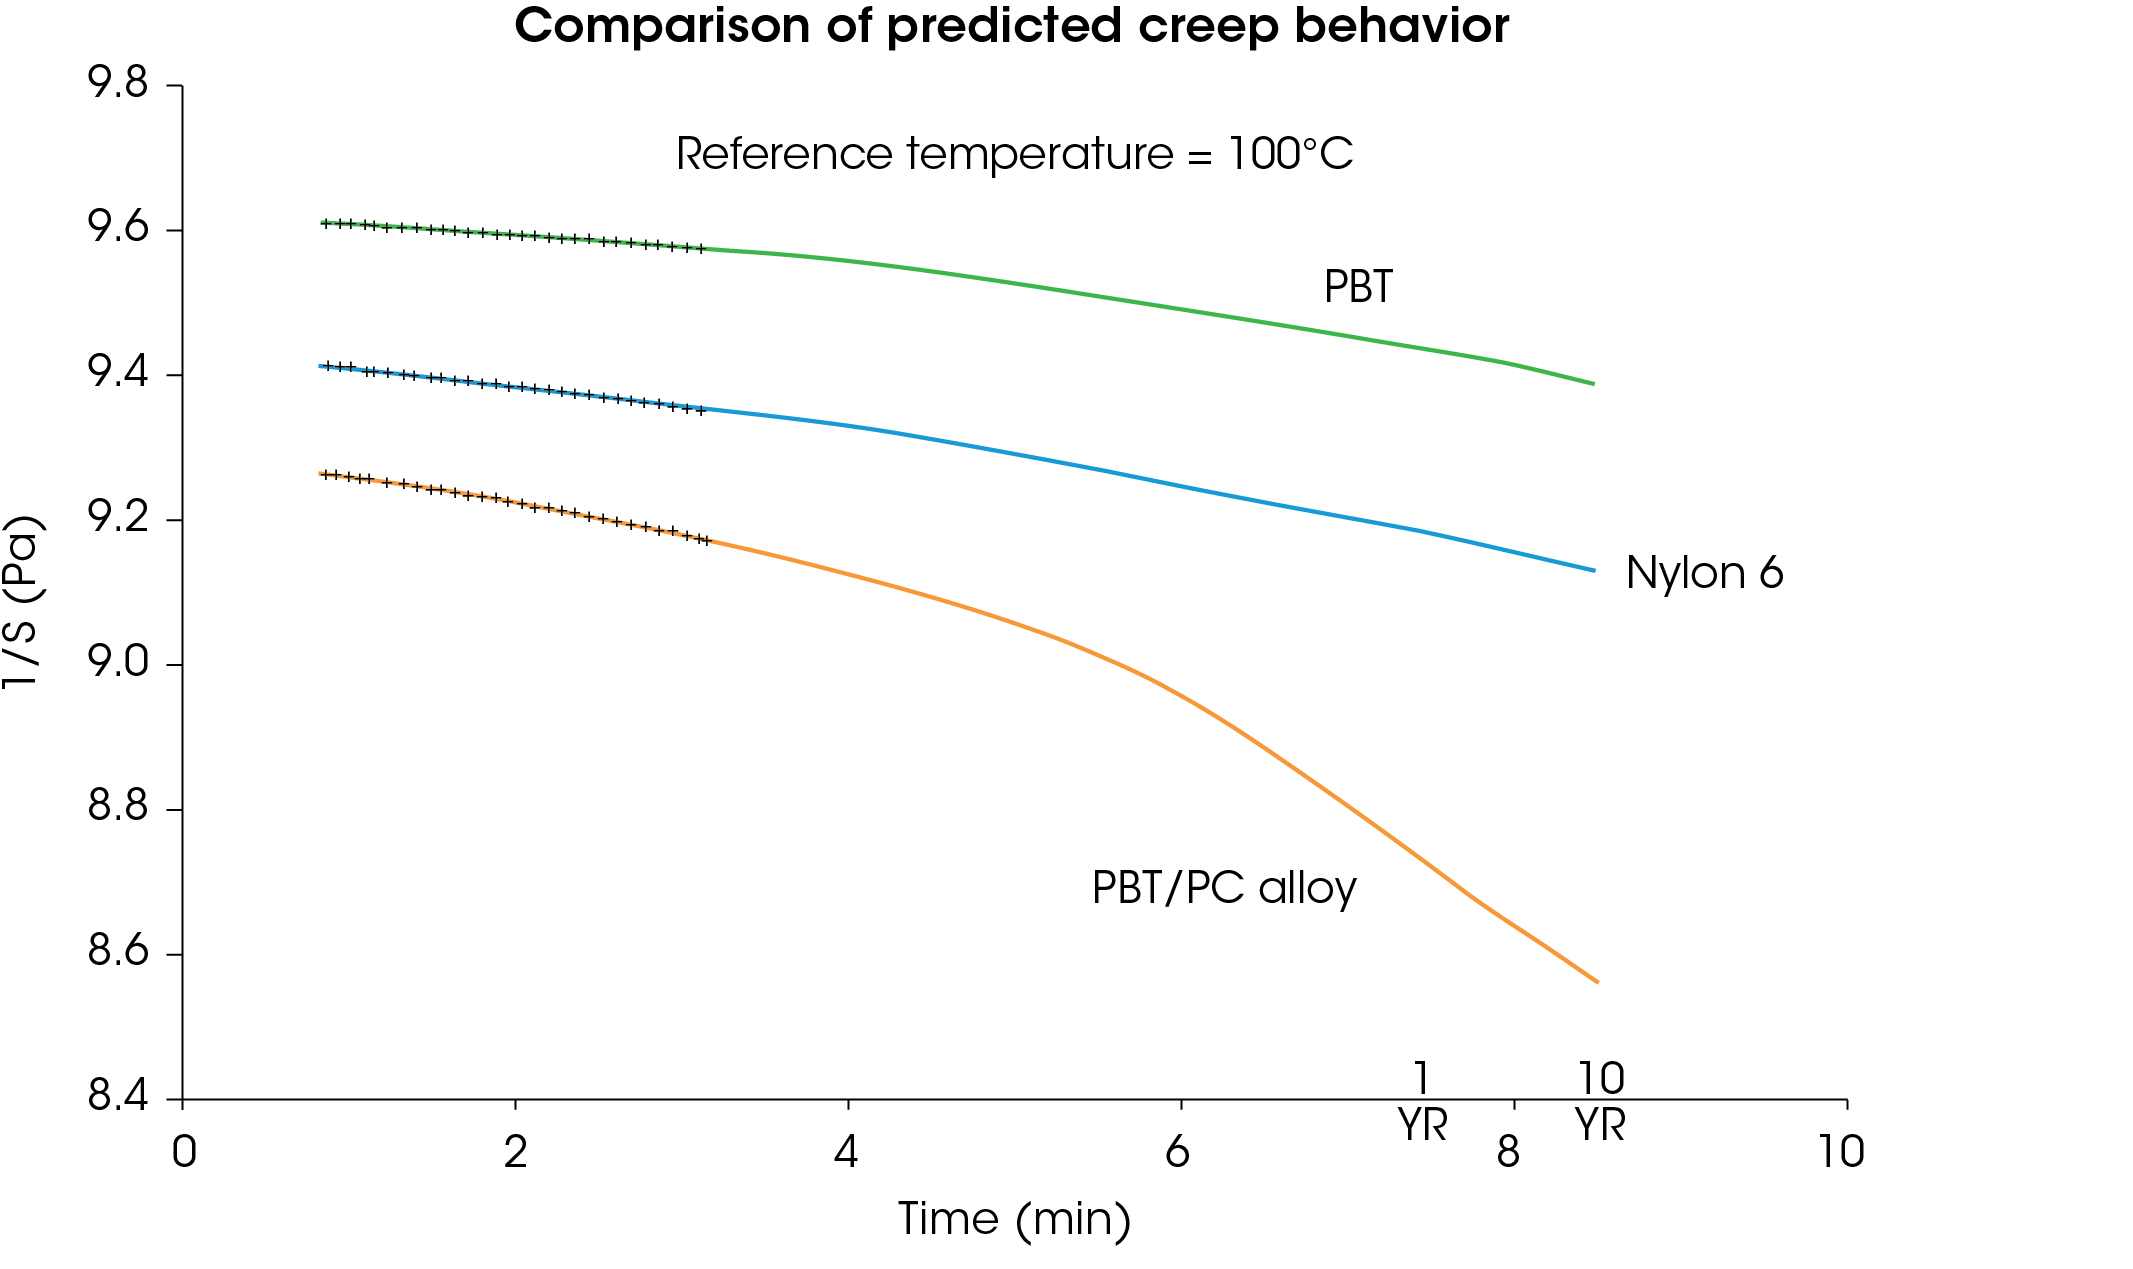
The PC/PBT alloy was the original material selected but was experiencing isolated creep failures. It did, however, offer an attractive combination of color stability and toughness. The two replacement candidates were a 40% glass/mineral reinforced nylon 6 and a 33% glass reinforced PBT polyester that employed an improved coupling agent technology for enhanced impact resistance and stiffness. The nylon 6 offered improved creep resistance at a cost savings but lacked the oxidative stability needed to maintain color and adequate ductility. The PBT added cost but answered the shortcomings of the nylon and offered even greater creep resistance. Ultimately a lower cost PET with similar reinforcement level was substituted without a sacrifice in critical performance criteria and a master curve was generated to confirm fitness for use. The new material is performing without problems and has led to a tenfold increase in market share.
Conclusion
Dynamic mechanical analysis offers an enhanced means of evaluating the performance of polymeric systems at elevated temperatures. It provides a complete profile of modulus vs. temperature as well as a measurement of mechanical damping. Operating in the creep mode and coupled with the careful use of time-temperature superpositioning, projections can be made regarding the long term time dependent behavior under constant load. This provides a much more realistic evaluation of the short and long term capabilities of a resin system than the values for DTUL offered in the data sheets.
References
- R. H. Barker, “Elevated Temperature Performance Under Stress Load” SPI Phenolic Molding Division Technical Conference Proceedings (1987).
- T. Morrison & P. Waitkus, “Studies of the Post Bake Process of Phenolic Resins” SPI Phenolic Molding Division Technical Conference Proceedings (1987).
- T. Murayama, Dynamic Mechanical Analysis of Polymeric Materials, Elsevier, New York, 1978.
- J. D. Ferry, Viscoelastic Properties of Polymers, 3rd ed., Wiley, New York, 1980.
- W. J. Sichina, P. S. Gill, 47th SPE ANTEC, 35, 1111 (1989).
Acknowledgement
For more information or to request a product quote, please visit www.tainstruments.com to locate your local sales office information.
This paper was written by Michael P. Sepe. Thank you to Mary Hesprich for her extensive assistance with sample preparation and testing.
TA Instruments is a registered trademarks of Waters Technologies Corporation.
Click here to download the printable version of this application note.

