Keywords: fatigue testing, mechanical testing, durability, Apex 1, ElectroForce
EF039
Abstract
Mechanical properties are generally considered a critical specification for most products made from polymers. Emphasis is placed on modulus, ultimate tensile strength (UTS), and elongation while often overlooking fatigue properties. Most of the time, fatigue properties of thermoplastic resins are not on technical data sheets and are unknown. Understanding fatigue behavior of materials is critical to designing suitable materials and products for a variety of applications. By applying cyclic loading to replicate the end use operating conditions, product developers can predict product life for a specific design while overcoming cost and production limitations. This technical note shows how resin selections play a significant role in fatigue life. By determining the product’s ideal cycle life with the corresponding stress or strain level, the ideal resin can be selected to fulfill customers’ fatigue requirements. This evaluation compares the mechanical properties of three different grades of ABS resins as well as base SAN resin. We demonstrate that there are significant performance differences among the different grades, showing how in-depth mechanical testing will help you select the best resin for your product.
Introduction
Companies dedicate an enormous amount of resources to design complex products with accuracy, suitable mechanical properties, and predictable product life. Typical design processes are six phases focusing on technical feasibility, building the scope, research and development, refinement, final prototype and approval [1,2]. During these processes, many critical factors are considered but quality and productivity are the most important [3]. Engineers are conditioned to fulfill the customer-specific mechanical properties and aesthetics while decreasing production time using mold flow and statistical software. As a result of this large endeavor, fatigue tests are often deprioritized, resulting in significant risk to the success of the organization. Product durability and life evaluation are often deferred until later in the design cycle, commonly evaluated by general use of the product. This approach delays the discovery of problems until late in the product development cycle after a lot of time and money has been invested in design and tooling. Additionally, in-use testing can be very inconsistent and fails to evaluate the range of conditions that the product will truly experience in the field, such as temperature changes and different use cases.
Fatigue tests are constructed to introduce essential customer demands for durability and reliability. These tests are designed to reduce product failures by testing prototypes using cyclic loads and/or displacement. While this can be an effective way prevent product failure by a customer, it may not be the ideal methodology of failures caused by part design, resin selection, and environmental conditions. Highly detailed organizations introduce fatigue testing much earlier in the design process. Ideally, fatigue testing should be a critical factor to determine designs, processing conditions, and resin selection.
In our previous technical note, we discussed the loss in fatigue life at knit lines sections of the part [4]. Knit lines in low stress areas could experience too much stress resulting in product failures. Mechanical properties specifications are typically integrated early in the design process without any specific fatigue metrics. This note will demonstrate the importance of fatigue testing as a screening tool for a thermoplastic resin using mechanical properties. By integrating this methodology early in the process, organizations should be able to lower risks, increase profit, and reduce design cycles.
Experimental
Acrylonitrile butadiene styrene (ABS) and Styrene acrylonitrile (SAN) Type 1 dog bones were prepared by injection molding according to dimensions defined in ASTM D638-22. All samples were prepared using a single gate. Single gate dog bones have highly consistent and favorable orientation and entanglement of the polymer chains along the axis of stress. All SAN and ABS dog bones were obtained from PolySource LLC of Overland Park, KS. ABS dog bones were injection molded with a barrel temperature ranging from 405 to 432 °F. Nozzle and mold temperatures were 453 and 145 °F, respectively. SAN dog bones were injection molding with a barrel temperature ranging from 387 to 413 °F. Nozzle and mold temperatures were 414 and 130 °F, respectively. Injection molding conditions influence overall mechanical performance by altering crystallinity, molecular alignment, and internal stresses. All dog bones were injection molded according to the manufacturer’s recommendations.
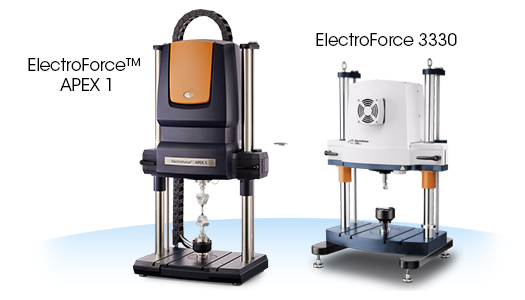
Tensile tests were performed according to ASTM D638-22 with a rate of 5 mm/min (0.083 mm/sec). Three tensile tests were completed for each sample. All tensile test data is reported in averages. To obtain tensile and fatigue data, TA Instruments™ ElectroForce™ 3330 and ElectroForce APEX 1 Instruments were used and are shown in Figure 1. All fatigue tests were completed using 5 Hz in tension-tension and cycle between 1 and 80 % of the maximum load (R=0.1). Compressed air was blown onto the sample to prevent self-heating and influence results. The sample temperatures were monitored throughout all fatigue tests.

Results and Discussion
Tensile testing data for Resins 1 through 4 are shown in Table 1. Resins 1 through 3 are commercially available grades of ABS. Resin 4 is a commercially available grade of SAN, see Table 1. All mechanical values correspond to values obtained from the manufacturer. With all ABS resins, average UTS was from 38.9 to 42.9 MPa. Resin 3 had the lowest elongation at break and corresponding stress at break for ABS resins. As one might expect, the modulus for Resin 3 was slightly higher than compared to Resin 1 and 2.
Resin 4 has significantly different mechanical properties when compared to Resins 1 through 3, Table 1. The average UTS for Resin 4 was 71.9 MPa compared to highest average UTS value for ABS sample, Resin 3, of 42.9 MPa. This indicates significantly higher tensile strength for Resin 4. Increase stiffness is also observed with Resin 4 with an average Modulus of 1162 MPa. It also has lower average elongation compared to Resins 1 through 3 with an average of 6.7 %. All ABS materials exhibit similar properties for average UTS, Elongation at Break, Stress at Break, and Modulus. If an elongation at break above of 15 % is required, only Resin 1 through 3 fit the requirement.
Table 1. Tensile testing results
| Sample Grade | Thermoplastic | Average UTS (MPa) | Average elongation at break (%) | Average stress at break (MPa) | Average modulus(MPa) |
|---|---|---|---|---|---|
| Resin 1 | ABS | 42.2 ± 0.1 | 21.1 ± 2.0 | 34.2 ± 1.0 | 872 ± 0.1 |
| Resin 2 | ABS | 38.9 ± 0.1 | 20.2 ± 2.0 | 30.4 ± 0.7 | 770 ± 63.9 |
| Resin 3 | ABS | 42.9 ± 0.0 | 16.29 ± 0.6 | 29.7 ± 1.5 | 921 ± 3.6 |
| Resin 4 | SAN | 71.9 ± 0.4 | 6.7 ± 0.4 | 71.9 ± 0.1 | 1162 ± 21.1 |
Tensile curves, or stress strain curves, provide important mechanical characteristics of materials under a constant stress or strain rate. As the load on the material increases due to the increase in strain, stress is calculated as a direct function of the cross sectional area [5].The corresponding strain is calculated as a function of increase in gauge length. The strength of the material is one of the most critical concerns to determine the proper resin. Other mechanical properties are considered as well. For example, plastic deformation at a given strain is an indication of when a material will fail. Elongation at Break expresses how much deformation a material can resist before breaking.
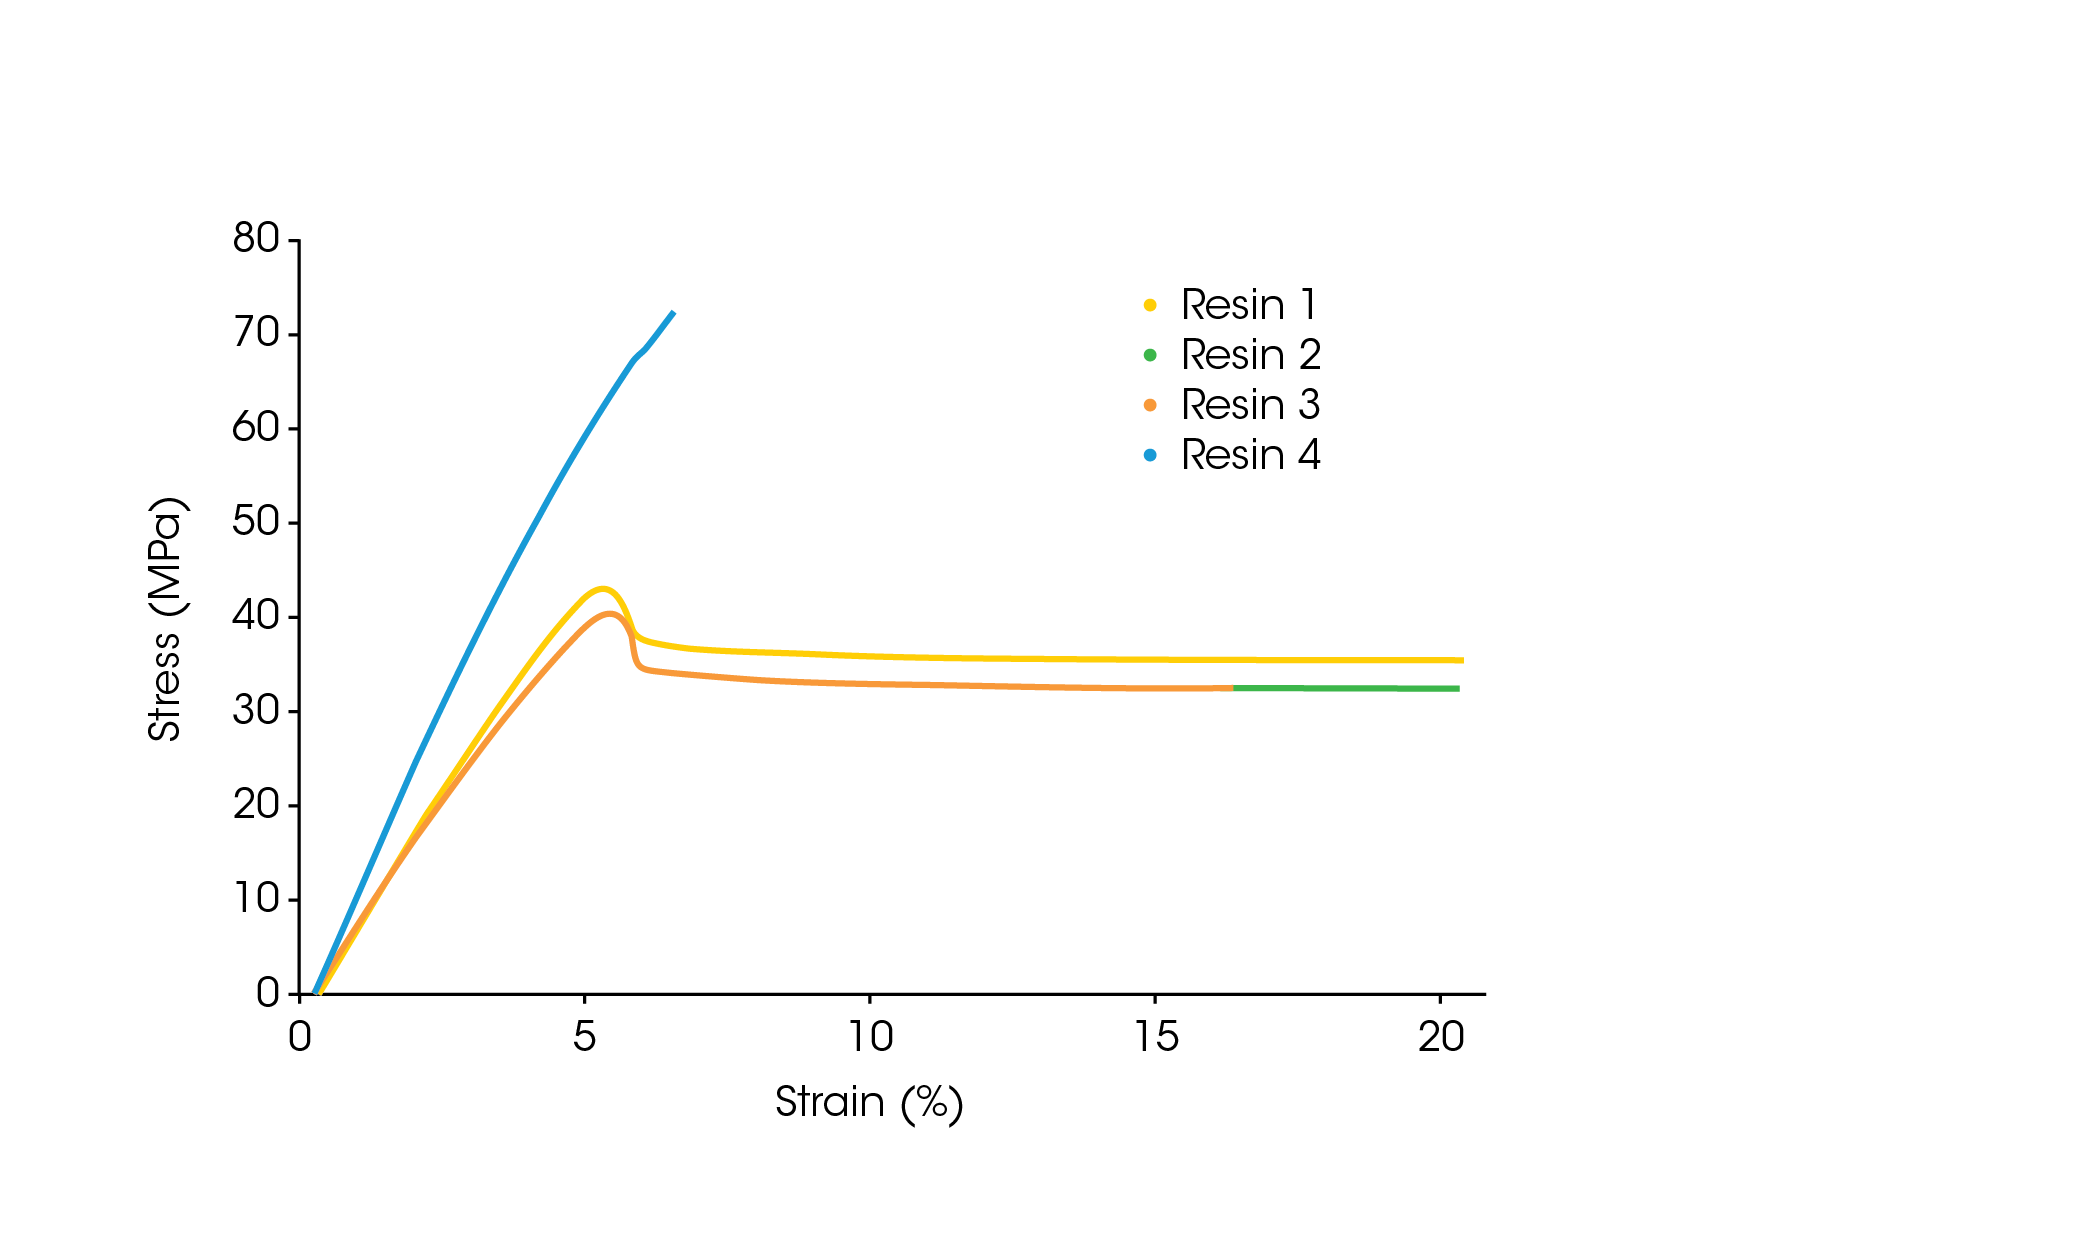
Figure 2 displays a stress strain curve of a sample from Resin 1 and 4. The increased stiffness, UTS, and lower elongation from Resin 4 can clearly be observed in the stress strain curve. If a high tensile strength is required for the product, then Resin 4 would be the only material presented that qualifies. Resin 4, seen in Figure 2 and Table 1, also shows a UTS that coincides with the stress at break. This likely indicator that Resin 4, SAN resin, has considerably lower ductile behavior and poor impact performance. Resin 1 has a much higher elongation when compared to Resin 4. This higher elongation could lead to a product with a lower chance of failure after passing through deformation region around 6 % strain.
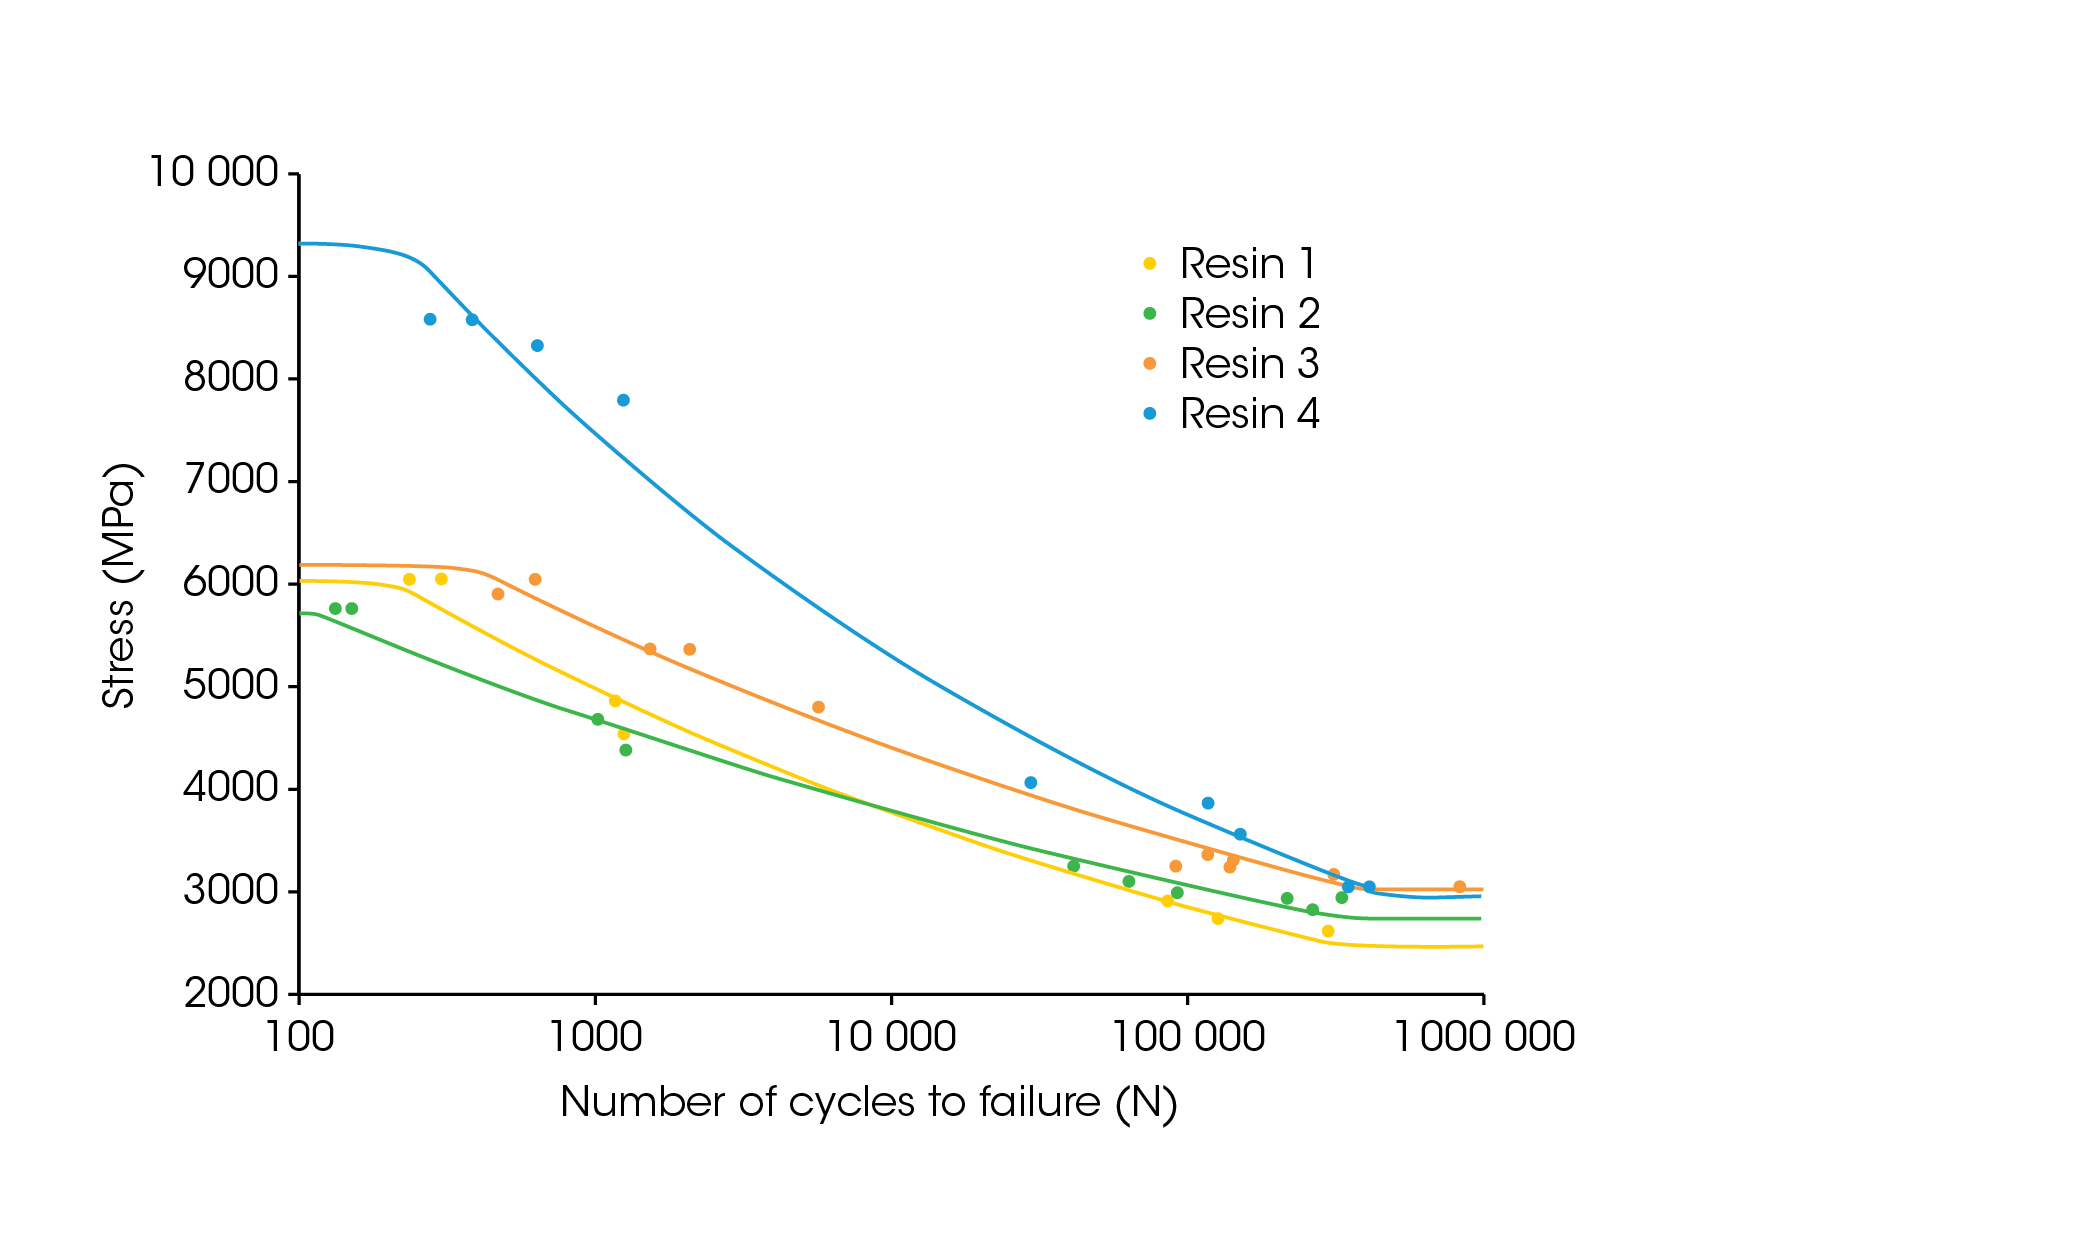
Stress strain curves are an initial indication of how a material will perform to a one-time loading situation. It is insufficient at determining how a material will perform in the field under cyclic loads. Fatigue testing are designed to determine failure at specific cyclic loads and/or strains. More importantly, fatigue tests are designed to replicate conditions a product will experience. Figure 3 shows the S-N Curve, stress (S) versus cycles (N) to failure, for Resins 1 through 4. Resin 4, produced using SAN, is the ideal material at lower cycle counts corresponding to high stress. As the stress lowers and the cycle count increases, Resin 4 becomes slightly inferior. Resin 1 and 2 trade positions. Resin 3 displays a clear fatigue life advantage. This can be observed at high cycle counts.
The performance of these materials at various fatigue stress/cycle conditions is clearly not predictable when just looking at the tensile data. This data in conjunction with creep life and impact properties provides a more comprehensive picture of the material’s mechanical properties to meet all the needs of the end product.


Conclusions
Thermoplastic resins manufacturers typically provide mechanical data that can be useful but incomplete in the selection process for a variety of applications. Often, fatigue testing is overlooked as a key factor for resin selection. The result of evaluating fatigue properties can result in decreased design cycles, company cost, and product failures. Resin 1 had the highest ultimate tensile strength and preformed the best at low cycle count/high stress. Resin 2 has the second highest performance at low cycle count. As the stress decreases and the cycle count increases, Resin 3 becomes the clear favorite. These observations cannot be reasonably predicted from tensile data. The fatigue data provides a great tool to better select materials that meet all the needs and design parts which have stresses within the allowable values to meet the cycle life. Processing conditions, mold design, and product artifacts can affect the fatigue life. The addition of fatigue testing in all stages of product development should be the top the priority, assuring customer satisfaction by reducing product failures.
References
- International Conference on Engineering and Product Design Education 8-9 September 2022, London South Bank University, London, UK.
- Lewin T, “How to Design Cars Like a Pro.” 2010 (Motorbooks, Minneapolis MN).
- Gurjeet S, Verma A, “A Brief Review on injection moulding manufacturing process”, 2017 Materials Today: Proceedings, Volume 4, Issue 2, Part A, pp. 1423-1433
- Vail J, Simon A, “Evaluation of loss of polymer strength and durablilty due to fatigue loading and manufacturing artifacts” 2023 (TA Instruments,
- Davis J, “Tensile testing”, 2004 (ASM International, Material Park OH), pp. 1-7.
Acknowledgments
This work was done in collaboration with The Madison Group Polymer Processing Research Corporation (The Madison Group). ABS and SAN samples were donated by Cliff Watkins, Ph.D. from PolySource LLC of Overland Park, KS.
This paper was written by Dakarai K. Brown, Ph.D. at TA Instruments | Waters Corporation.
TA Instruments and ElectroForce are trademarks of Waters Technologies Corporation.
Click here to download the printable version of this application note.

