Keywords: modulated DSC, MDSC, battery separator, lithium-ion battery, polypropylene, thermal analysis, DSC
TA465
Abstract
Modulated DSC (MDSC) was performed on a polypropylene (PP) battery separator to gain additional insights into the effects of stretching during processing of the film. The MDSC experiment reveals structures with a higher melting point of α phase PP (~163 °C) resulting from the stretching process. These melting transitions are found mainly in the non-reversing heat flow signal and do not respond to the temperature variation in the MDSC experiment despite using a relatively slow heating rate of 1 °C / min. The high melting structures also appear in the second heat in the non-reversing signal along with α and β spherulites found in the reversing heat flow. There is a significant reduction in the fraction of non-reversing heat relative to the total heat of fusion in the second heat which may indicate that some of the structure induced is destroyed during the isothermal hold above the equilibrium melting temperature. A method to estimate the endothermic fraction of this difference in heat of fusion is also proposed.
Introduction
In a previous application note [1], basic thermal analysis techniques were used to characterize a battery separator made from uniaxially stretched polypropylene (PP) film. In this note, more detailed information is obtained by using MDSC to separate heating rate dependent events, referred to as reversing, from time and temperature dependent events, referred to as non-reversing or kinetic.
The MDSC experiment superimposes a sinusoidal temperature heating rate on a linear heating rate or static heating (quasi-isothermal). Fourier transformation of the oscillatory temperature forcing function and resultant heat flow rate response provides the deconvolution of these signals into reversing and non-reversing components [2]. Some examples of transitions observed in the MDSC experiment and their corresponding reversing and non-reversing heat flow signals are shown in Table 1.
Table 1. Partial summary of transitions and associated modulated heat flow signals
| Total Heat Flow |
Reversing Heat Flow | Non-Reversing Heat Flow |
| All transitions | Heat Capacity | Enthalpic Recovery |
| Glass Transition | Evaporation | |
| Melting | Crystallization | |
| Curing | ||
| Denaturation | ||
| Decomposition | ||
| Some Melting | ||
| Chemical Reactions |
Experimental
Testing was done on commercially obtained Celgard 2400® (PP), using the parameters listed in Table 2.
Table 2. MDSC experimental conditions
| Instrument | Discovery® DSC 2500 |
| Sample Mass | 4 mg nominal |
| Purge | N2 at 50 mL /min |
| Pan | Tzero® aluminum |
| Period | 60 s |
| Amplitude | +/- 0.158 °C (heat only) |
| Heating Rate | 1 °C / min |
| Temperature Range | -50 to 230 °C |
Sample was ramped at 1°C / min to 230 °C and held isothermally for 10 minutes to destroy retained thermal history. After the isothermal hold, the sample was quickly cooled to back to -50 °C and ramped again to 230 °C. The upper temperature limit is chosen to be significantly above the equilibrium melting temperature to destroy retained thermal history [3]. This may not be possible with every semi-crystalline polymer, so determining the decomposition temperature by TGA is important.
Results and Discussion
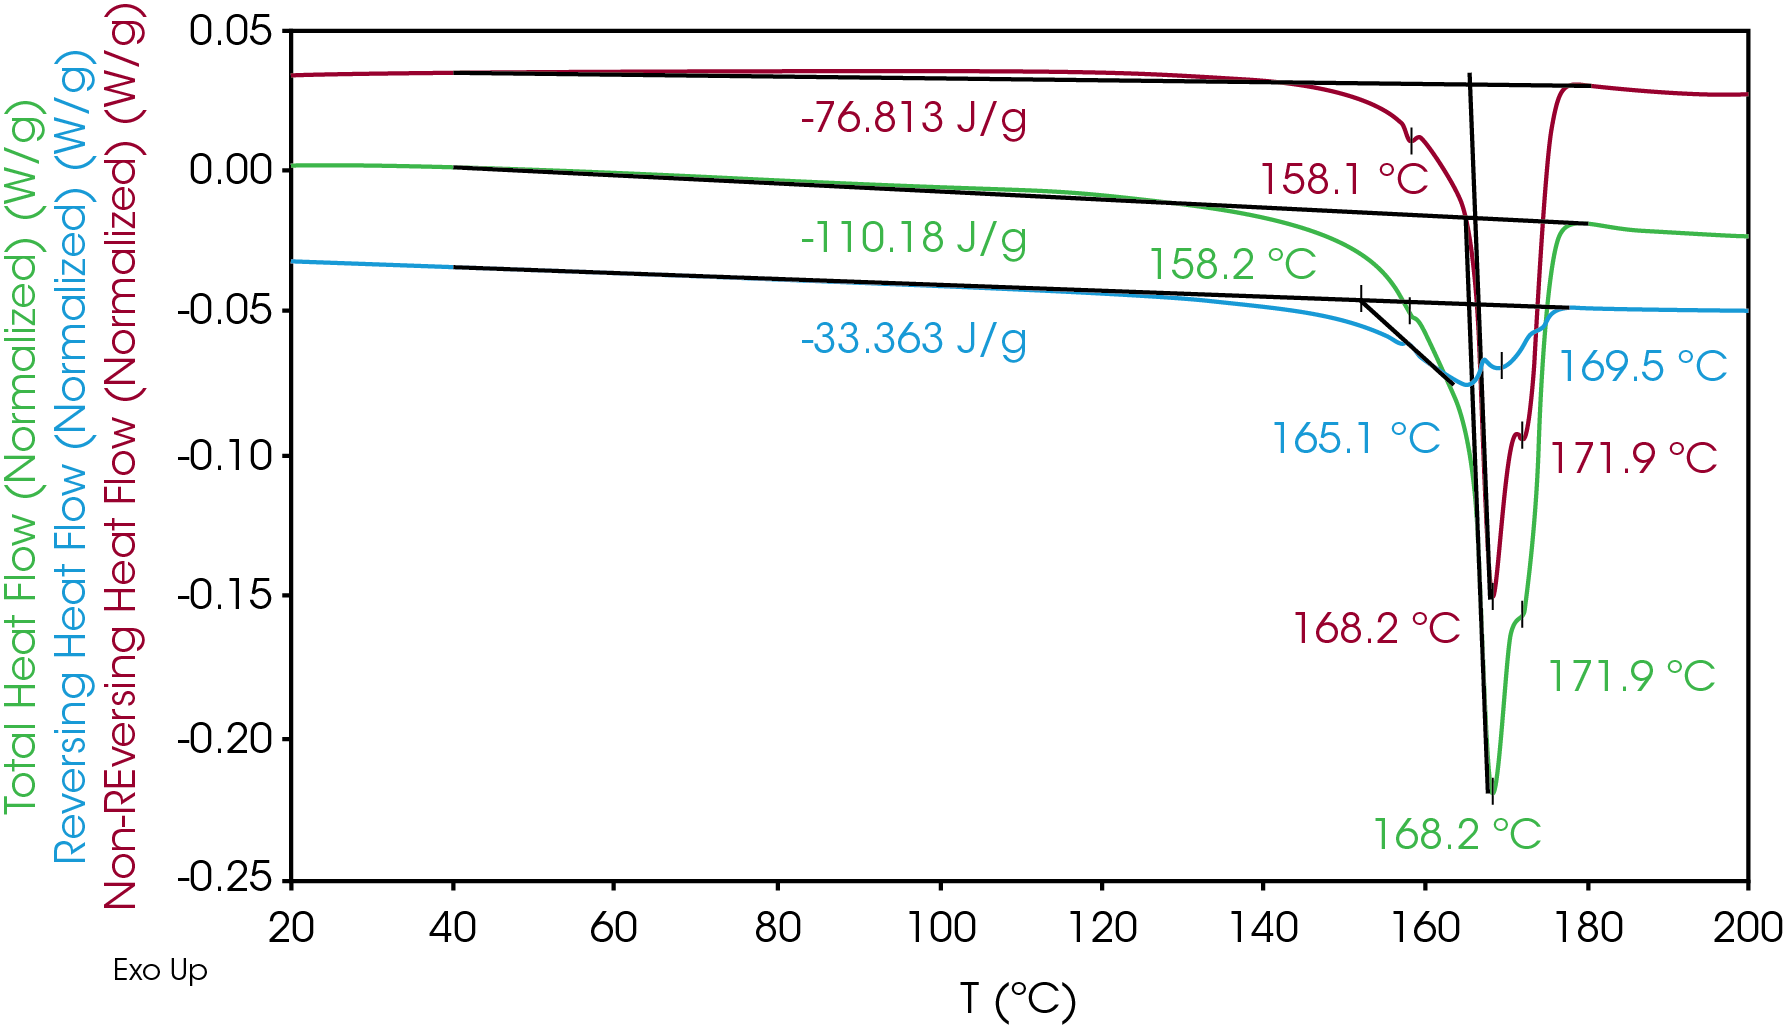
The results of the neat separator film are shown in Figure 1 and summarized in Table 3. Four melting transitions were observed at 158, 165, 168, and 172 °C. Most of the heat flow is in the non-reversing signal, including the melting transitions above the melting point of α PP at 163 °C. The higher melting fractions are due to the various structures such as helices, fibril, or coils formed during the drawing process [4]. The drawing process results in the formation of crystal structures that do not follow the temperature modulation in the MDSC experiment, despite utilizing a slow heating rate of 1 °C / min. The total and non-reversing heat flow also show slight exothermic heat flow from 40 to 140 °C which may be due to relaxation of the oriented film and / or crystal perfection.
Table 3. MDSC transitions (1st heat)
| ΔH (J/g) | TM °C | TM °C | TM °C | |
| Total Heat Flow | -110.18 | 158.2 | 168.2 | 171.9 |
| Reversing | -33.36 | – | 165.1 | 169.5 |
| Non-Reversing | -76.81 | 158.1 | 168.2 | 171.9 |
MDSC 2nd Heat – Results of the 2nd heat modulated transitions are shown in Figure 2 and Table 4. The total heat flow signal also shows some exothermic heat flow from approximately 40 °C to 120 °C that is not observed at a heating rate of 10 °C / min [1]. Cold crystallization occurs at 146.7 °C followed by two melting transitions at 162.3 and 169.8 °C. The higher melting transitions were also not observed at a heating rate of 10 °C / min. The heat of fusion is in the range observed in mostly isotactic polypropylene.
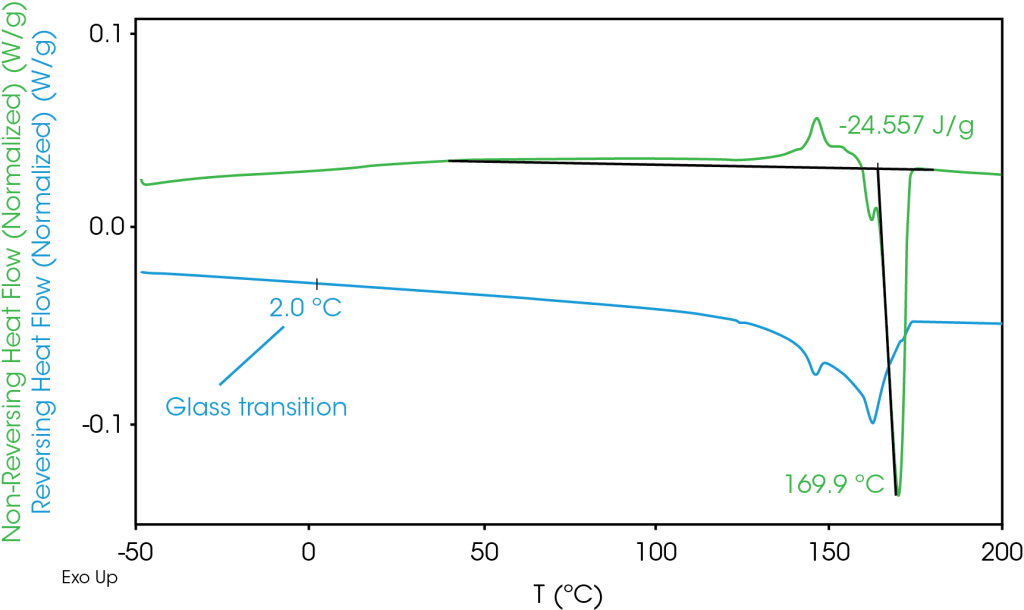
The reversing heat flow shows melting transitions at 146 °C (β phase), and at 162 °C (α phase). The β phase melt transition is not apparent in the total heat flow as it obscured by cold crystallization and crystal perfection.
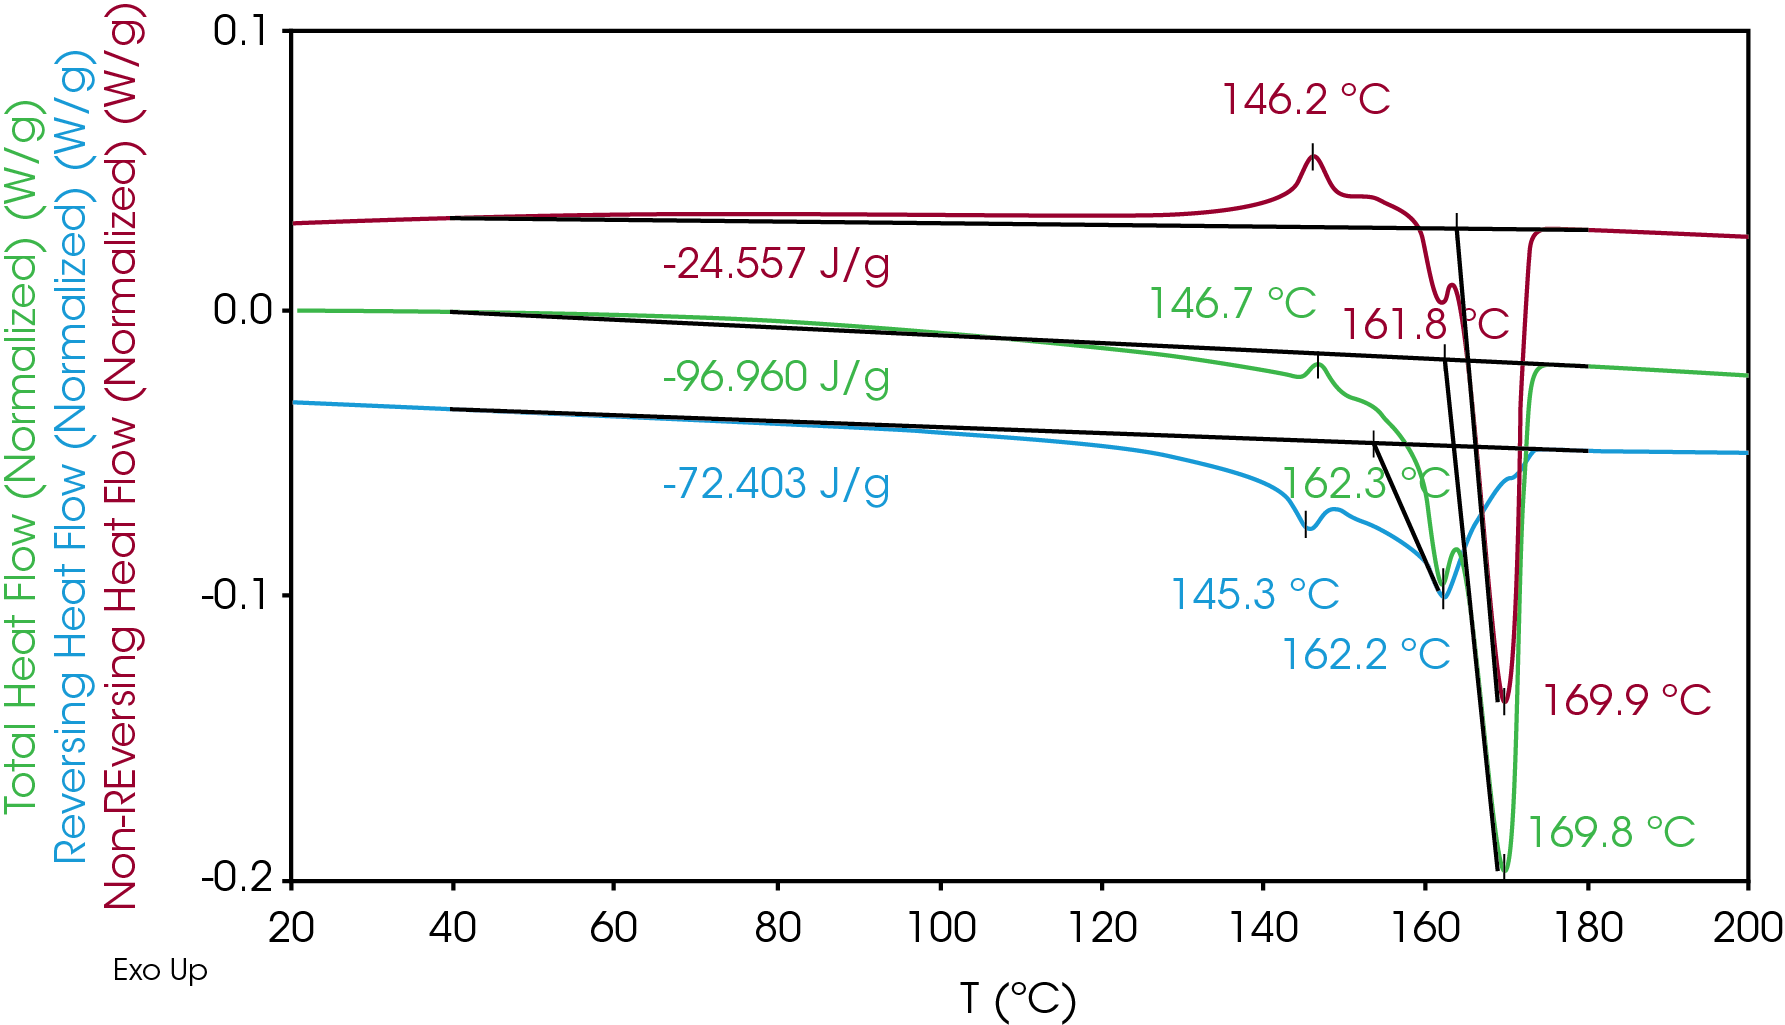
The non-reversing heat flow shows cold crystallization at 146.2 °C and crystal perfection before the melting transitions at 161.8 °C and 169.9 °C. Sadeghi et al [4] described in detail the formation of higher melting structures due to the drawing process. These structures are not destroyed during the isothermal hold after the melt. At a heating rate of 10 °C, the β and α phase melting temperatures at 149 and 164 °C are observed in the second heat of the separator, no cold crystallization is apparent and no higher melting transitions are observed (Figure 3). In the modulated experiment at the slower heating rate of 1 °C / min, the higher melting structures form during the crystal perfection and cold crystallization processes. These processes are apparently suppressed at a heating rate of 10 °C / min.
Table 4. MDSC Transitions for 2nd Heat
| ΔH (J/g) | TM °C | TM °C | TM °C | TC °C (Cold) | |
| Total Heat Flow | -96.96 | – | 162.3 | 169.8 | 146.7 |
| Reversing | -72.40 | 145.3 | 162.2 | – | – |
| Non-Reversing | -24.56 | – | 161.8 | 169.9 | 146.2 |
The relative fractions of reversing and non-reversing heat flow in the 1st and 2nd heats are compared in Table 5. The reversing heat flow contribution increases by approximately 44% in the second heat. The overall heat of fusion in the total heat flow is reduced by 13.22 J/g in the second heat relative to the first heat.
Table 5. Relative contributions of reversing and non-reversing heat flow in PP battery separator
| Total Heat Flow | 1st Heat | 2nd Heat |
| Reversing | 30.3% | 74.7% |
| Non-Reversing | 69.7% | 25.3% |
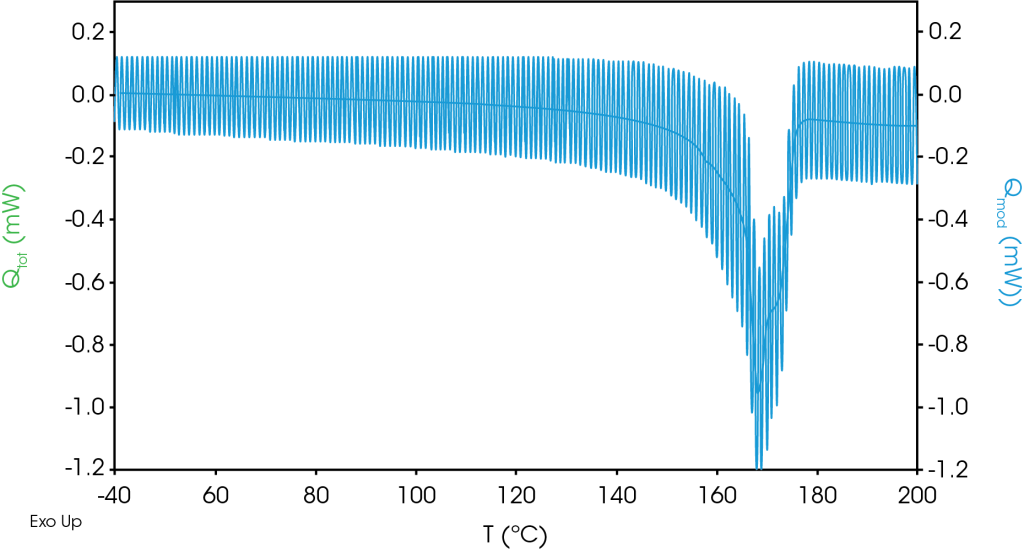
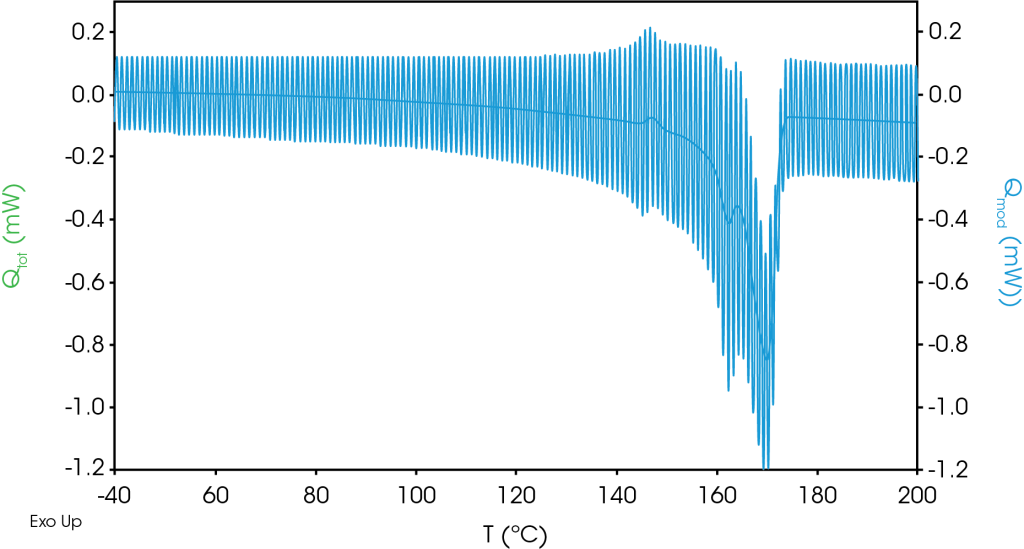
The modulated raw data for the first heat is shown in Figure 4, and for the second heat in Figure 5. No discontinuities were observed in the modulated heat flow signal. (Figure 4 and Figure 5).
Estimation of Contribution of Orientation Effects due to the Drawing Process to ΔH in the First Heat.
The reduction in relative fraction of the non-reversing heat flow in the second heat indicates that some induced structure and orientation effects due to the drawing of the film are destroyed during the melting and subsequent isothermal hold at 230 °C. It is also noteworthy that α (162 °C) and β (145 °C) spherulites observed in the second heat are not found in the first heat. An explanation of the calculation and nature of the modulated signals is described by Len Thomas in one of a series of papers on MDSC [5]. It is assumed that non-reversing heat flow due to crystal structure induced during the stretching process that does not follow the modulated heating profile will remain constant and the net change in the non-reversing endothermic heat flow is due to provisional orientation effects.
![TA465_Fig.3 Figure 3. DSC of battery separator 10 °C / min [1]](https://www.tainstruments.com/wp-content/uploads/TA465_Fig.3.png)
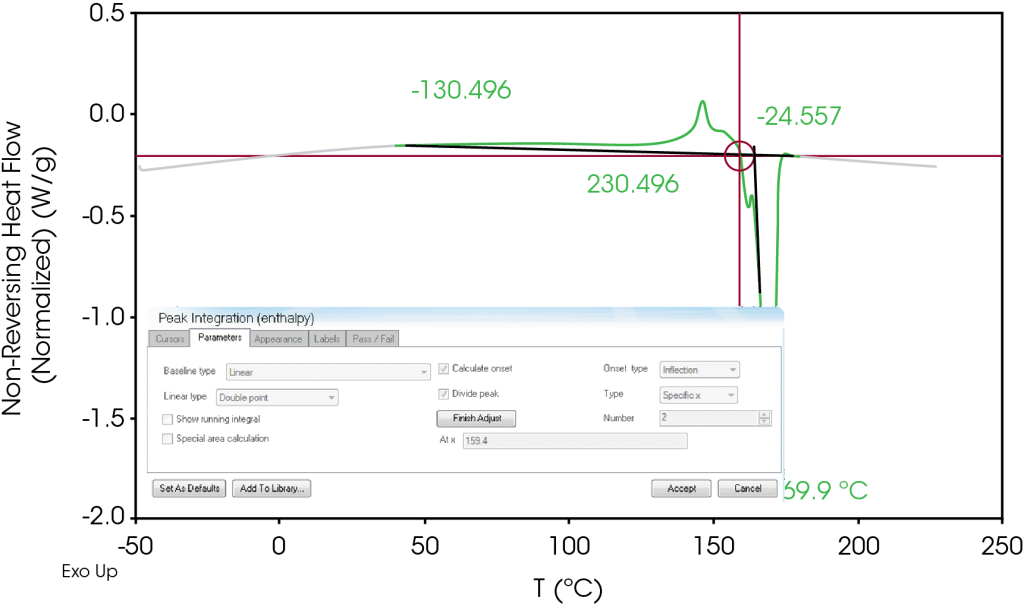
To estimate these orientation effects, the non-reversing heat flow signal is separated into endothermic and exothermic regions by integrating from a temperature forward of the glass transition (found in the reversing heat flow signal) to a temperature just past the melting endotherm. In this case, our limits of integration were 40 – 180 °C. Using the TRIOS® software, we use ‘adjust drops’ in the peak integration tool and choose a point where an inflection occurs just before the main endothermic transitions. This is demonstrated in Figure 6.
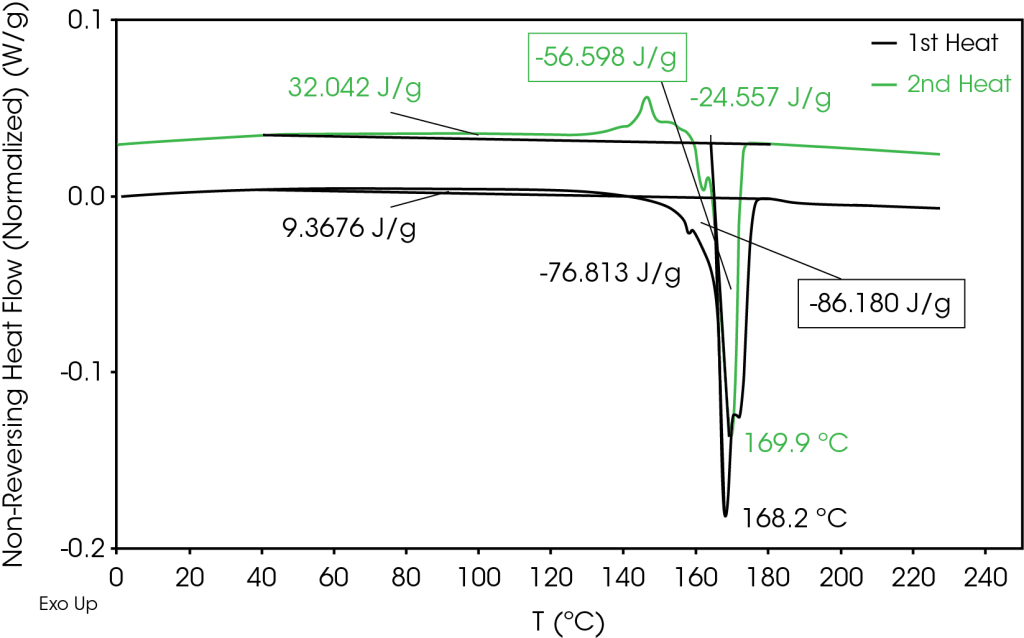
This is analogous to choosing integration limits on a standard DSC heat flow signal that are on the heat capacity baseline and is demonstrated in Figure 7. It is important to observe the sign convention as there will often be endothermic and exothermic heat flow in the non-reversing signal. Using this method to choose the integration limits will subtract the exothermic heat flow from the endothermic heat flow in both the 1st and 2nd heats. Note that negative values are assigned to endothermic heat flow and positive to exothermic. The sign convention can be chosen in the software preferences. Subtracting the endothermic 2nd heat from the 1st heat yields the heat flow due to orientation which is -29.58 J/g (Table 6). A comparison of the integrated non-reversing heat flow signals is shown in Figure 8.
Table 6. Exothermic and endothermic non-reversing heat flow in 1st and 2nd heats
| 1st Heat J/g | 2nd Heat J/g | |
| Exothermic | 9.37 | 32.04 |
| Endothermic | -86.18 | -56.60 |
| Total Non-Reversing | -76.81 | -24.56 |
| Change in Endothermic Non-Reversing Heat Flow (J/g) | -25.98 |
Conclusions
The effect of stretching of PP film used in Celgard 2400® battery separator was evaluated using MDSC. The MDSC experiment reveals that structures with higher melting points than the typical melting point range of PP were mainly in the non-reversing heat flow signal in both the first and second heats. The structures may be very dense, efficiently packed crystals that may merit further investigation by more definitive techniques. There are also provisional orientation effects contributing to the non-reversing heat flow.
Additionally, the second heat non-reversing heat flow shows crystal perfection, cold crystallization, and high melting transitions. The high melting crystals do not appear when a faster heating rate of 10 °C / min is used, indicating that they may form during cold crystallization. The morphology that nucleates the high melting crystals is stable at approximately 50 °C above the equilibrium melting temperature but the crystallization is suppressed at a modest heating rate of 10 °C /min.
The reversing heat flow in the first heat shows α phase melting at 165 °C and high melting crystals at 169 °C. The second heat reversing heat flow shows α phase and β phase not observed in the first heat. The β structures are obscured in the total heat flow by simultaneous cold crystallization.
There is a reduction in the fractional contribution of the non-reversing heat flow to ΔH in the second heat indicating that some of the induced structure is destroyed during the isothermal hold above the equilibrium melting temperature. A method to estimate this reduction in ΔH based on evaluating the difference in endothermic non-reversing heat flow was proposed and found that an endothermic difference in the heat of fusion in the second heat relative to the first is likely due to provisional orientation effects.
References
1. H Lau, J Browne, “Thermal Analysis of a Battery Separator (TA457),” TA Instruments, New Castle DE, 2022.
2. M. Reading, “Modulated Temperature Scanning Calorimetry – Theoretical and Practical Applications in Polymer Characterization,” in Hot Topics in Thermal Analysis and Calorimetry, vol. 6, J. Simon, Ed., Springer, 2006.
3. Browne, J, “TA 395 Assessing the Effects of Process Temperature on Crystallization Kinetics of Polyphenylene Sulfide Utilizing Differential Scanning Calorimetry (DSC)”.
4. F. Sadeghi, “Properties of Uniaxially Stretched Polypropylene Films: Effects of Drawing Temperature and Random Copolymer Content,” The Canadian Journal of Chemical Engineering, vol. 88, December 2010.
5. Len Thomas, “Modulated DSC Paper #2 – Modulated DSC Basics; Calculation and Calibration of MDSC Signals,” TA Instruments, New Castle DE.
Acknowledgement
This paper was written by James Browne, Senior Scientist at TA Instruments.
TA Instruments has been long recognized as an innovator and leader in modulated thermal analysis.
Click here to download the printable version of this application note.

