Keywords: TA Instruments, Discovery, DSC, heat capacity, modulated DSC, MDSC
TA489
Abstract
Presented is a summary of differential scanning calorimetry (DSC) methods available for determining specific heat capacity utilizing TA Instruments™ Discovery™ DSC instruments.
Introduction
Heat capacity is a fundamental thermodynamic property and can be measured using a differential scanning calorimeter (DSC). In the SI unit system, heat capacity is defined as the amount of heat required to raise the temperature of one gram of material one degree Kelvin. The heat referred to in this description is the heat stored in molecular motion of the material, including translational, vibrational, and rotational motions [1].
Measurement of Heat Capacity by DSC
Specific heat capacity (Cp) is obtained by dividing heat capacity by the mass of the sample. It is an intensive property of a material, while heat capacity is an extensive property. Historically, Cp has been measured using the protocol in ASTM E1269 [2]. The introduction of Advanced Tzero™ Technology and the modulated DSC (MDSC™) Method have significantly advanced the ease and reliability of measuring Cp. Three alternative options can be used to measure Cp: direct heat capacity measurement, dynamic MDSC measurement, and quasi-isothermal MDSC measurement. Each method for determining heat capacity is generally based on the principles in ASTM E1269. Reading and understanding the methodology of ASTM E1269 is recommended regardless of the method utilized measuring heat capacity.
Equation 1 describes the heat flow rate obtained in a DSC experiment.
Equation 1

Where
dQ/dt is the heat flow rate (milliwatts)
dT/dt is the heating rate (°C / min)
Cp is specific heat capacity (J/g °C)
f(T,t) is a collection of terms dependent on time and temperature sometimes referred to as the kinetic contribution to the heat flow rate.
Neglecting the f(T,t) term in Equation 1, the specific heat capacity can be determined by dividing the heat flow rate by the heating rate shown in Equation 2.
Equation 2

Where
Q is the amount of heat required to achieve the change in temperature (ΔT)
A calibration constant (KCp) must be applied to the observed heat capacity obtained in the DSC experiment. Equation 3 is used to calculate KCp.
Equation 3

Where
KCp is heat capacity calibration constant
Cp observed is the observed heat capacity of a standard of known heat capacity from the DSC experiment
Cp literature is the known heat capacity of the standard obtained from published literature values. The resultant KCp constant is typically close to unity
The observed heat capacity obtained in the DSC experiment is then multiplied by KCp to obtain the true heat capacity of the sample.
Choosing a Heat Capacity Reference
Sabbah, et. al. published a review of heat capacity reference materials in the solid, liquid, and gas phases [3].
For solid materials, sapphire (α-aluminum oxide) is often used as the known heat capacity standard as it is stable, free of transitions over a large temperature range, safe to handle, relatively inexpensive, and available as a certified reference material [3]. Ditmars, et. al. published a detailed table of the heat capacity of synthetic sapphire [4] and this table is included in an application note on the TA Instruments website (www.tainstruments.com) TN8 [5].
Methods to Determine Cp
ASTM E1269 (Applicable for all DSCs)
ASTM E1269 requires three DSC experiments: (1) a baseline scan with an empty pan to determine the contribution of the pan to the heat flow, (2) a scan of a reference material of known heat capacity from which the calibration constant (KCp) can be determined, and (3) a scan of the sample of interest. TA Instruments TRIOS™ software enables simplified data analysis for users of ASTM E1269. Details on the requirements to enable this automated transformation are clearly outlined in the TRIOS software help files. ASTM E1269 can be used with any DSC. The procedure and calculations are clear, concise, and contain a precision and bias section based on round-robin testing.
Direct Heat Capacity Measurement (Direct Cp)
(Discovery 2500, Q2000, and Q1000 DSCs)
Heat capacity can be determined from a single experiment in the Discovery 2500 DSC, as well as its predecessors, the Discovery DSC, the Q1000, and the Q2000. This is possible due to Tzero Technology. Tzero Technology utilizes a more complete heat flow equation that accounts for the asymmetries of the DSC cell by calculating the capacitance and resistance of the cell components, as well as accounting for differences in sample and reference heating rates during transitions. Advanced Tzero Technology extends this concept further by accounting for the effect of the capacitance and resistance of the pan on the heat flow signal [6] [7]. The user simply chooses the pan type and enters the mass of the pan, which eliminates the need for a separate DSC run of the empty pan required in ASTM E1269. The improvement of the DSC baseline allows for direct determination of heat capacity using a single experiment after a calibration run of a standard of known heat capacity. The heat capacity calculated from the heat flow acquired during the experiment and can be plotted as a discrete signal.
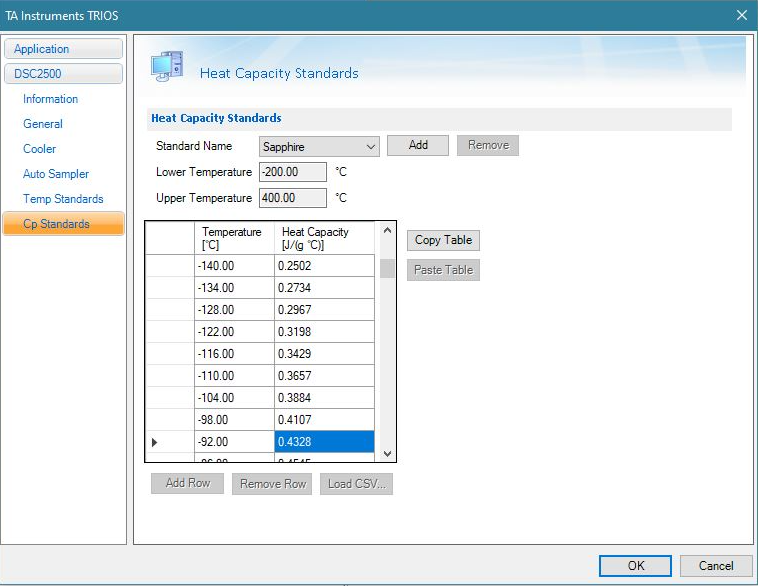
The discussion below summarizes running a direct capacity experiment. The steps are outlined in the TRIOS software Help menu. After completing and applying temperature, cell constant, and Tzero calibrations, the direct heat capacity calibration can be performed, analyzed, and applied. The calibration is constructed by dividing the known values of the heat capacity standard by the observed values obtained in the calibration run as described in Equation 3 in the temperature range of interest. All calculations are done by the software and the user simply performs the experiment. Once the calibration is applied, subsequent DSC runs will include a true heat capacity signal that can be plotted like the heat flow signal. Known values of heat capacity of sapphire and polystyrene are included in the system firmware. The user is also able to use other heat capacity reference materials for calibration. From the Options menu in TRIOS software, choose Cp standards as shown in Figure 1.
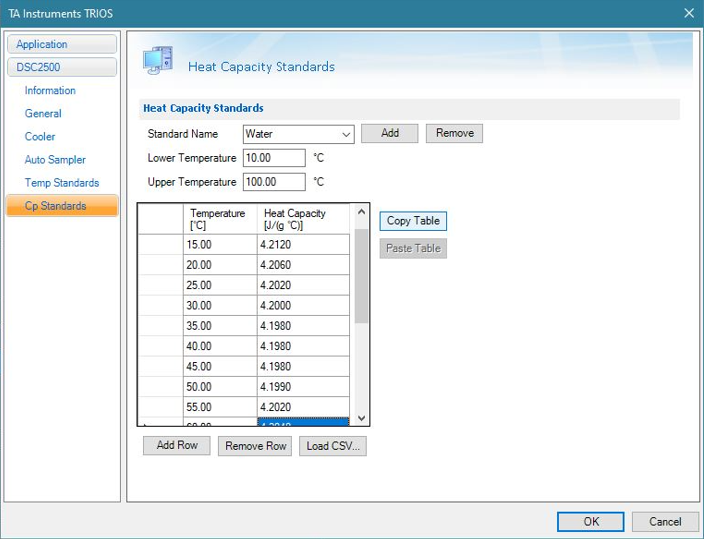
Enter the temperature and heat capacity data for your reference (Figure 2). In this case, water is used and the heat capacity data was obtained from the NIST website (https://webbook.nist.gov).
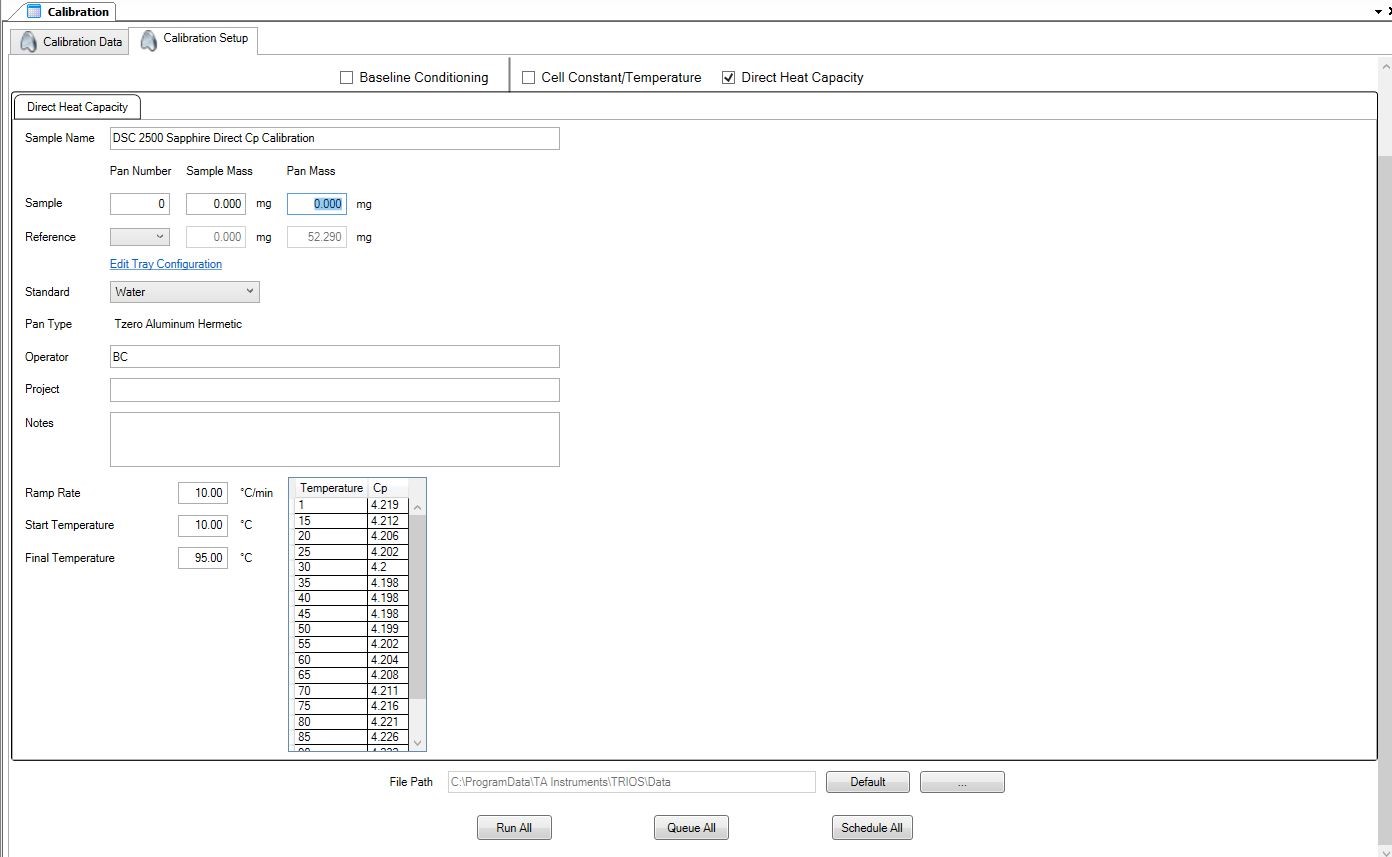
The DSC calibration experiment can then be set up using the calibration window in TRIOS (Figure 3). Complete instructions for the direct heat capacity calibration can be found in the TRIOS software Help menu.
Once the dialog shown in Figure 3 has been completed, run the experiment and verify the calibration.
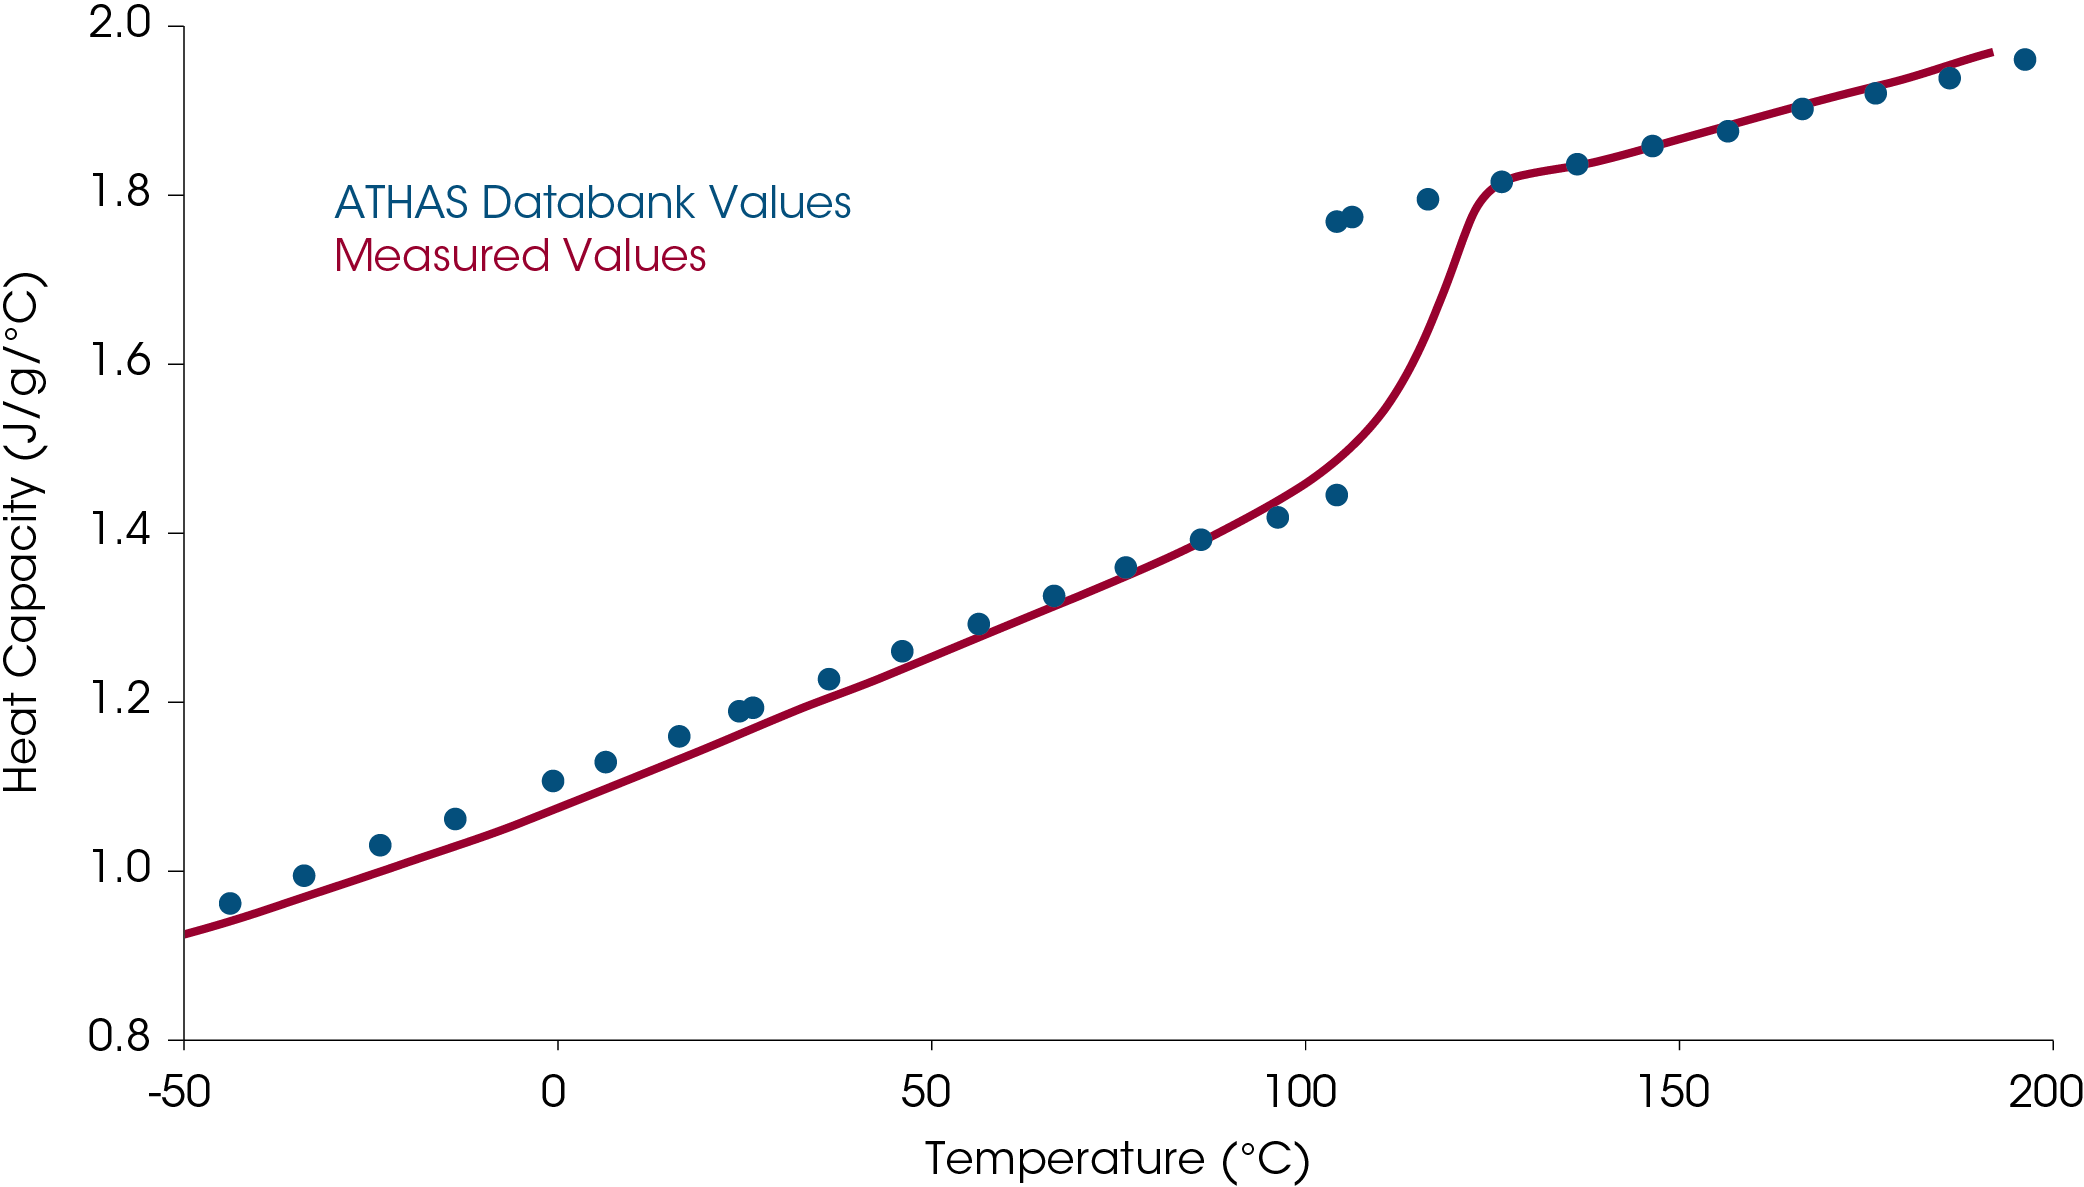
An example of direct heat capacity measurement for a sample of PMMA is shown in Figure 4.
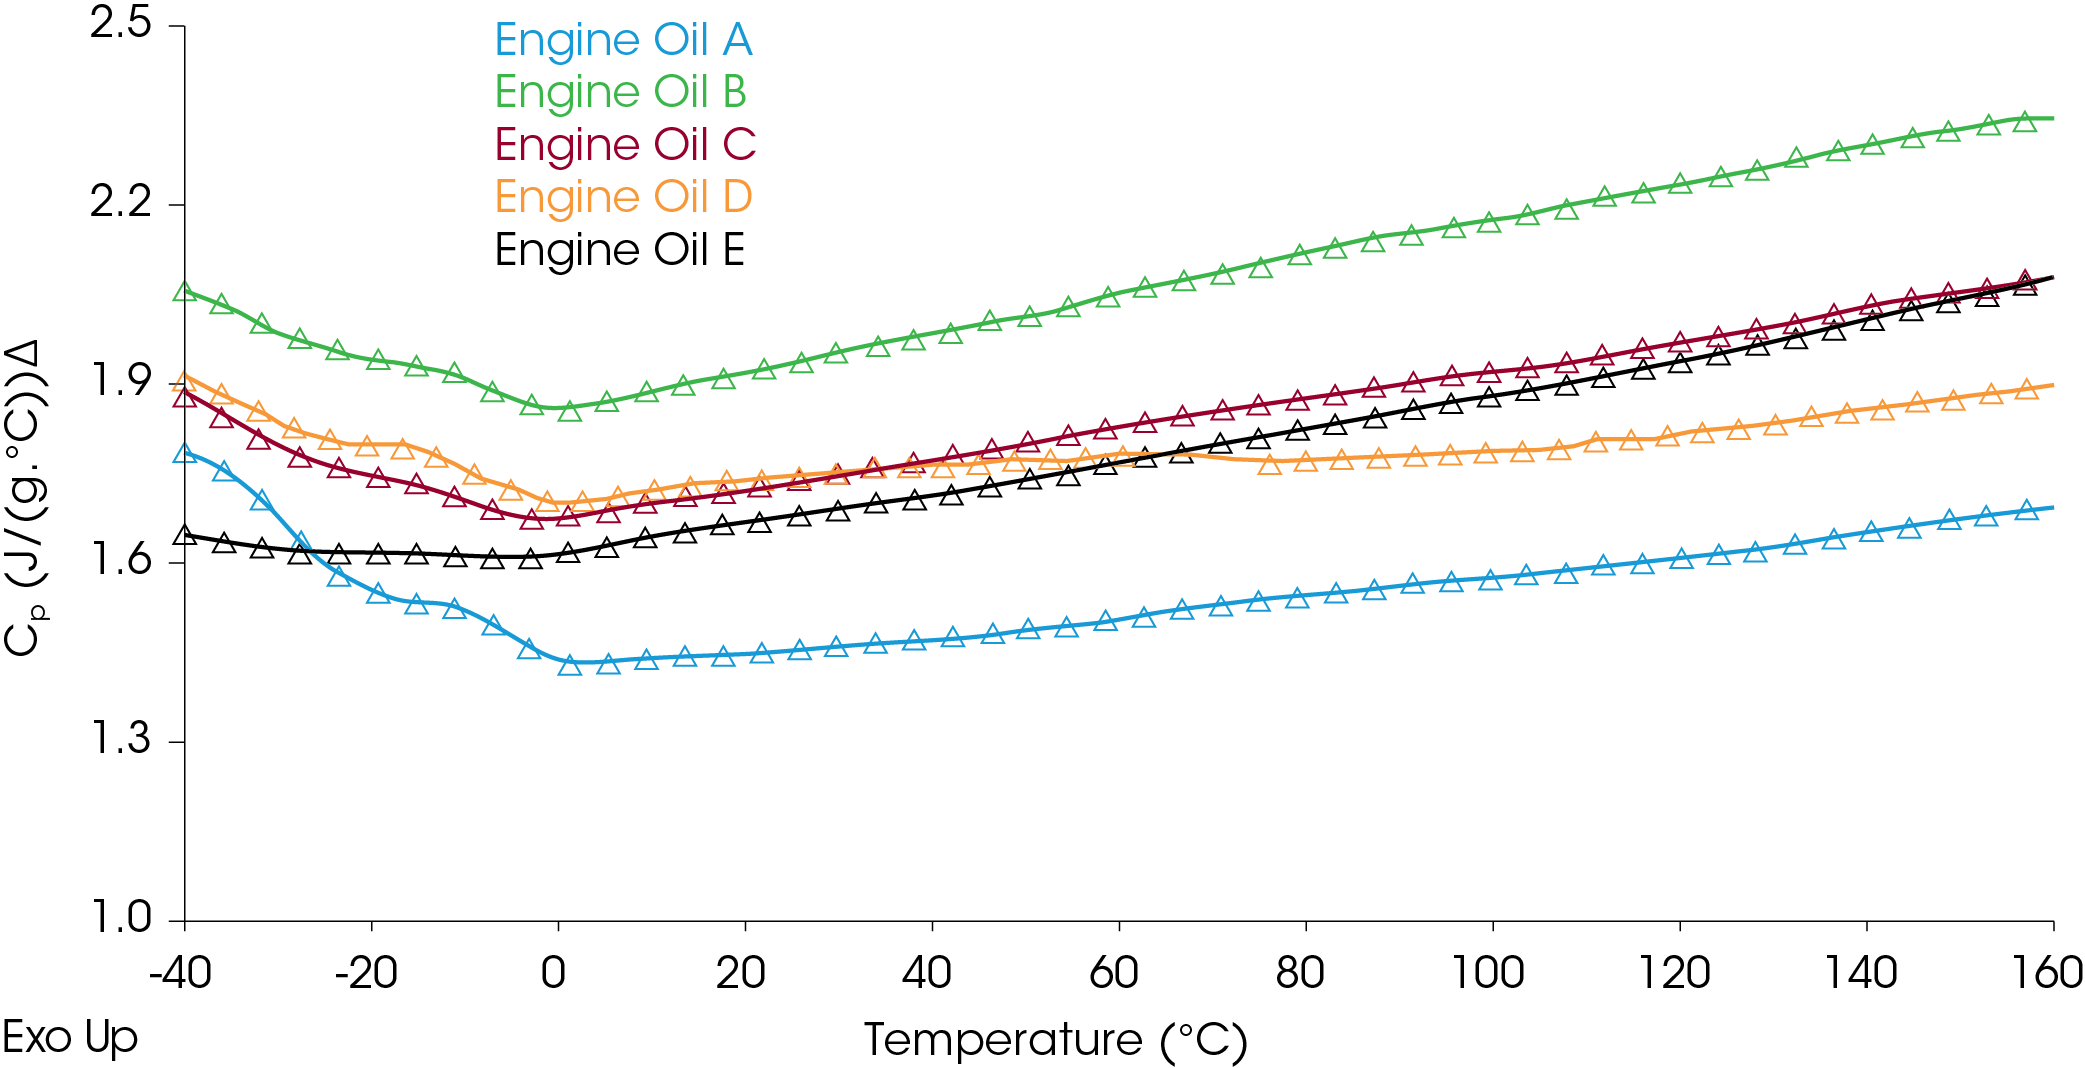
Comparison of heat capacities of commercial engine oils is shown in Figure 5.
Measuring Heat Capacity Using Modulated DSC (MDSC)
The measurement of heat capacity is also done using MDSC experiments utilizing either a dynamic (ramping) method or a quasiisothermal method. The MDSC technique is documented in ASTM E2716 with the dynamic method referred to as test method A and the quasi-isothermal method referred to as test method B [8].
It is worth understanding the basic theory of how heat capacity is measured using MDSC methods and this is thoroughly explained by Reading, Lacey, and Price [1]. As stated previously, the heat referred to is stored in the sample as vibrational, rotational, and translational motions so that the heat required to raise the temperature 1 °C and the heat liberated when the temperature is lowered 1 °C is the same and is said to be restored reversibly. For a linear temperature program in a simple DSC heating experiment, the temperature T can be expressed in Equation 4.
Equation 4

Where:
T is the temperature at any time
T0 is the initial temperature.
β is the heating rate (°C / min)
t is the time that the heating rate is applied
If this temperature program is replaced with a linear ramp modulated with a sine wave, the temperature can be expressed in Equation 5.
Equation 5

Where:
A is the modulation amplitude
ω is the angular frequency
The derivative with respect to time results in the instantaneous heating rate shown in Equation 6.
Equation 6

If we replace dT/dt in Equation 1 with the expression in Equation 6, and neglect f(T,t) we obtain a new expression for the heat flow rate (dQ/dt) in the DSC experiment, shown in Equation 7.
Equation 7

From this expression we can also see the user-entered parameters in the MDSC experiment:
β = the underlying heating rate (°C / min)
A = modulation amplitude (+/- °C)
ω = 2π/s where s is the period in seconds
We can also deduce the effect the MSDC experiment parameters have on the heat flow rate, increasing the underlying heating rate and/or the amplitude will increase the heat flow rate, decreasing the period will also increase the heat flow rate. Often there is a need to vary the user entered parameters to increase the signal or obtain the requisite modulations through transitions of interest, but there are limitations which affect the validity of the MDSC measurement. These limitations are discussed in Reading’s work and other sources. There is also the case in which β = 0 in Equation 7. In this case, shown in Equation 8, heat capacity can be determined.
Equation 8

It is also clear that the modulated heat flow in the modulated experiment must also result in a cosine wave.
For simplicity, Equation 8 is rewritten:
Equation 9

Where:
AHF is the amplitude of the heat flow modulation
ωA is the amplitude of the heating rate modulation
The reversing heat capacity (RevCp) can be written as:
Equation 10

Where:
AHR the amplitude of the heating rate modulation from ωA in Equation 9
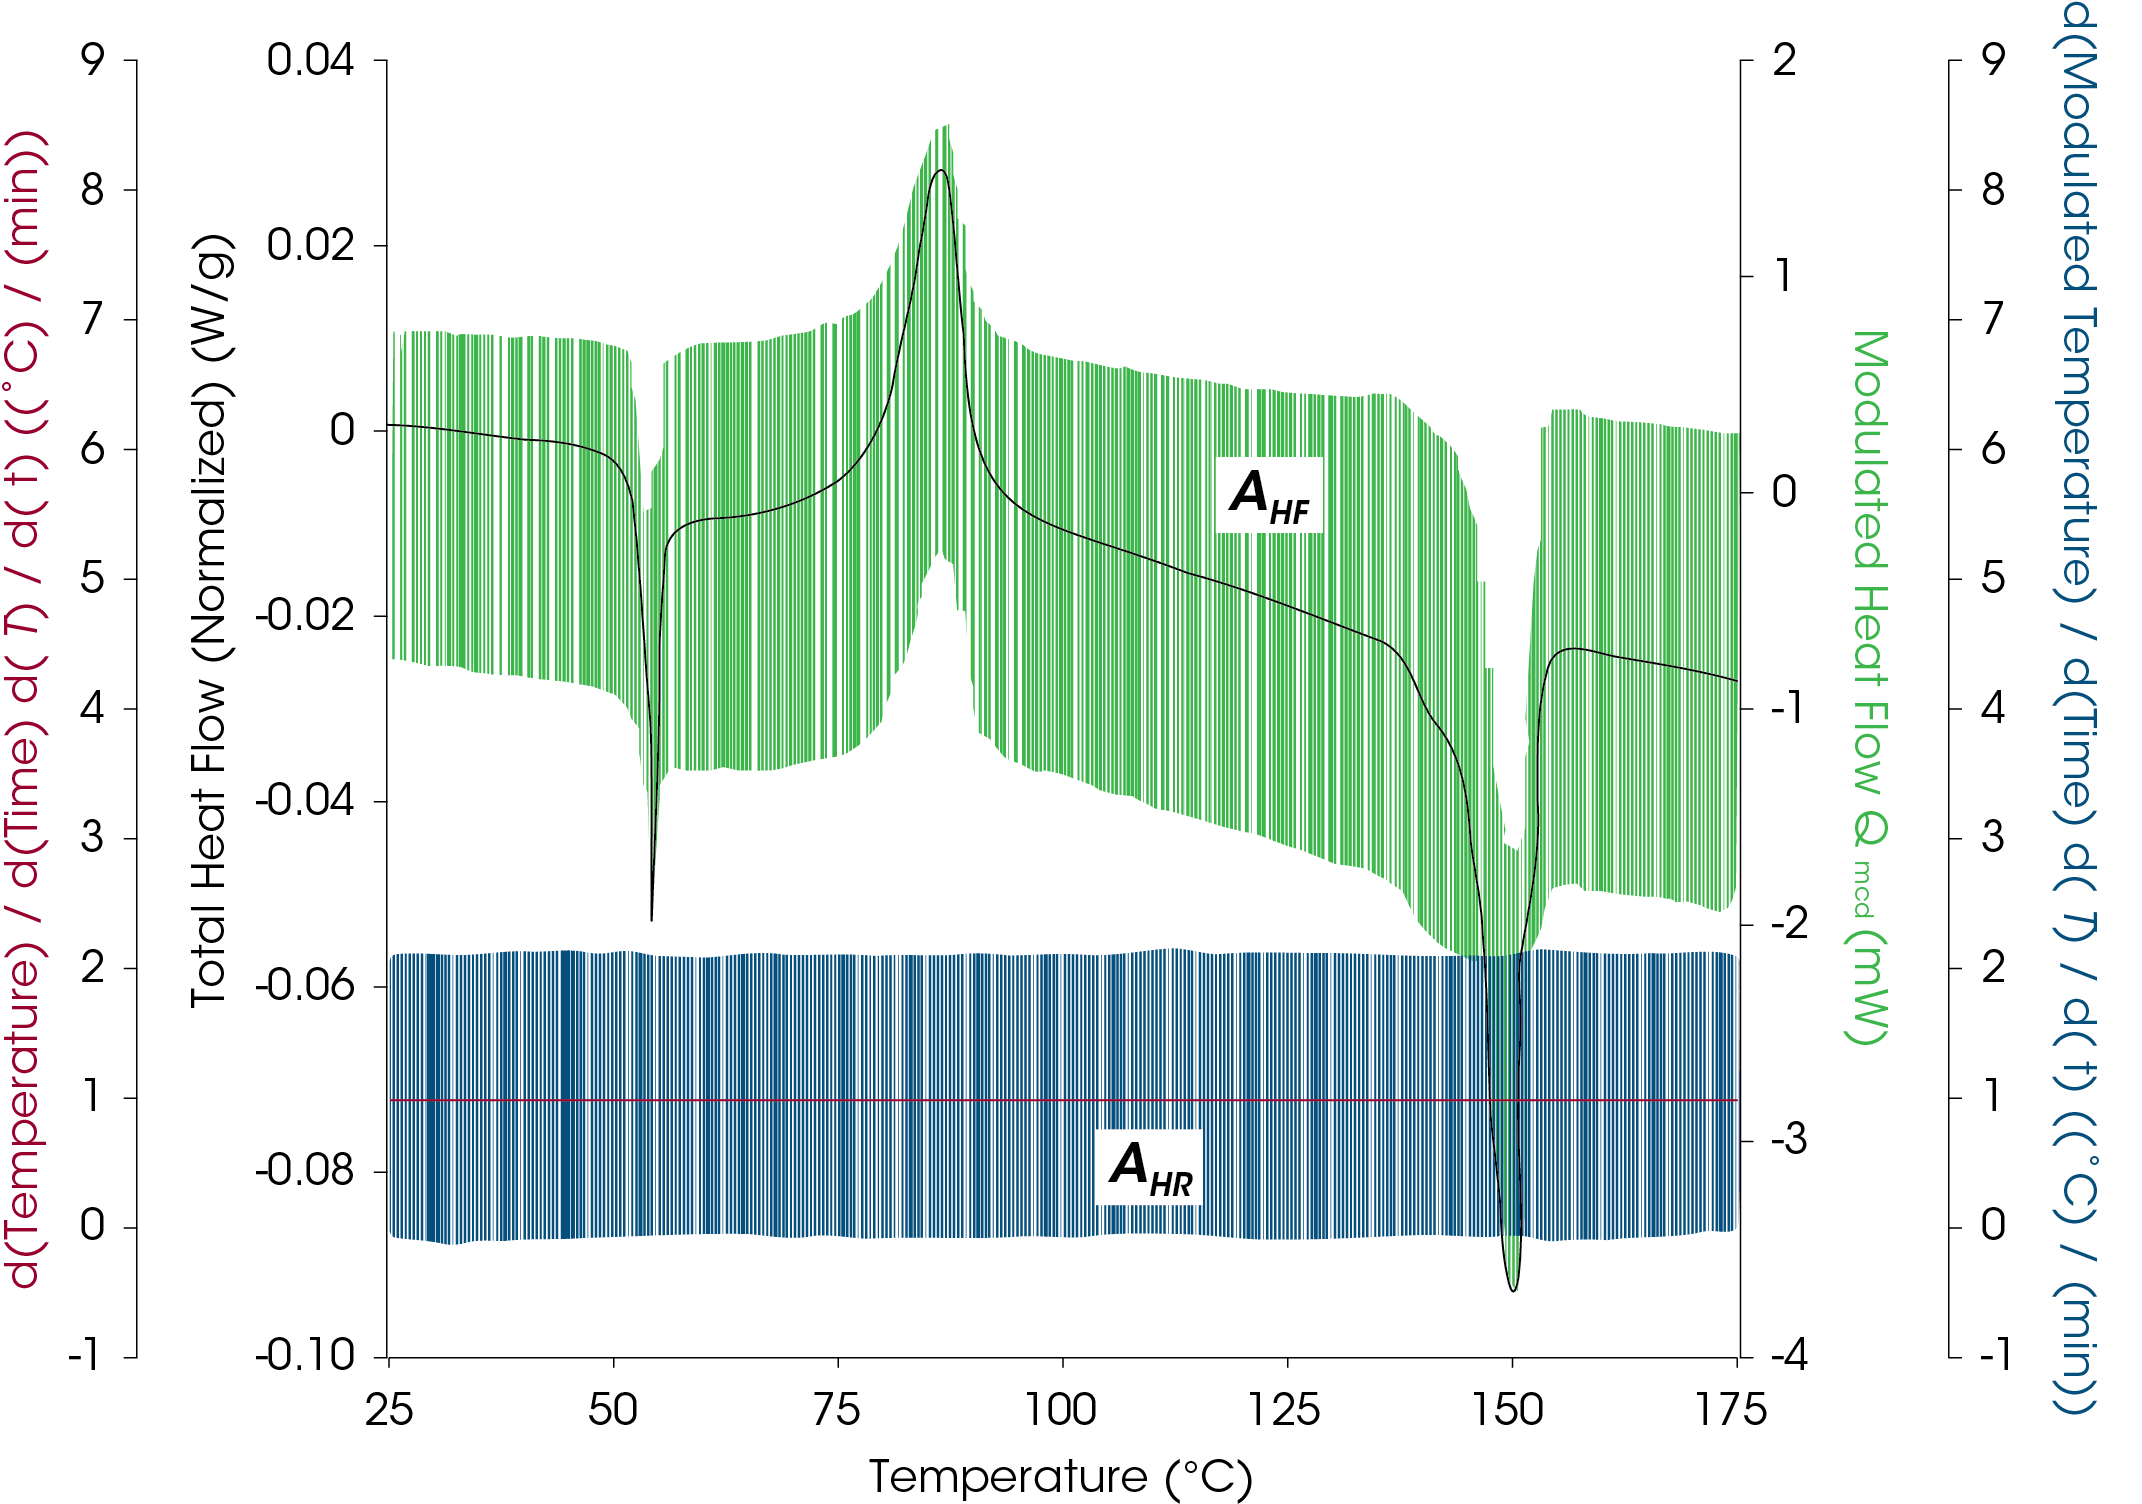
The modulated heating rate amplitude and resultant modulated heat flow amplitude are shown in the example of polylactic acid (PLA) in Figure 6.
Dynamic MDSC Method- “Rev Cp” (Available on all TA DSC instruments with MDSC features)
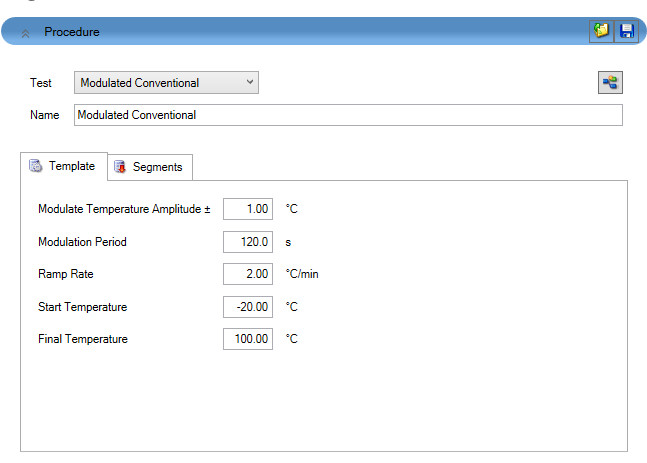
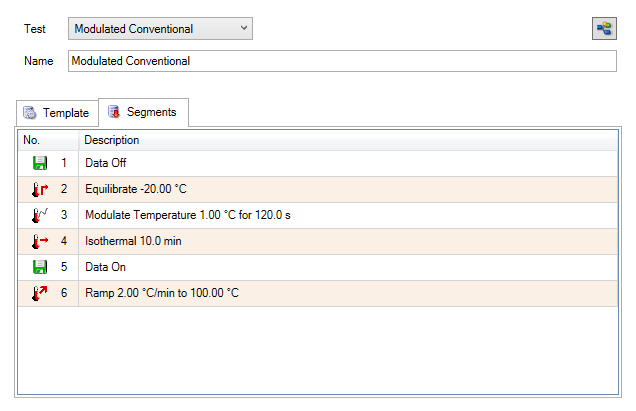
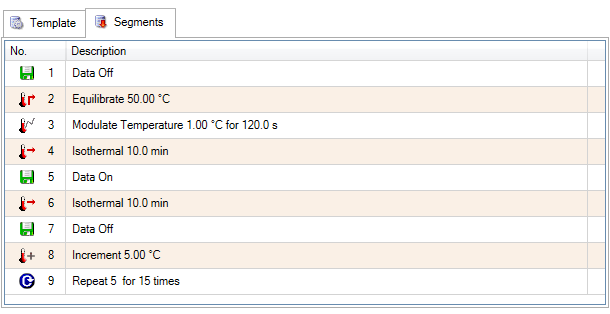
The dynamic, or ramping, MDSC method is used to measure heat capacity over a specific temperature range. Like the previously discussed direct method, the true specific heat capacity in dynamic MDSC can be plotted as a signal after calibration using a known standard. Typical starting parameters for a dynamic MDSC experiment are shown in Table 1 and entered in the fields in the TRIOS software (Figure 7). It is recommended to start from the modulated template. Individual steps can be viewed by toggling to the segment statements as shown in Figure 8. From here, further customization is possible if required.
Calibration is done using a reference material the same way as in the direct heat capacity experiment. The reversing heat capacity (Rev Cp) signal is always used as the heat capacity signal in the MDSC method, the total and non-reversing heat capacities are neglected. The reasons for this are explained in Reading’s book.
Table 1. Suggested starting parameters for heat capacity measurement by MDSC experiments
| Parameter | Value |
| Amplitude | +/- 1 °C |
| Period | 120 seconds |
| Heating rate | 2 or 3 °C / min |
| Experiment type | MDSC Conventional Method |
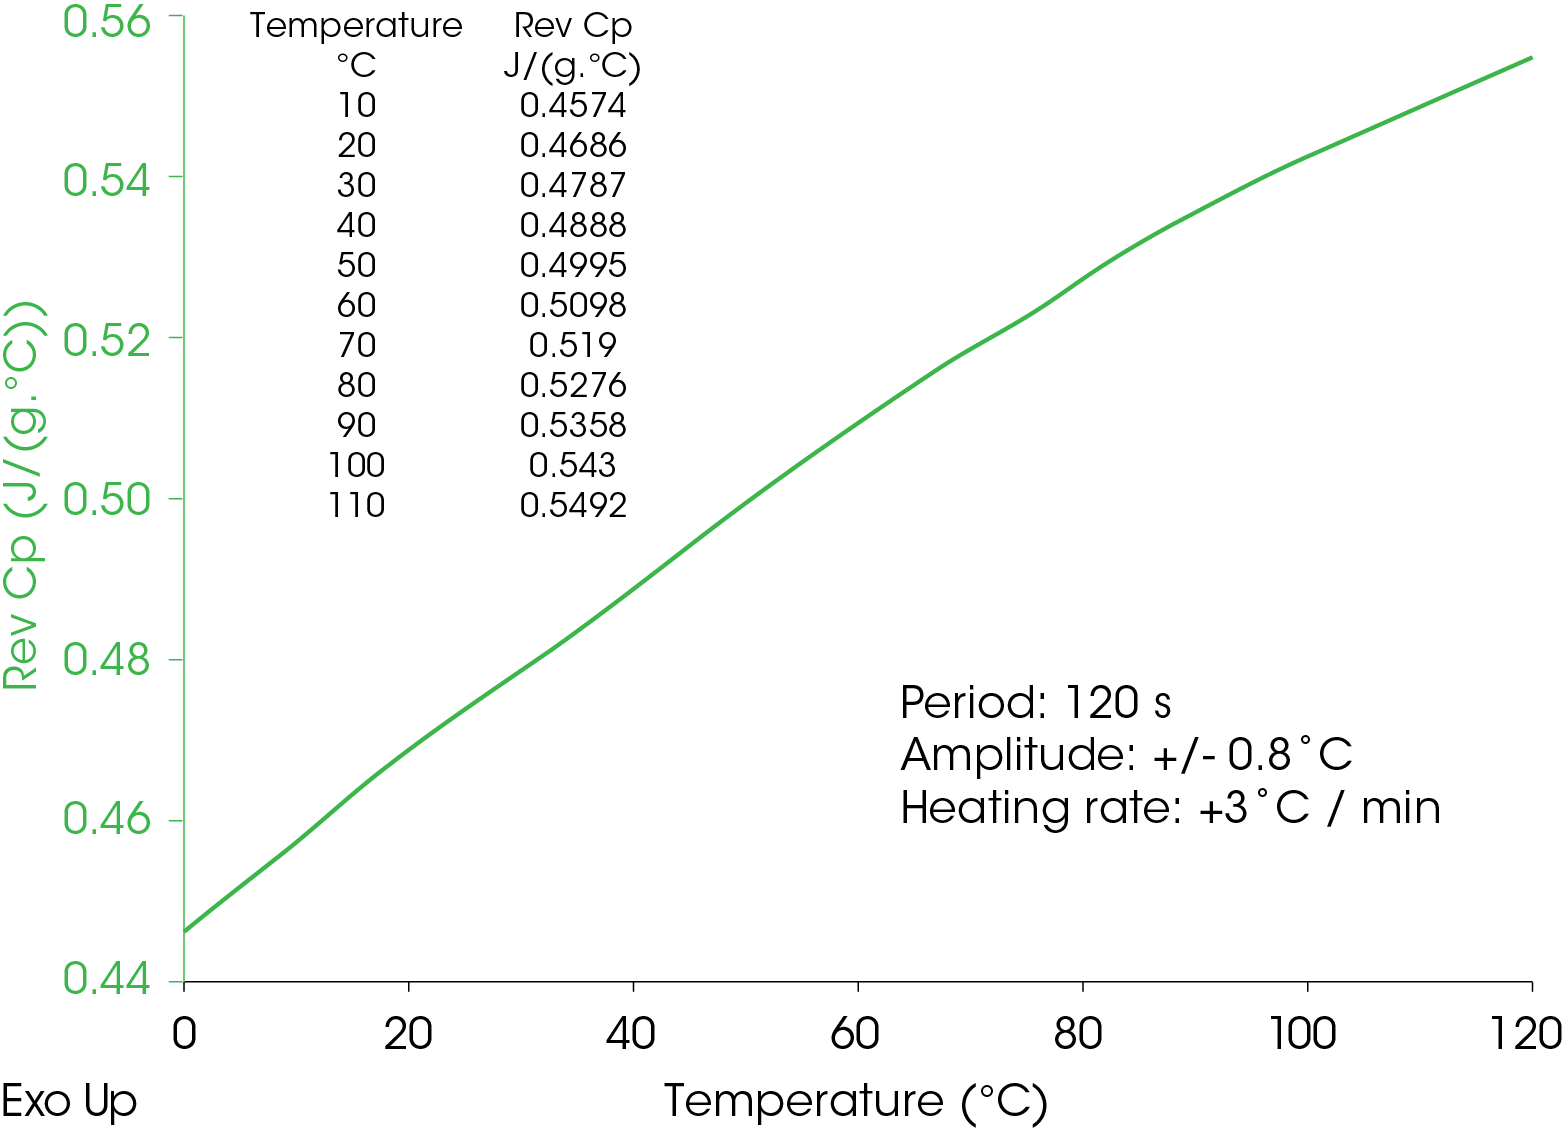
The heat capacity of a cured epoxy is shown in Figure 9 below.
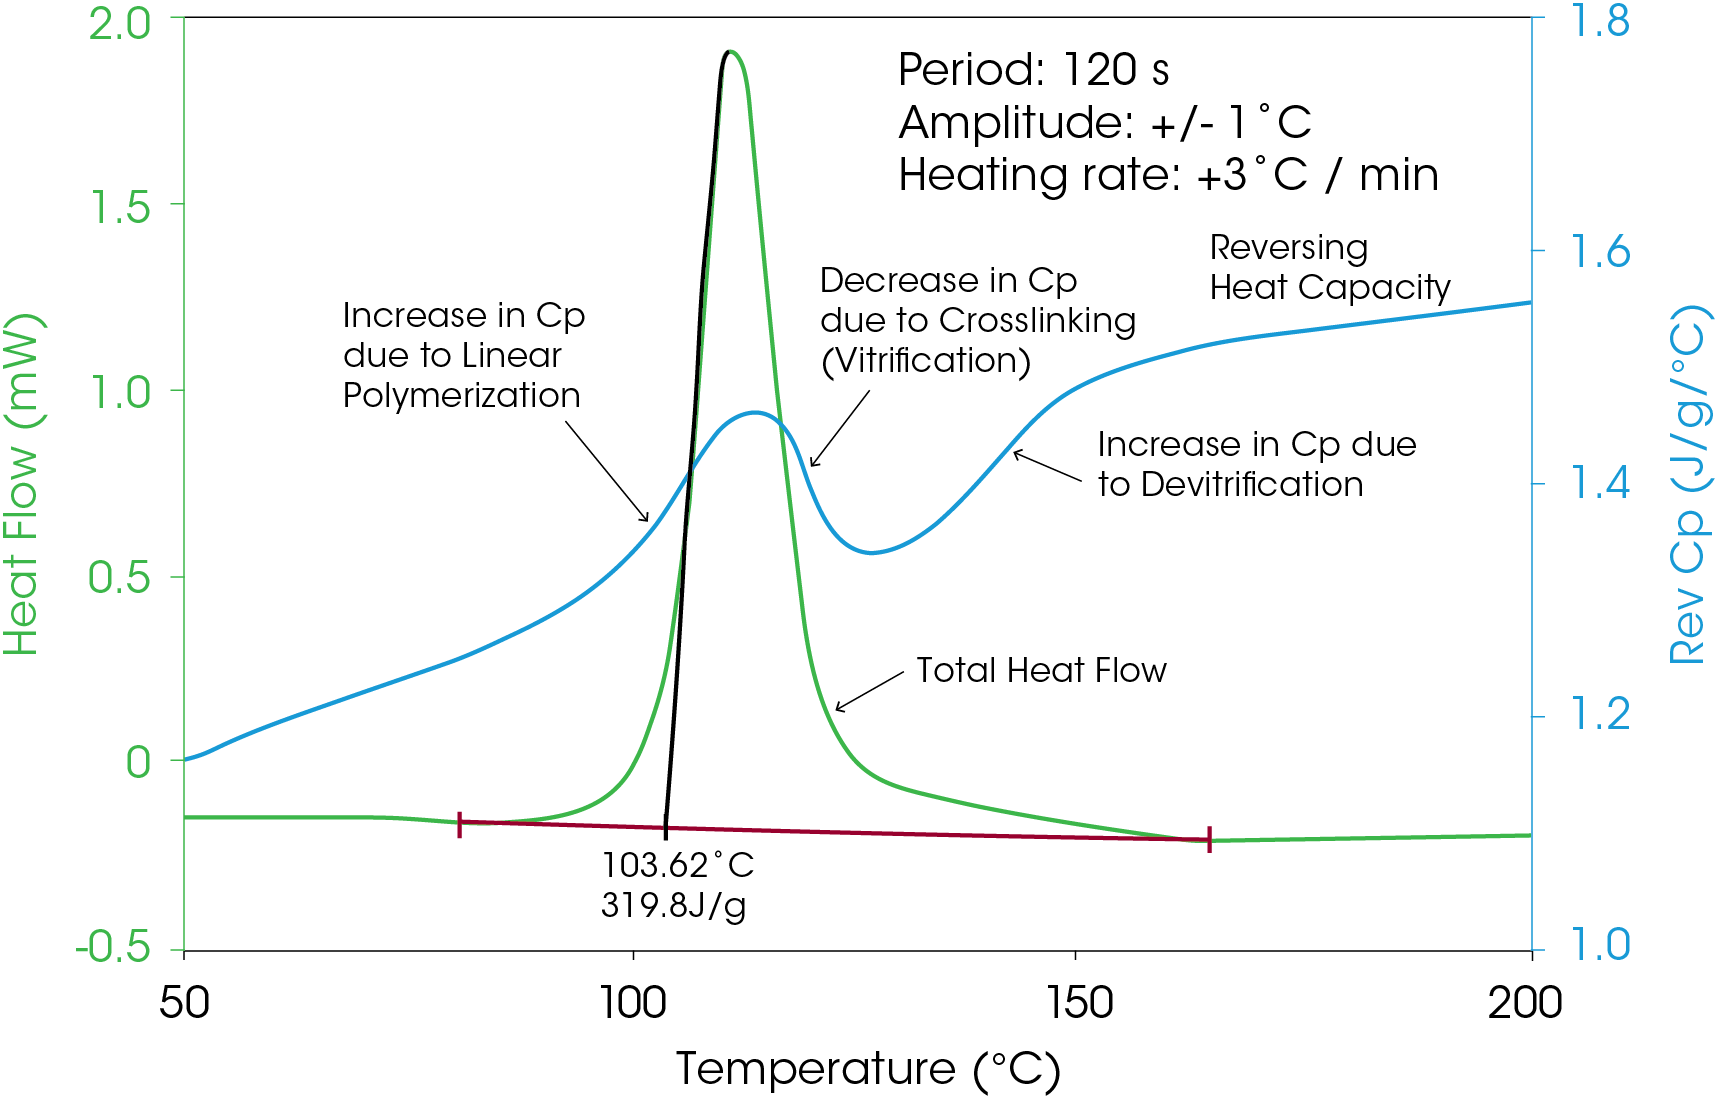
The changes in heat capacity during the curing of an epoxy can be monitored using the reversing heat capacity signal shown in Figure 10. Note the sharp decrease in the heat capacity (blue line) as the epoxy cures followed by the step change increase of the glass transition.
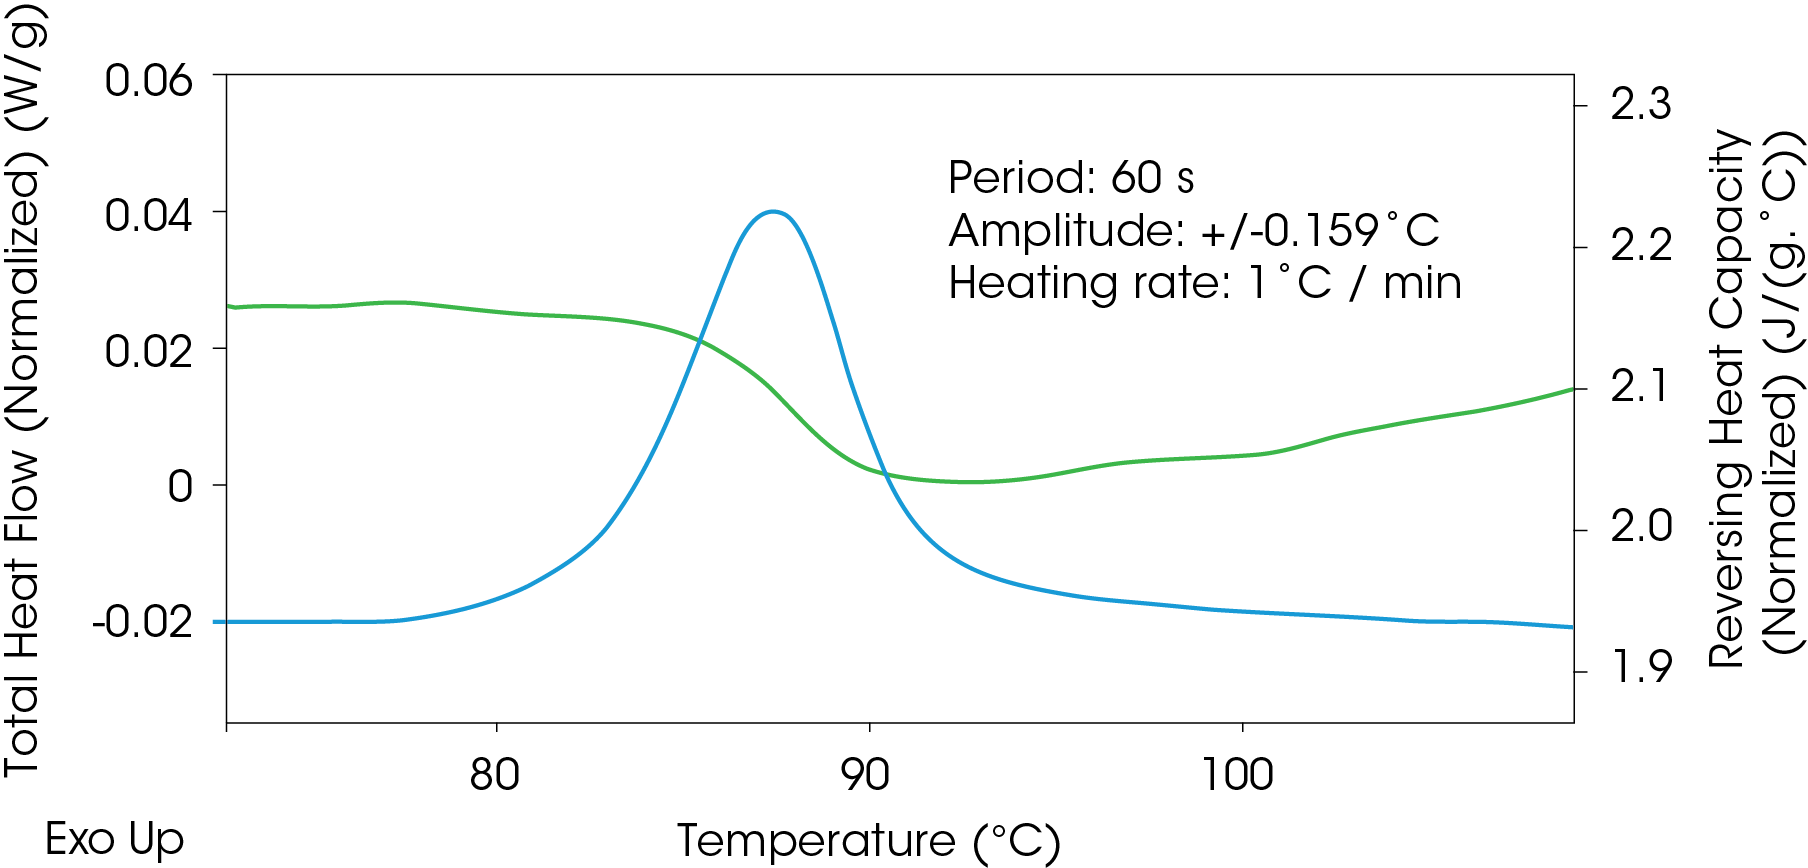
The heat capacity signal can also be used to follow structural changes during cold crystallization of polylactic acid (PLA) shown in Figure 11 even if the conditions are not optimized for the heat capacity experiment. In this experiment, conditions were heat only MDSC parameters, but the observed reduction in the reversing heat capacity signal still provides valuable structural information without calibrating for true heat capacity.
Quasi Isothermal MDSC experiment- “Rev Cp” (Available on all TA DSC instruments with MDSC features)
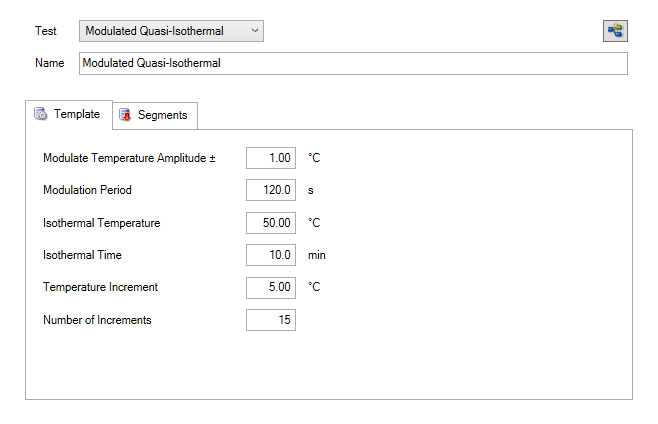
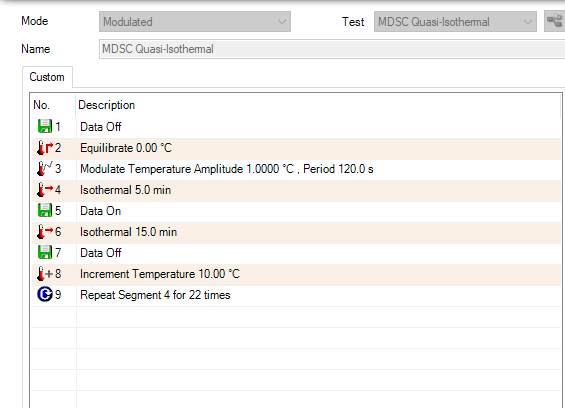
Quasi Isothermal MDSC method is based on the special case where the underlying heating rate (β) is equal to 0, as shown in Equation 8. This allows acquisition of heat capacity of sample and reference at multiple temperatures in a series of quasiisothermal steps resulting in very accurate measurements. The experimental parameters include the amplitude and period, but the average or underlying heating rate is zero and therefore not used. Temperature increments, the number of increments, and an isothermal hold time are also chosen. The reversing heat capacity is obtained by holding isothermally at temperature(s) chosen in the range of interest. The reversing heat capacity is typically chosen as the value at the end of the isothermal hold for each incremented temperature. Figure 12 shows the setup of a typical quasiisothermal MDSC experiment, Figure 13 shows the corresponding segment steps.
For this experiment, the MDSC method parameters were a 120 second period, +/- 1 °C amplitude at a temperature range from 0 to 220 °C, incrementing 10 °C temperature intervals, and holding isothermally for 15 minutes. The segment statements used for the EPDM experiment are shown in Figure 14.
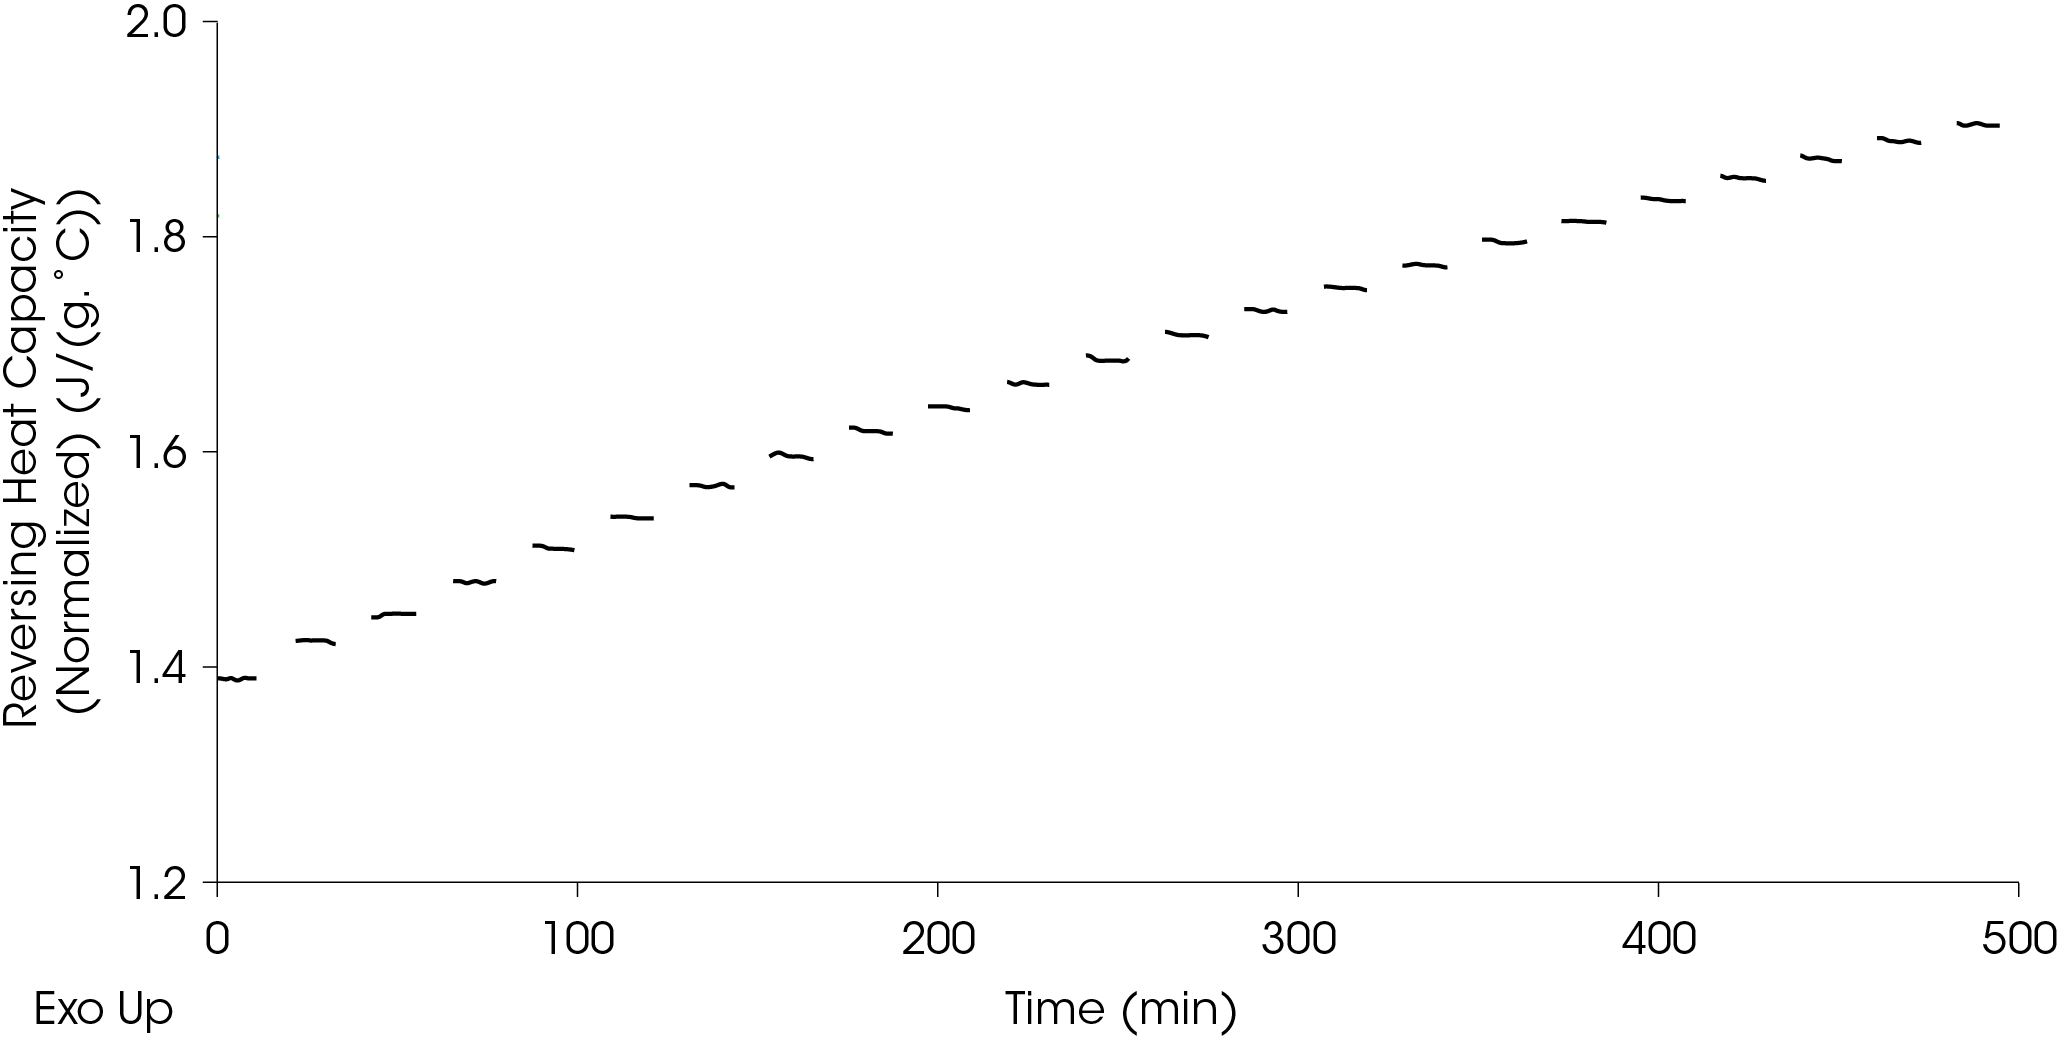
The resulting reversing heat capacity values are shown in Figure 15. It should be noted that these signals are observed values (un-calibrated).
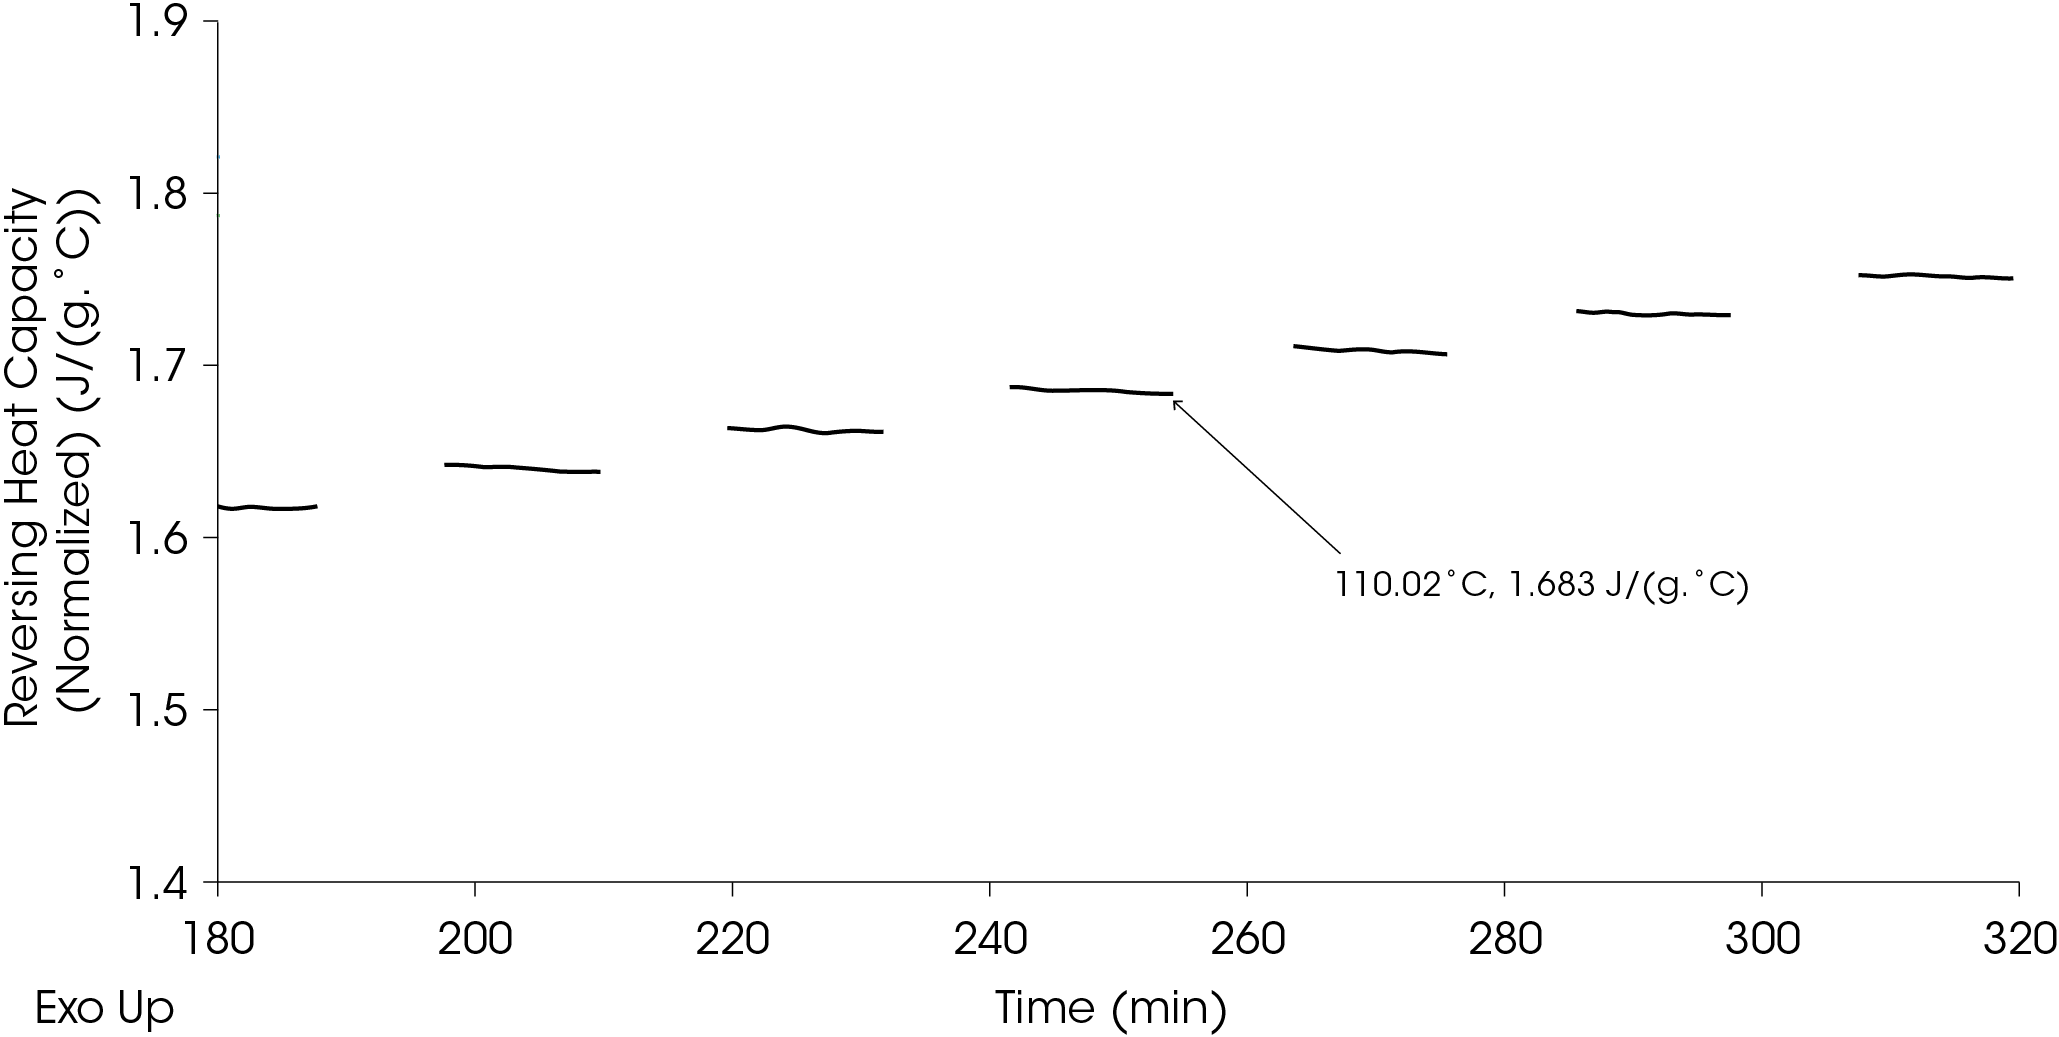
The reversing heat capacity values are taken at the end of the isothermal hold as shown in Figure 16.
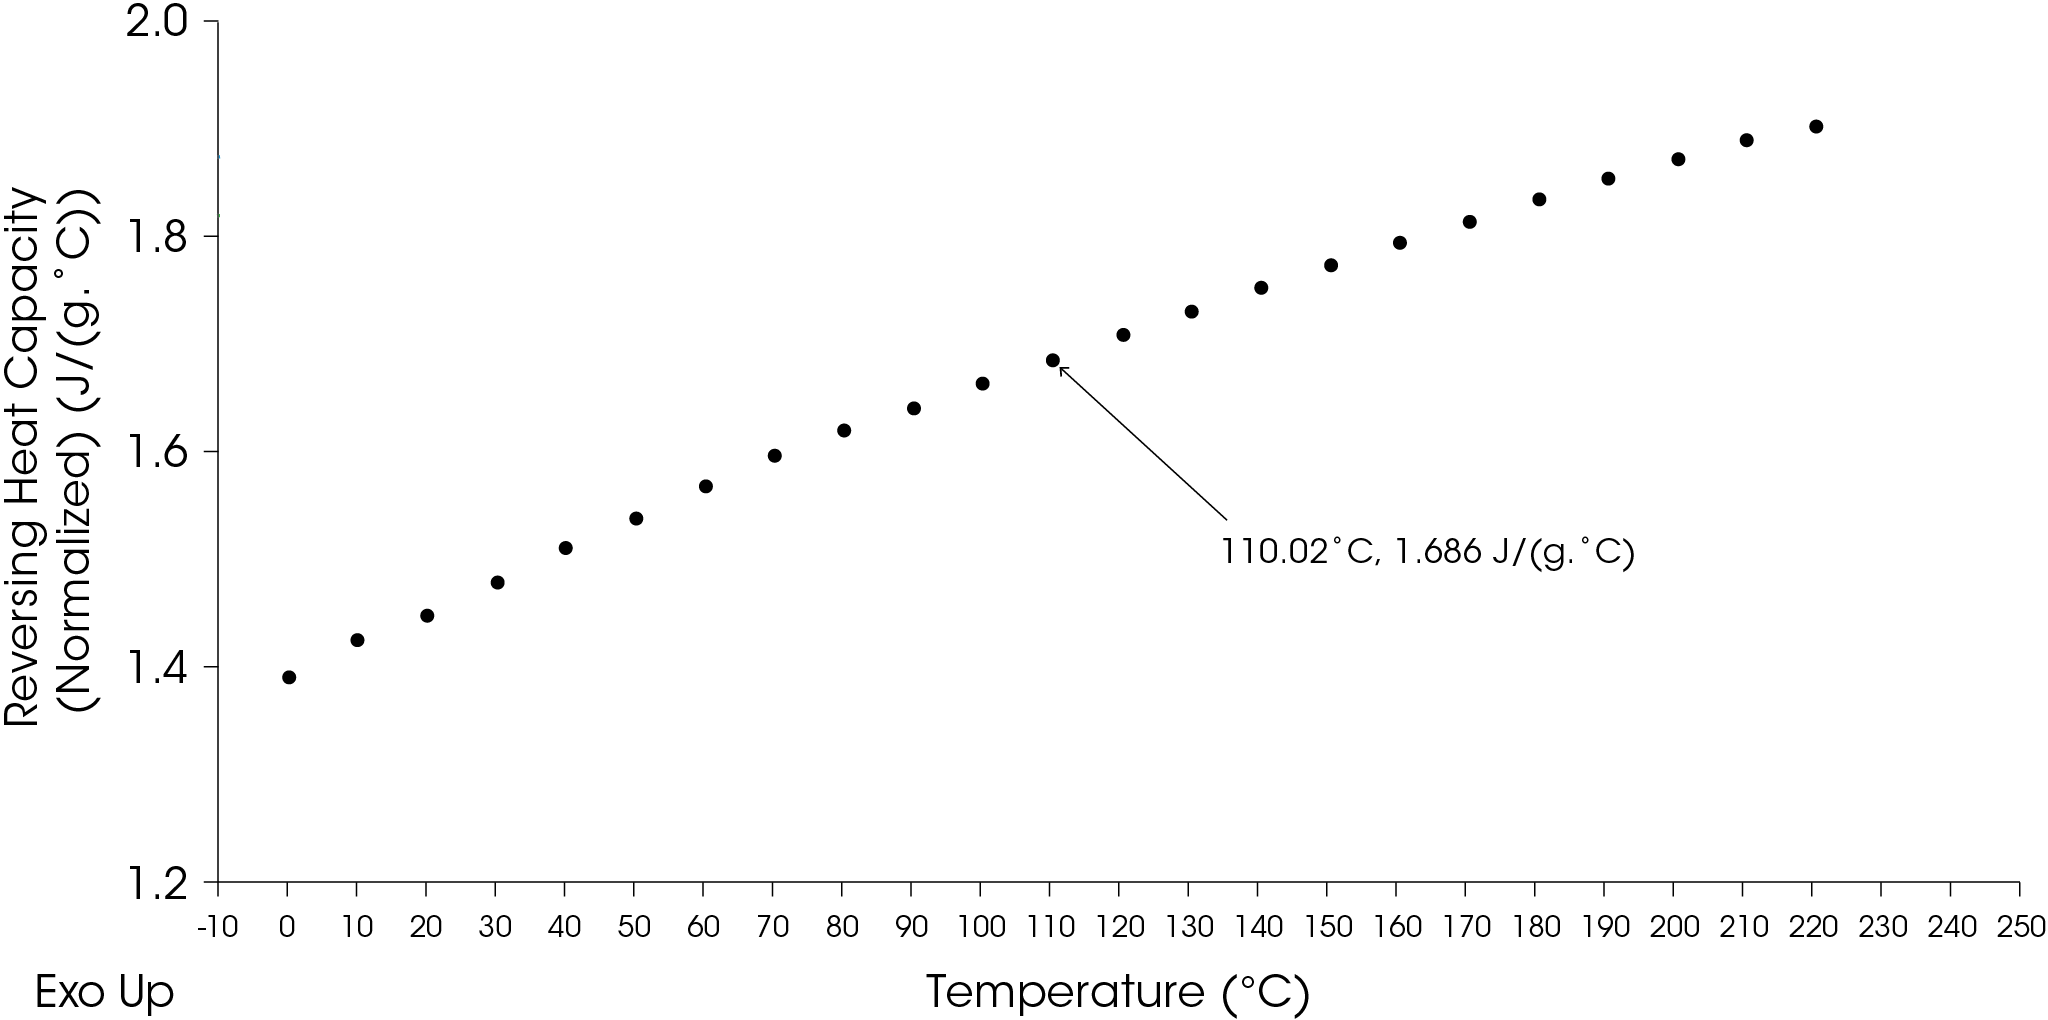
Alternatively, if the reversing heat capacity values show good convergence through the isothermal hold time as they do in the EPDM example, plotting the reversing heat capacity as a function of temperature can be done as shown in Figure 17.
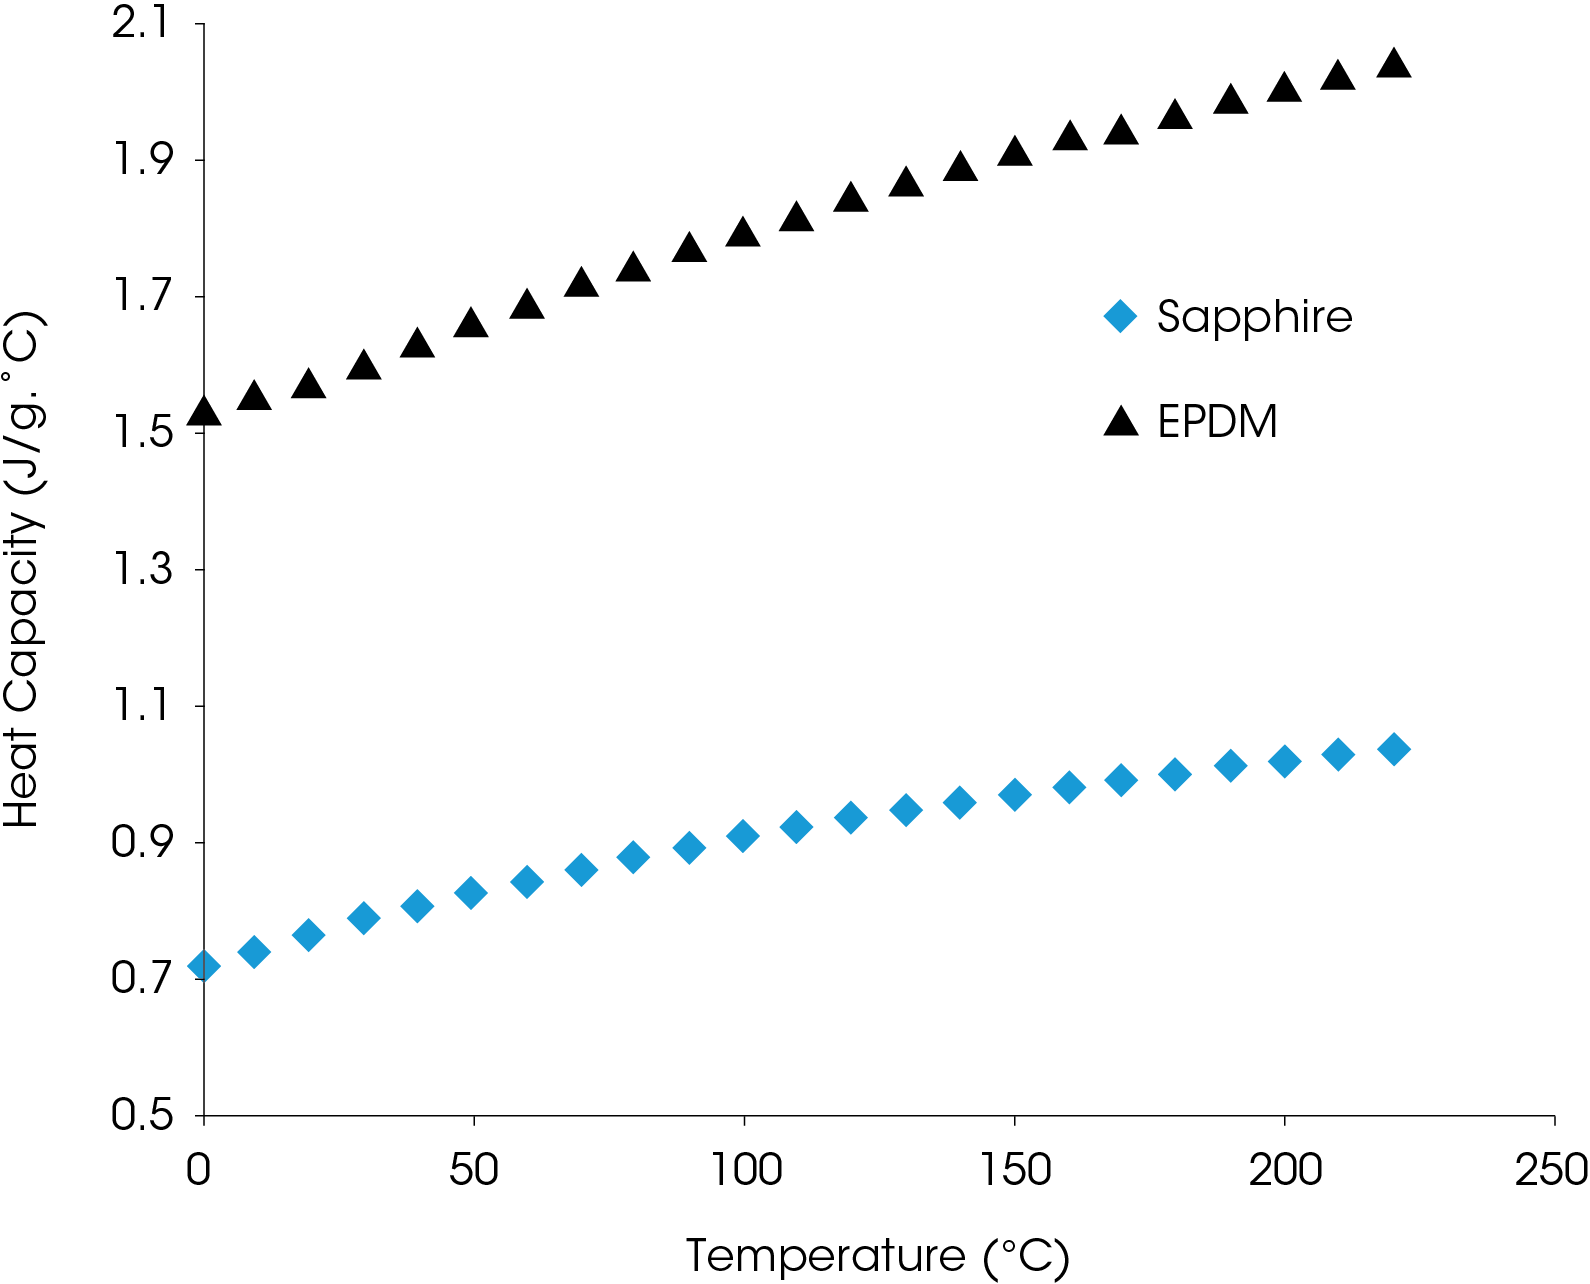
The true values for the specific heat capacity can be obtained by determining KCp for each temperature as shown in Figure 18, which also includes the heat capacity of the sapphire reference.
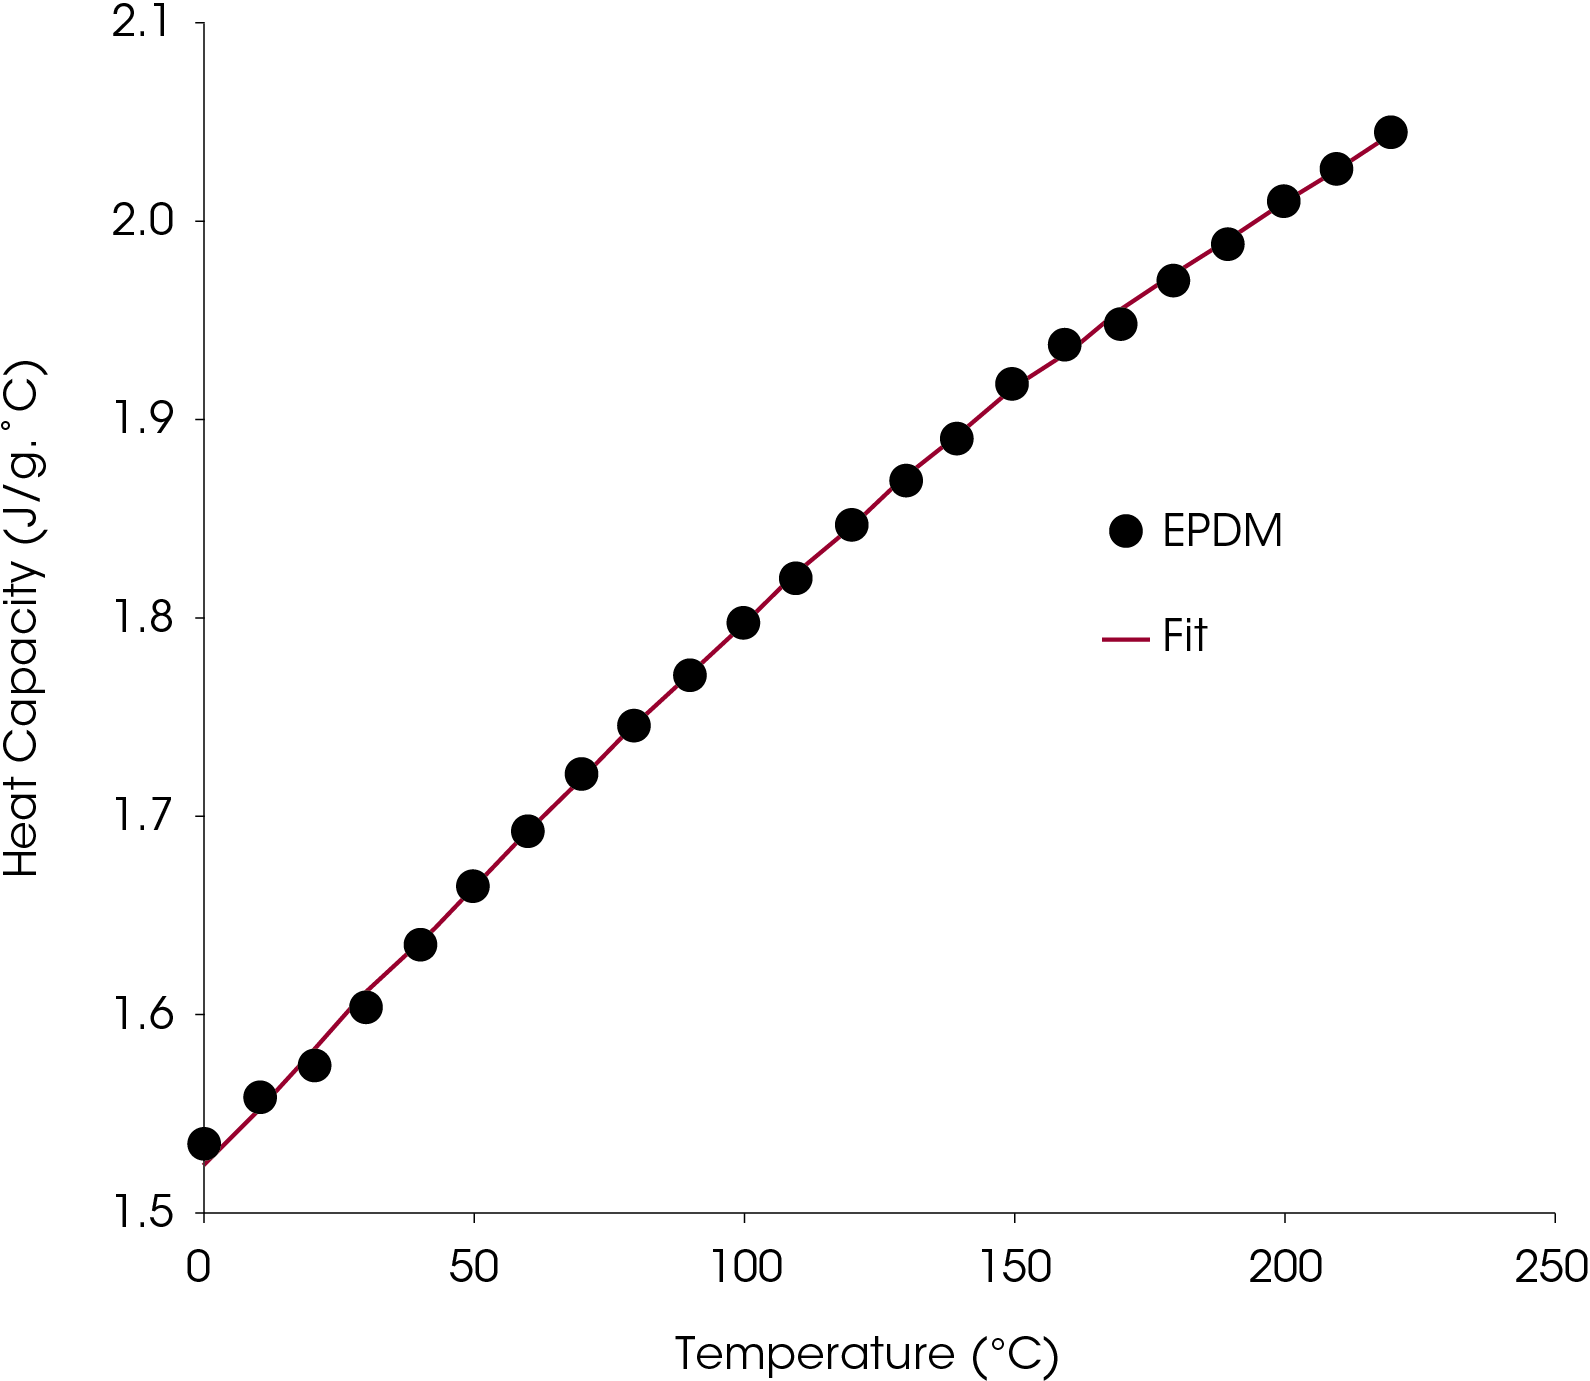
Values of Cp occurring between obtained temperature intervals in the quasi-isothermal experiment can be estimated by fitting the data to a numeric function or by interpolation if the temperature intervals are small. As an example, the heat capacity data of the EPDM was fit using a second order rational polynomial shown in Figure 19.
Summary
The specific heat capacity of a sample can be determined using four different approaches:
- ASTM E1269, which is the traditional 3-run method.
- Direct heat capacity taking advantage of the superior baseline attained using Tzero Technology.
- Dynamic MDSC method (ASTM E2716 method A)
- Quasi-isothermal MDSC method (ASTM E2716 method B)
References
- M. Reading, A. Lacey and D. Price, Modulated Temperature Differential Scanning Calorimetry; Theory and Practice of Modulated Temperature Scanning Calorimetry, D. H. Mike Reading, Ed., 2006, pp. 1-80.
- ASTM E1269 Standard Test Method for Determining Specific Heat Capacity by Differential Scanning Calorimetry, West Conshohocken, PA: ASTM, pp. 1-6.
- R. Sabbah, “Reference Materials for Calorimetry and Differential Thermal Analysis,” Thermochimica Acta, vol. 331, pp. 93-204, 1999.
- I. C. B. a. W. Ditmars, “Enthalpy and Heat Capacity Standard Reference Material: Synthetic Sapphire from 10 to 2250K,” Journal of Research of the National Bureau of Standards, vol. 87, no. 2, pp. 159-163, March-April 1982.
- “Sapphire Specific Heat Capacity Literature Values,” [Online]. Available: https://www.tainstruments.com/pdf/literature/TN8.
pdf. - R. Danley, “TA271: Improved DSC Performance Using TZero Technology,” International Labmate, vol. XXVI, no. II.
- L. Waguespack, R. Blaine, “TA273: Design of a New DSC Cell with Tzero Technology”.
- A. International, “ASTM E2716 Standard Test Method for Determining Specific Heat Capacity by Sinusoidal Modulated Temperature Differential Scanning Calorimetry, 2009. [Online].
- Levchenko Andre PhD, Accurate heat capacity measurements on a range of materials using direct Cp method, Orlando, Fl, 2016.
- R. B. Cassel, “How Tzero™ Technology Improves DSC Performance – Part III: The Measurement of Specific Heat Capacity,” TA Instruments, New Castle DE.
- Len Thomas, “Modulated DSC Paper #9 – Measurement of Accurate Heat Capacity Values”.
- Len Thomas, “Making Accurate DSC and MDSC Specific Heat Capacity Measurements with Q1000 Tzero DSC”.
- Y. Takahashi, “Heat Capacity of Gold from 80 to 1000K,” Thermochimica Acta, vol. 109, no. 1, pp. 105-109, 15 December 1986.
- ASTM, ASTM E2716 – Standard Test Method for Determining Specific Heat Capacityu by Sinusoidal Modulated Temperature Differential Scanning Calorimetry, ASTM, 2009.
Acknowledgments
For more information or to request a product quote, please visit www.tainstruments.com to locate your local sales office information.
This paper was written by James Browne.
TA Instruments, TA, Discovery, TZero, MDSC, and TRIOS are registered trademarks of Waters Corporation LLC.
Click here to download the printable version of this application note.

