Keywords: differential scanning calorimetry, glass transition, modulated differential scanning calorimetry, pharmaceuticals, thermogravimetry
TA303
Background
One of the latest technologies for controlling the release rate of a drug or protein within the body is through the use of biodegradable polymer microspheres that have an average size of 50 – 200 μm. This small size permits the microspheres to be inhaled as part of a spray or to be injected as they are held in suspension in a solution.
The actual release rate is controlled by a variety of factors, including:
- Size and permeability of the particle
- Distribution of the drug within the particle
- Form of the drug: amorphous or crystalline
- Type of crystalline structure (polymorphs)
- Concentration of drug within the polymer microsphere
The combination of differential scanning calorimetry (DSC), modulated DSC™ (MDSC™) and thermogravimetry (TGA) is used to measure the latter three factors on a drug delivery system using polymer microspheres.
Details
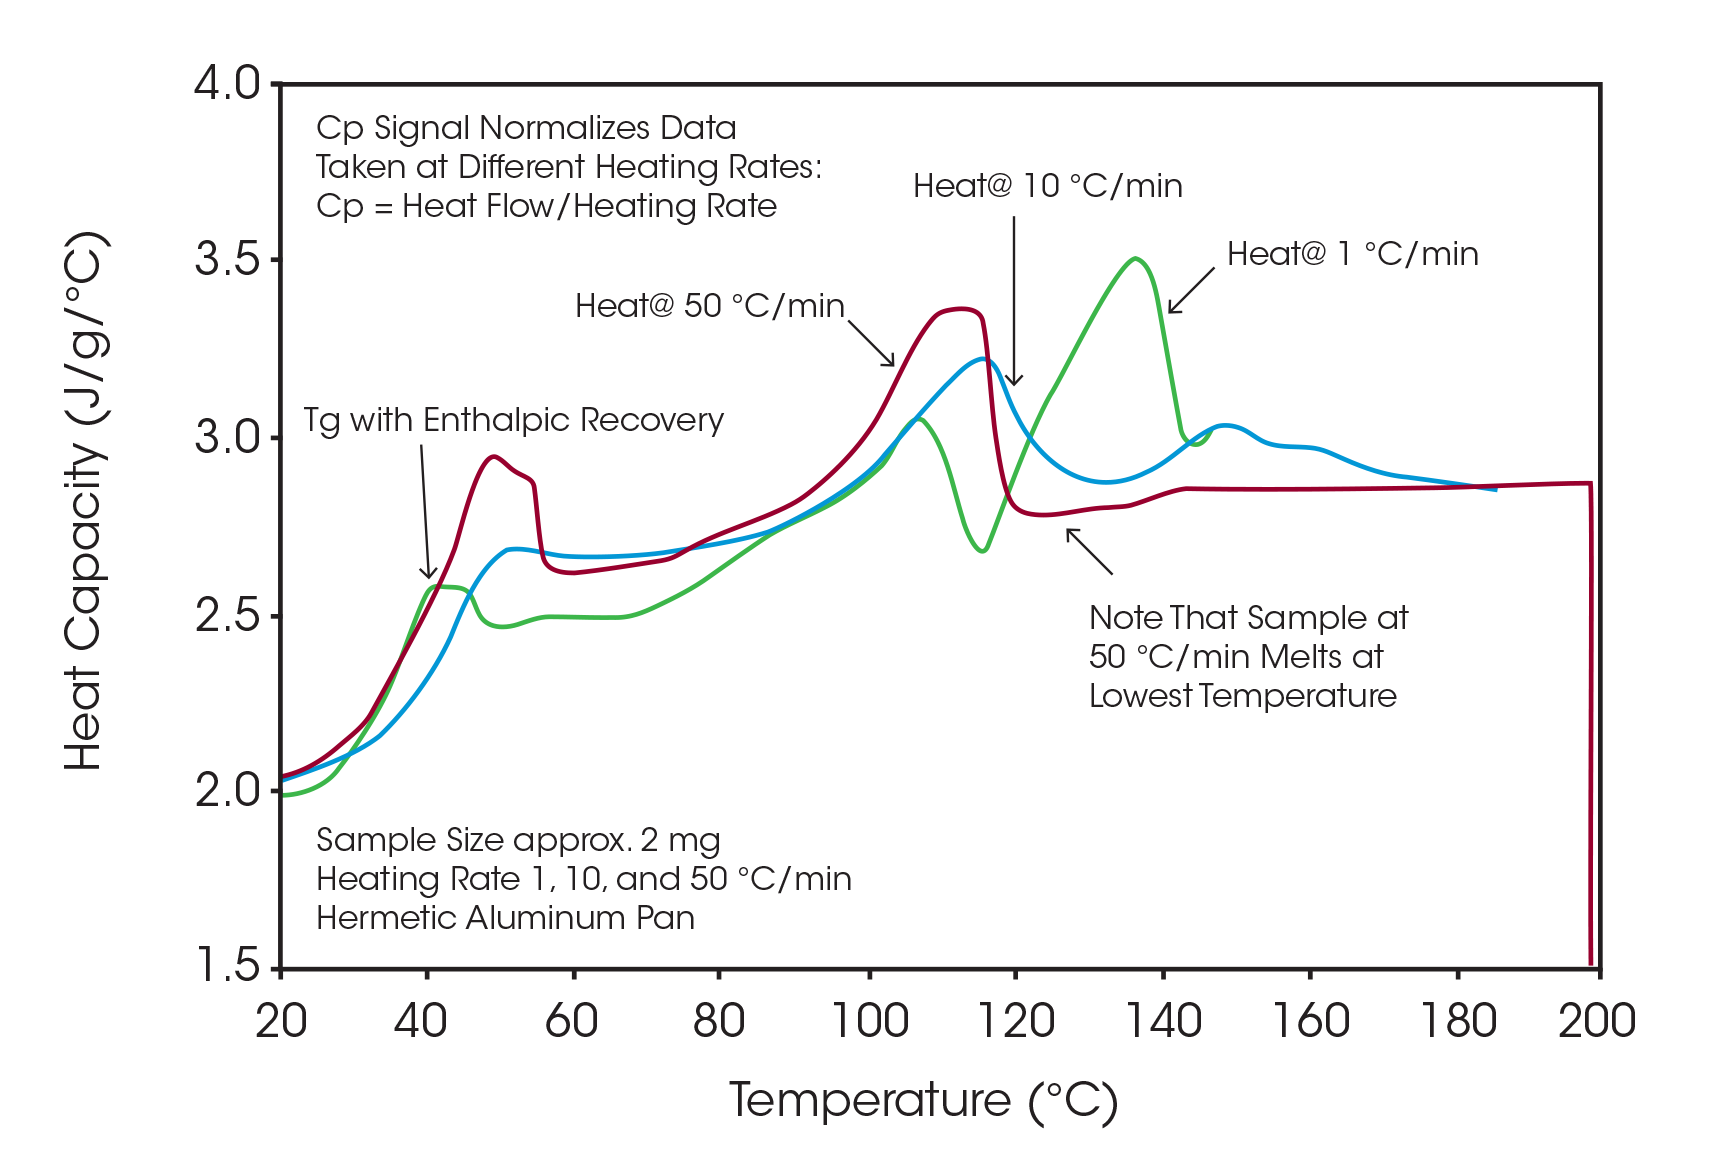
It has been shown that multiple heating rates should be used to determine the tendency of the crystalline drug to undergo polymorphic transformations as the sample is heated (1). Figure 1 shows a plot of heat capacity versus temperature for three samples of drug microspheres heated at 1, 10 and 50 °C/min. At the lower heating rates, multiple melting peaks are observed in the range from 70 to 180 °C while the 50 °C/min rate produces predominantly a single peak. The step change observed in all runs between 30 and 60 °C is due to the glass transitions of the polymer and amorphous drug, which are completely miscible.
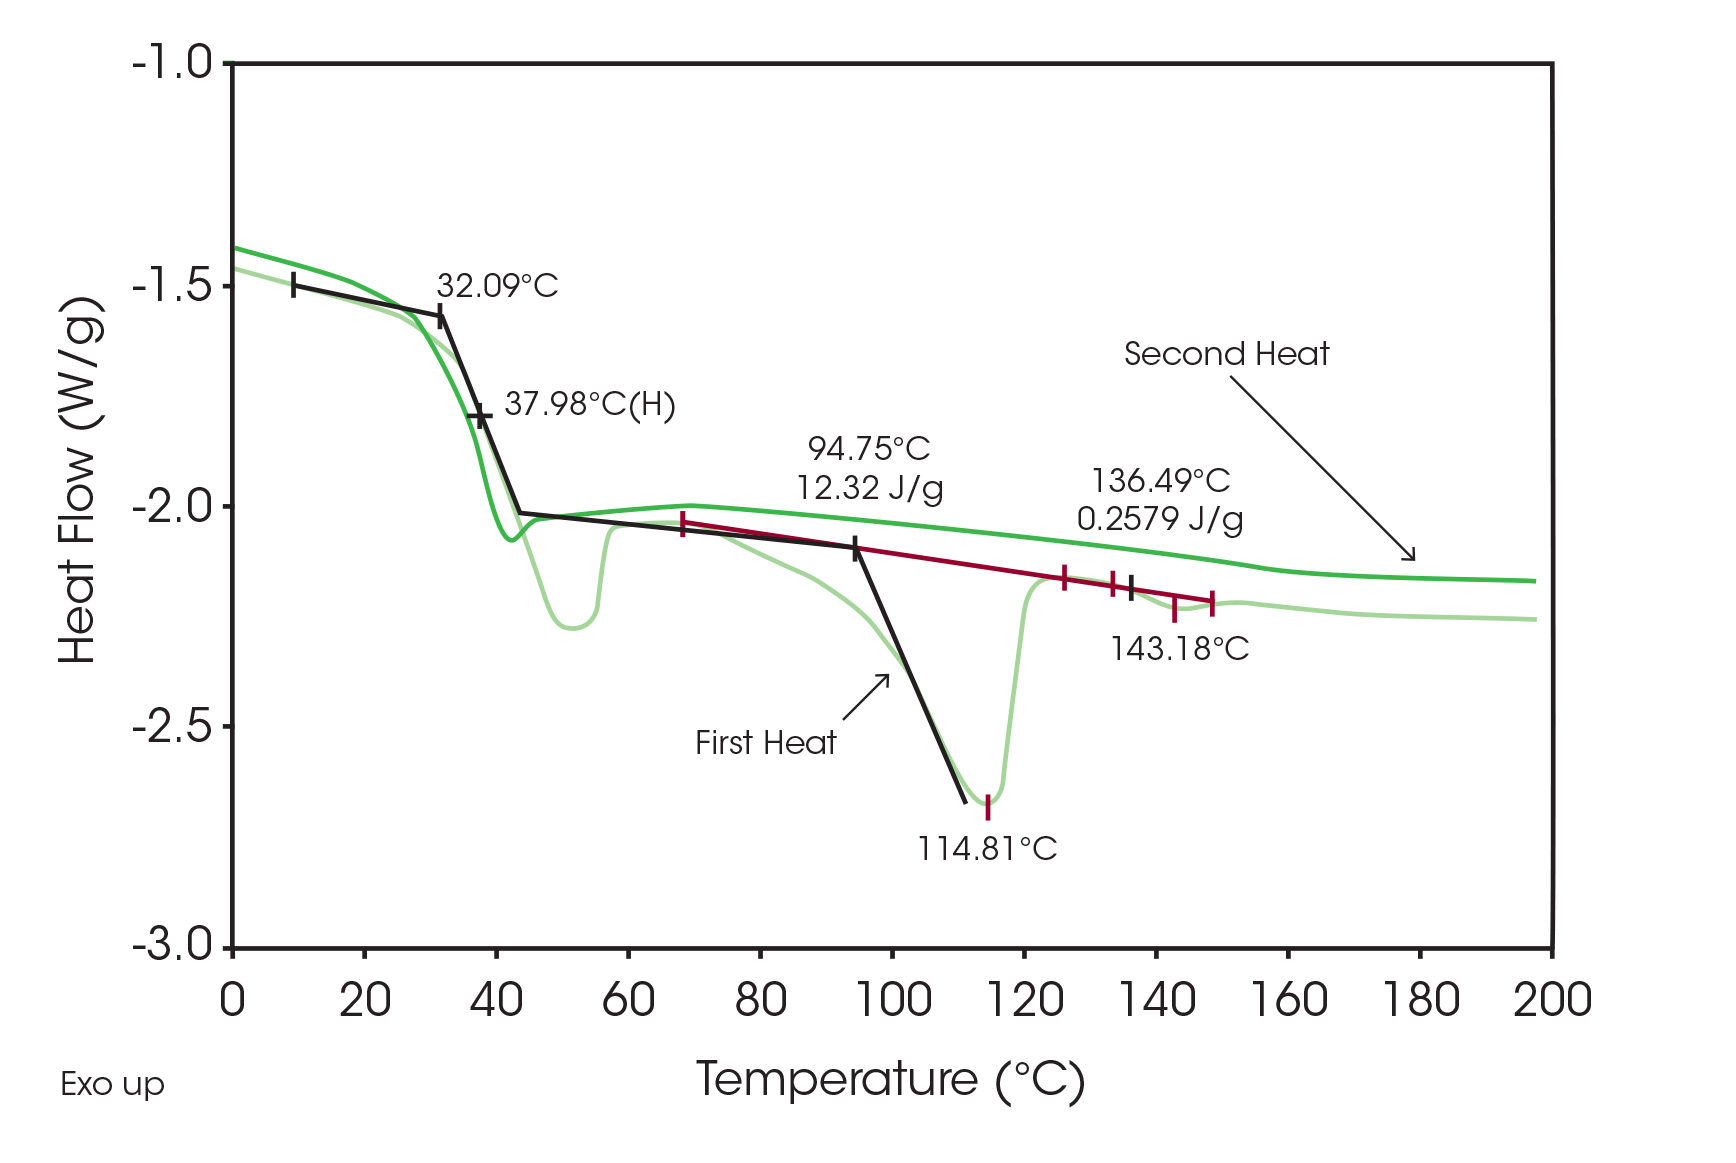
Quantitative results for determining the amount of crystalline drug are shown in Figure 2 run at 50 °C/min to eliminate or minimize polymorphic transformation. Since the pure drug has a heat fusion of 98 J/g (Figure 3), the total area of 12.6 J/g indicates that there is about 13 % crystalline drug in the sample. Note that the second heat of the same sample does not show any melting peak indicating that the drug is now only present in the amorphous form.
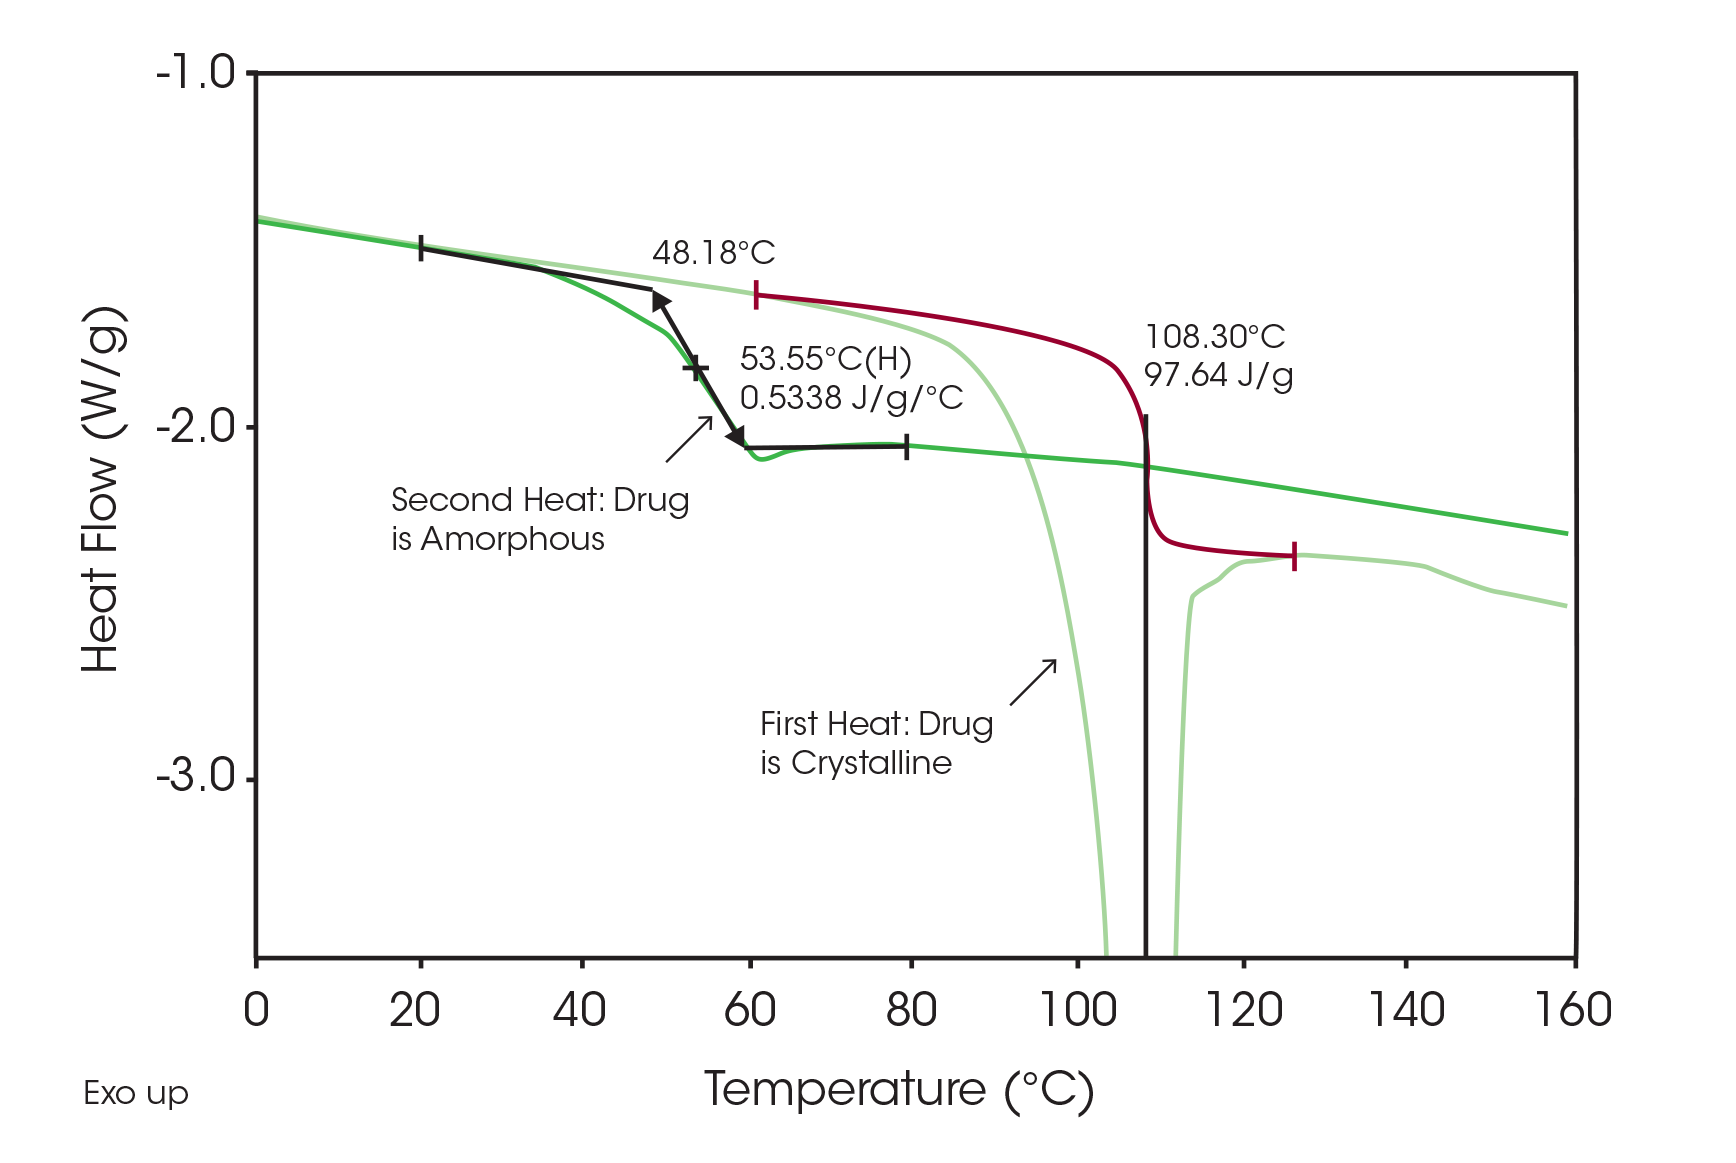
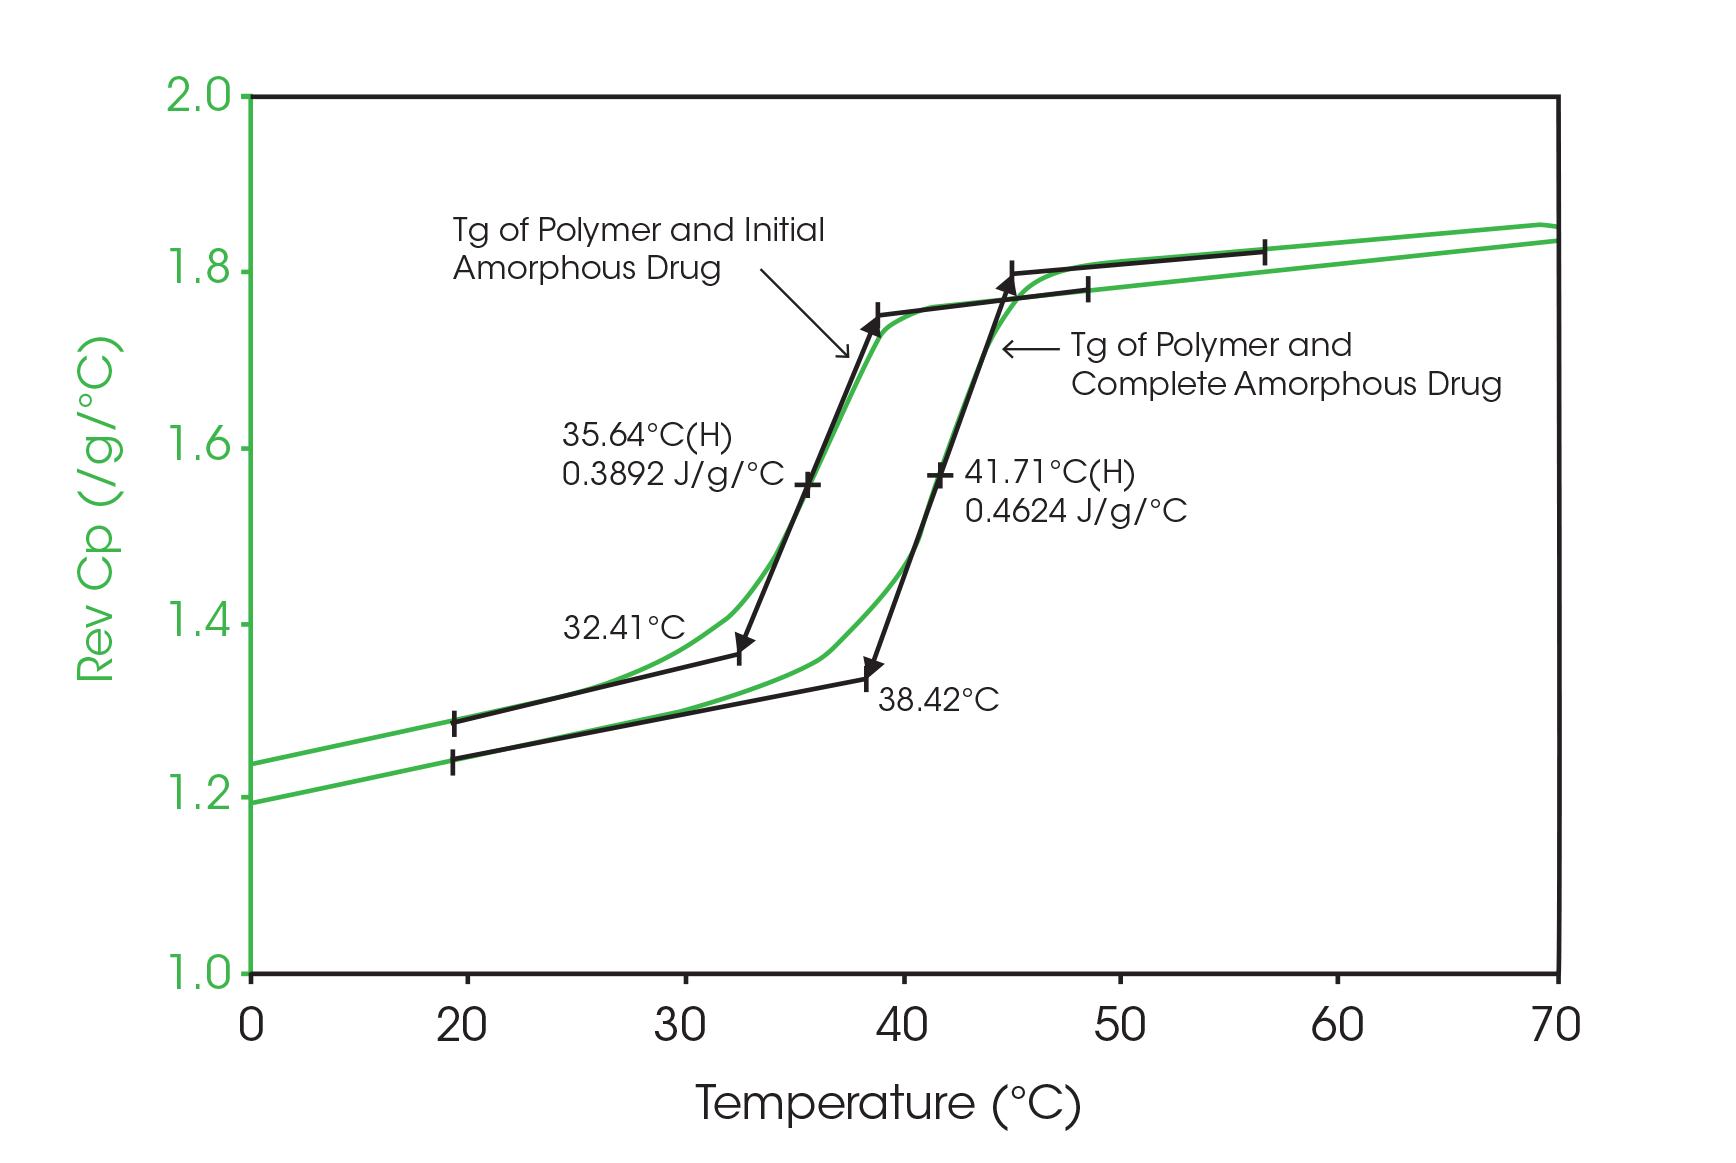
Since the sample changes from a crystalline to an amorphous structure once it is heated, there should be a corresponding increase in the change in heat capacity at the glass transition in the second heat. This can be seen in Figure 4, a comparison of glass transitions from the first and second heats obtained by modulated DSC. Using a value of 0.53 J/g °C for the change in Cp due to a 100 % amorphous drug (Figure 3), an increase of 13 % ([0.46 – 0.39] 100 %/ 0.53) in the amorphous content is seen in the second versus first heats. This agrees with the previous measurement of 13%, which used crystalline peak areas.
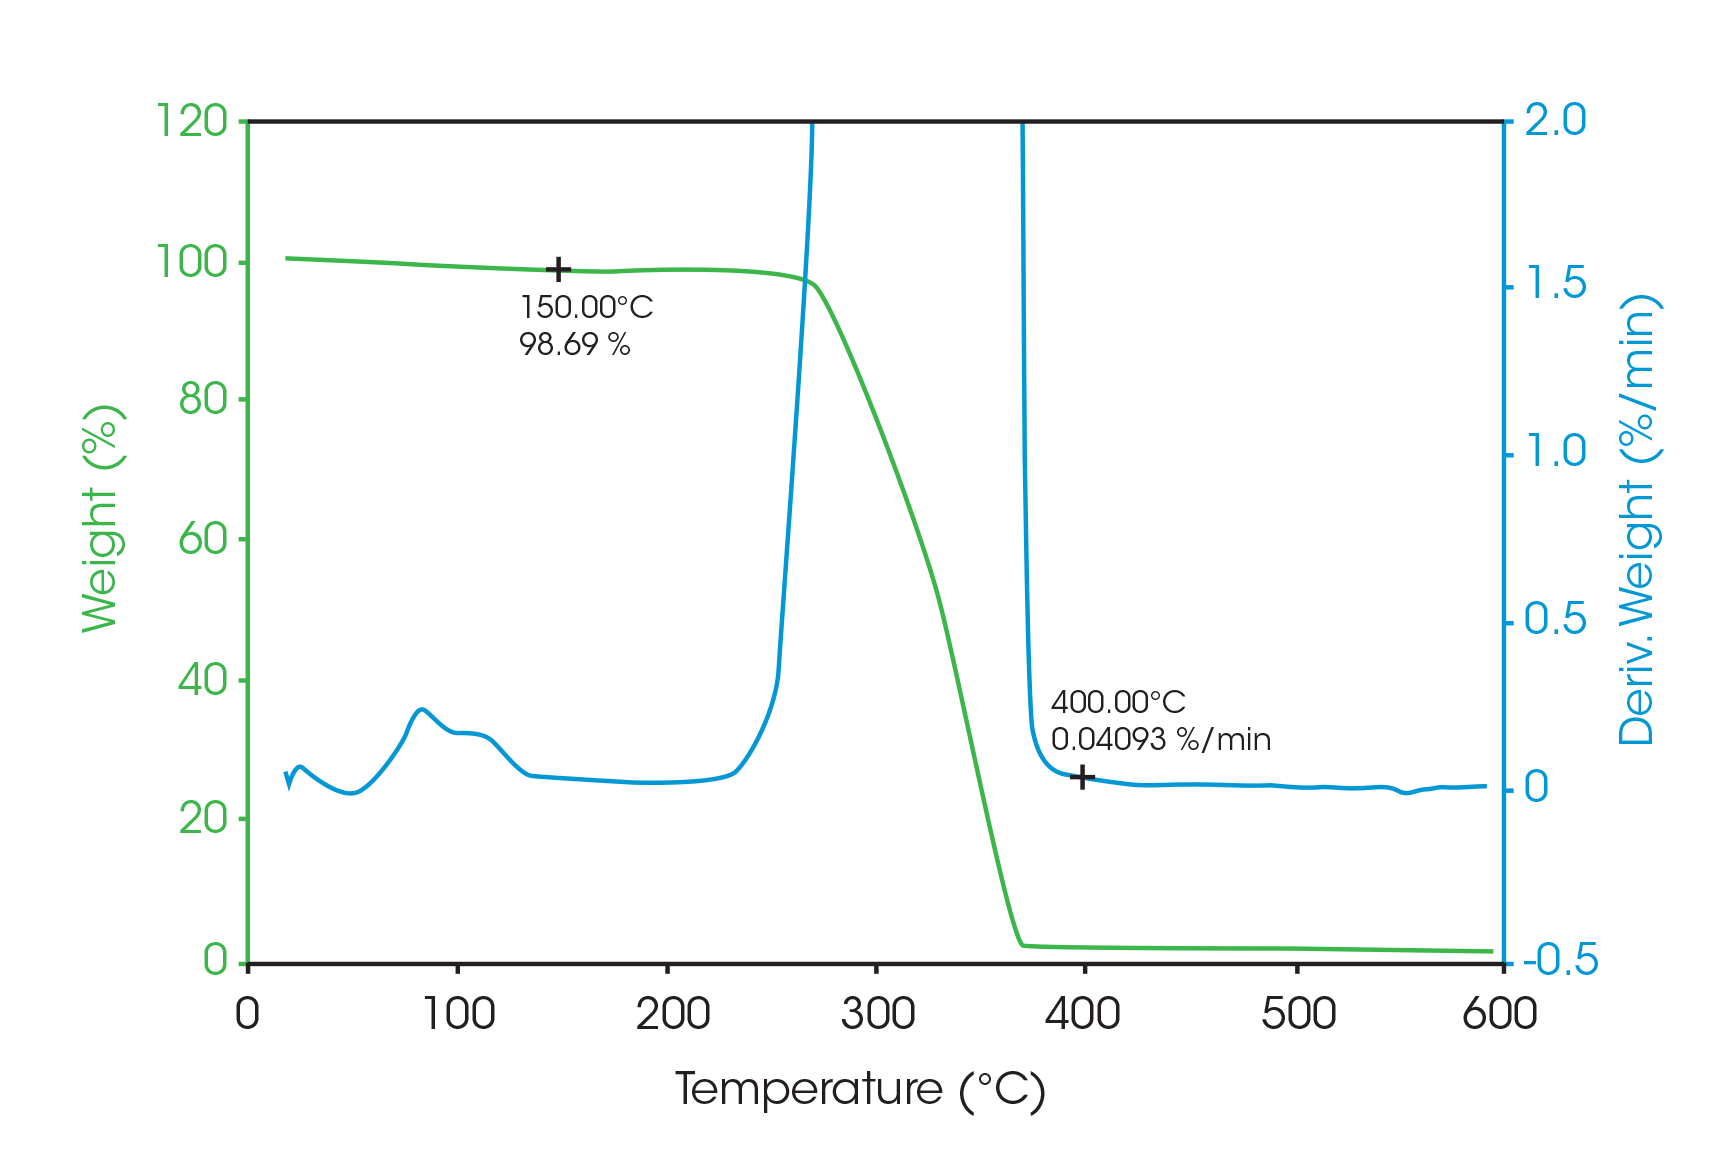
Since the amorphous drug is completely miscible with the polymer microspheres, it is not possible to measure the total amount of drug in the microspheres from the size of the glass transition. Therefore, it is necessary to see if the decomposition of the drug microspheres is sufficiently different from the placebo microspheres in order to determine the drug concentration. Figure 5 shows TGA data on the placebo microspheres run at 10 °C/min.
The value of 98.7 weight percent at 150 °C and the rate of weight loss of 0.04 %/min at 400 °C are compared with the drug microsphere data seen in Figure 6. Since the drug is a monohydrate with 5 % water, the amount of crystalline monohydrate can be calculated from the difference in mass loss due to evolution of water at 150 °C.
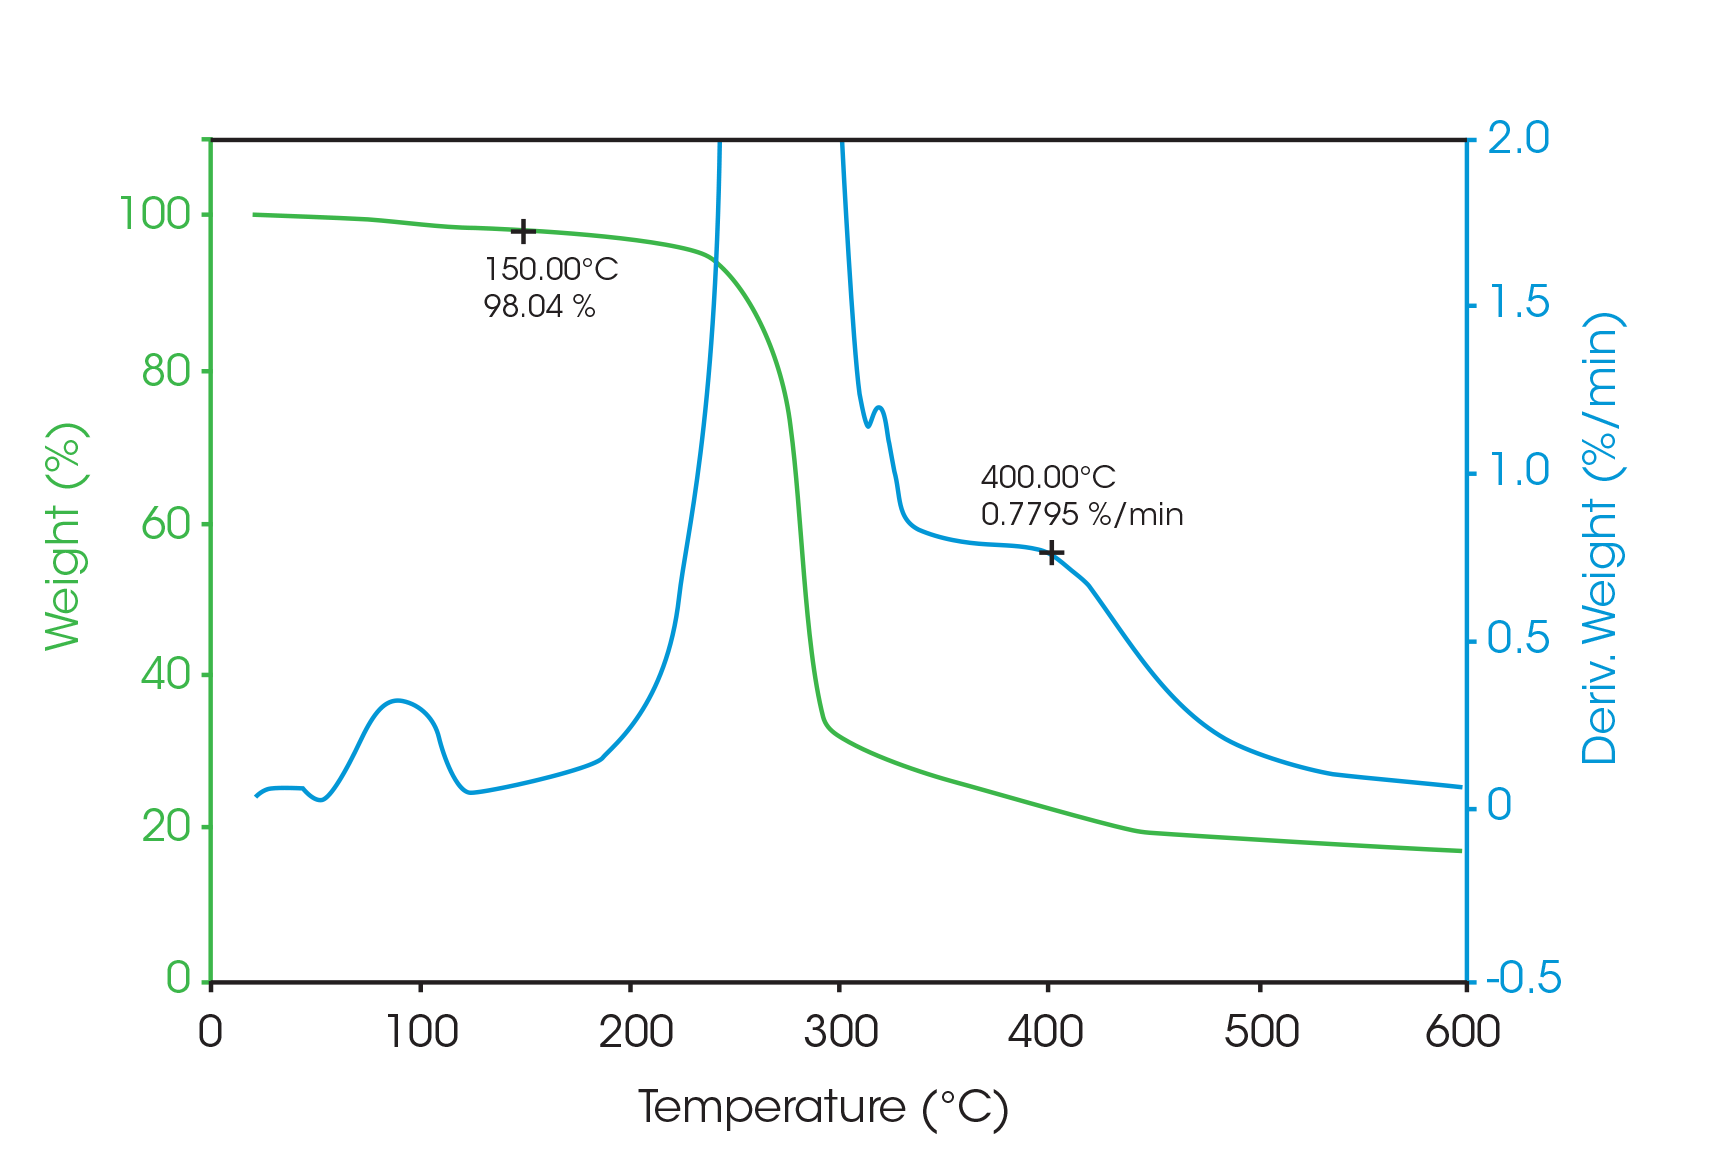
Just as with the DSC and MDSC measurements, a concentration of 13 % crystalline drug is found.
Essentially the entire rate of weight loss at 400 °C is due to the drug and not the polymer microspheres. Therefore, the percent drug can be calculated by the ratio of the rate of weight losses for a 100 % drug sample (2.24 %/min; not shown) and the drug microspheres with only a small correction (0.04) due to the polymer.


Summary
DSC, MDSC and TGA data all show that the drug microspheres contain approximately 13 % crystalline drug monohydrate. TGA data shows the total drug concentration to be 30 %, which means that the drug microspheres contain 17 % amorphous drug.
Acknowledgments
This application note was written by Leonard C. Thomas at TA Instruments.
For more information or to request a product quote, please visit www.tainstruments.com to locate your local sales office information.
Modulated DSC and MDSC are trademarks of Waters Technologies Corporation.
Click here to download the printable version of this application note.
References
- L. C. Thomas, “Characterization of Polymorphic Transitions in a Pharmaceutical Drug by DSC and MDSC™”, Proceedings of the 30th Conference of the North American Thermal Analysis Society, 2002, pp. 308-312.

