Keywords: Differential Scanning Calorimetry, Monoclonal Antibodies (mAb), Antibody Drug Products, Short Term Thermal Stability, High Throughput, Formulation Development
MC178
Abstract
Short-term thermal stability testing is crucial to ensure product quality and support regulatory approval of antibody drug products. The TA Instruments™ RS-DSC (Rapid Screening-Differential Scanning Calorimeter) offers thermal stability screening of buffer formulations and protein sequence modifications. The instrument provides a platform for simultaneous analysis of up to 24 samples at formulation strength concentrations. This application note provides data illustrating the utility of the TA Instruments RS-DSC to enable the short-term thermal stability screening of buffers and analysis of protein modifications for antibody drug product development.
Introduction
Understanding the structure-function relationship of antibodies is fundamental for comprehending how functional variations arise, whether due to alterations in solution conditions, or sequence modifications. Antibody structure characterization is an important step in delineating these differences. Additionally, assessing biomolecule stability under varying thermal conditions is crucial for ensuring the quality and regulatory approval of these drug products.
Differential Scanning Calorimetry (DSC) is a thermal technique employed to understand antibody structure and evaluate a compound’s resistance to thermal stress. Short-term thermal stability is a critical quality attribute in the evaluation of antibody drug products. It is a key metric employed in candidate selection and pre-formulation, and it is an important parameter in selecting buffer composition, including excipients, buffer salts, detergents, and pH in the development of clinical formulations. Due to the nature of this screening, it is common to have anywhere from tens to hundreds of samples that need to be run and analyzed. Traditional DSC studies are slow, capable of testing one sample at a time and requiring meticulous cleaning between samples for best results. The TA Instruments RS-DSC – a new platform for high-throughput thermal stability testing – redefines the thermal stability testing landscape by simultaneously analyzing 24 samples. Providing quick and comprehensive physicochemical insights through thermal analysis would reduce the cost and time of bringing new drugs to market.
DSC thermograms for antibodies are notably diverse. Some antibodies display a single peak, while others exhibit multiple distinct peaks, or overlapping peaks that manifest as shoulders on a larger unfolding peak. The variety in these thermograms has been suggested to correlate with the flexibility of the hinge region [1]. Studies on multi-domain proteins indicate that these complex and overlapping peaks may result from inter-domain interactions [2]. Advanced DSC studies have even successfully pinpointed the unfolding temperature of individual domains within the heavy chain portion of antibodies [3]. The ultimate goal of these studies is to ascertain thermal stability, as poor stability can significantly impact solubility, leading to aggregation – a common issue in biotherapeutics.

Experiments and Methods
Herceptin™ Trastuzumab was prepared according to package instructions in histidine formulation buffer (18.4 mg/mL trehalose dihydrate, 0.08 mg/mL polysorbate 20, 0.49 mg/mL histidine HCl, 0.32 mg/mL histidine, pH 6.0) at 21 mg/mL and stored at 4 °C until use. For analysis in different buffers, the antibody was buffer exchanged using an Amicon™ Ultra 10kDa molecular weight cut off centrifugal spin filter.
The borate buffer was composed of 50 mM boric acid, 50 mM NaCl, 2 mM EDTA at pH 8.0. PBS, a common working buffer, was composed of Gibco™ DPBS with 1 mM EDTA at pH 7.4. Succinate formulation buffer used for KADCYLA™, an antibody drug conjugate built on the trastuzumab antibody scaffold, was composed of 10 mM sodium succinate, 6% w/v sucrose, pH 5.0.
Antibody samples for mutation screening were engineered and supplied by Cell Signaling Technology and formulated in PBS (pH 7.4) at 20 mg/mL for analysis.
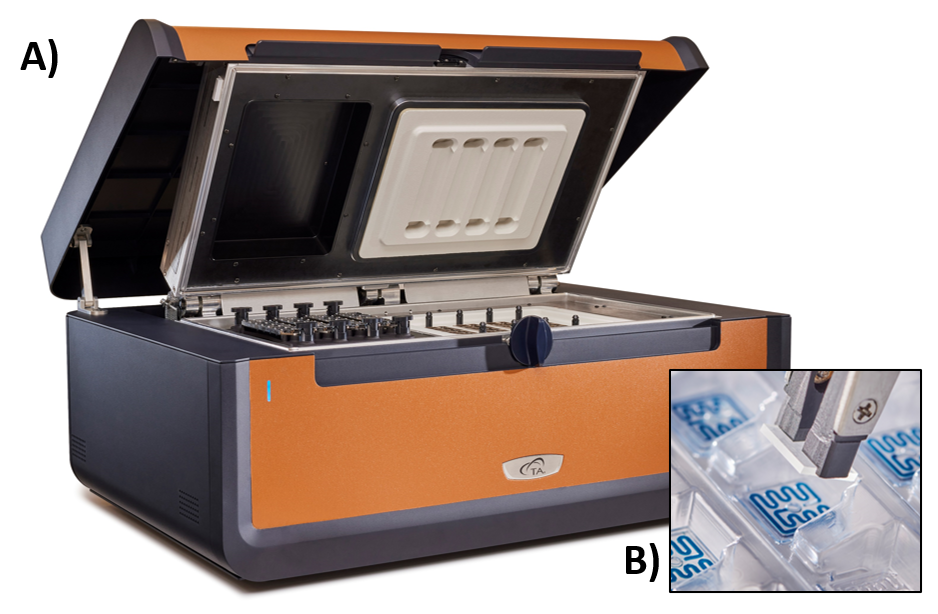
Protein sample is pipetted directly into the disposable glass microfluidic chips (MFCs) with a channel that is designed to contain 11 μL of liquid sample. After addition of protein solution, the microfluidic chips are sealed with adhesive-backed glass coverslips to contain the sample during heating to 100 °C. Assembled MFCs are placed onto the sample side of each twin calorimeter in the TA Instruments RS-DSC (Figure 1). A reusable polyetheretherketone (PEEK) chip remains on the reference side. Up to 24 samples may be run simultaneously with a temperature range of 20 – 100 °C and pre-set scan rates of 1 or 2 °C/min. By eliminating the need for cleaning between scans, up to 96 samples can be run in a typical workday.
The TA Instruments RS-DSC, operated with RS-DSCRun software, was set to equilibrate at the initial temperature for 1800 s prior to the start of each scan. Each sample was run in triplicate and scanned at 1 or 2 °C/min across the full temperature range (20 to 100 °C).
To ensure accuracy across all 24 calorimeters, the instrument was first calibrated and validated with dipalmitoylphosphatidylcholine (DPPC), with an accepted Tmax shift of less than 0.2 °C from the expected literature value [4].
Data was processed using NanoAnalyze™ Software (v4.0.0). New features in NanoAnalyze Software allow for automated detection of the denaturation midpoint temperature (Tmax) and comparison of up to 96 thermograms. NanoAnalyze Software v4.0.0 includes a new software algorithm, RapidDSC, that will automatically detect Tmax in DSC thermograms by searching for peaks across the specified range of data. An automatic baseline is applied across the peak and used to further refine the Tmax temperature for improved accuracy. Automatic peak detection features display up to three peaks across the temperature range of interest. The automation features can be easily edited in the “Baseline and Tmax Editor” pop out window to narrow the window of detection, select a specific range for peak identification, or adjust the automated baseline and Tmax. Tabulated data from Tmax automation can be exported for easy comparison or is viewable in the Tmax visualization and overlay tabs in RapidDSC.
Manual analysis in NanoAnalyze Software was performed for comparison to the automated Tmax detected using RapidDSC. For manual comparison to the automated peak detection features, each individual scan was normalized to molar heat capacity using the moles of protein in the active cell volume. A fourth or fifth order polynomial was applied as the baseline to the normalized data. Tmax was estimated visually and compared to the automated Tmax output for each transition. Further analysis of the thermograms may be completed by fitting with models as described in “NanoDSC: What to Consider when Choosing a Baseline and Model” [5]. For the analysis of antibody stability, the use of Voigt models is recommended.
Results and Discussion
Formulation Buffer Screening
Thermal stability is a critical quality attribute of a biologic drug product. DSC is the primary tool implemented to characterize the effect of the solution environment on protein stability. Protein stability is influenced by a range of variables in the solution environment, such as pH, buffer type, ionic strength, excipients, and detergents. These effects can be observed as a small shift in the Tmax or in larger changes of up to tens of degrees [6]. Designed with the needs of the biopharmaceutical industry in mind, the parallel throughput of the TA Instruments RS-DSC facilitates screening of solution conditions for biologic protein drugs, improving the time to decision over
traditional microcalorimetric methods.
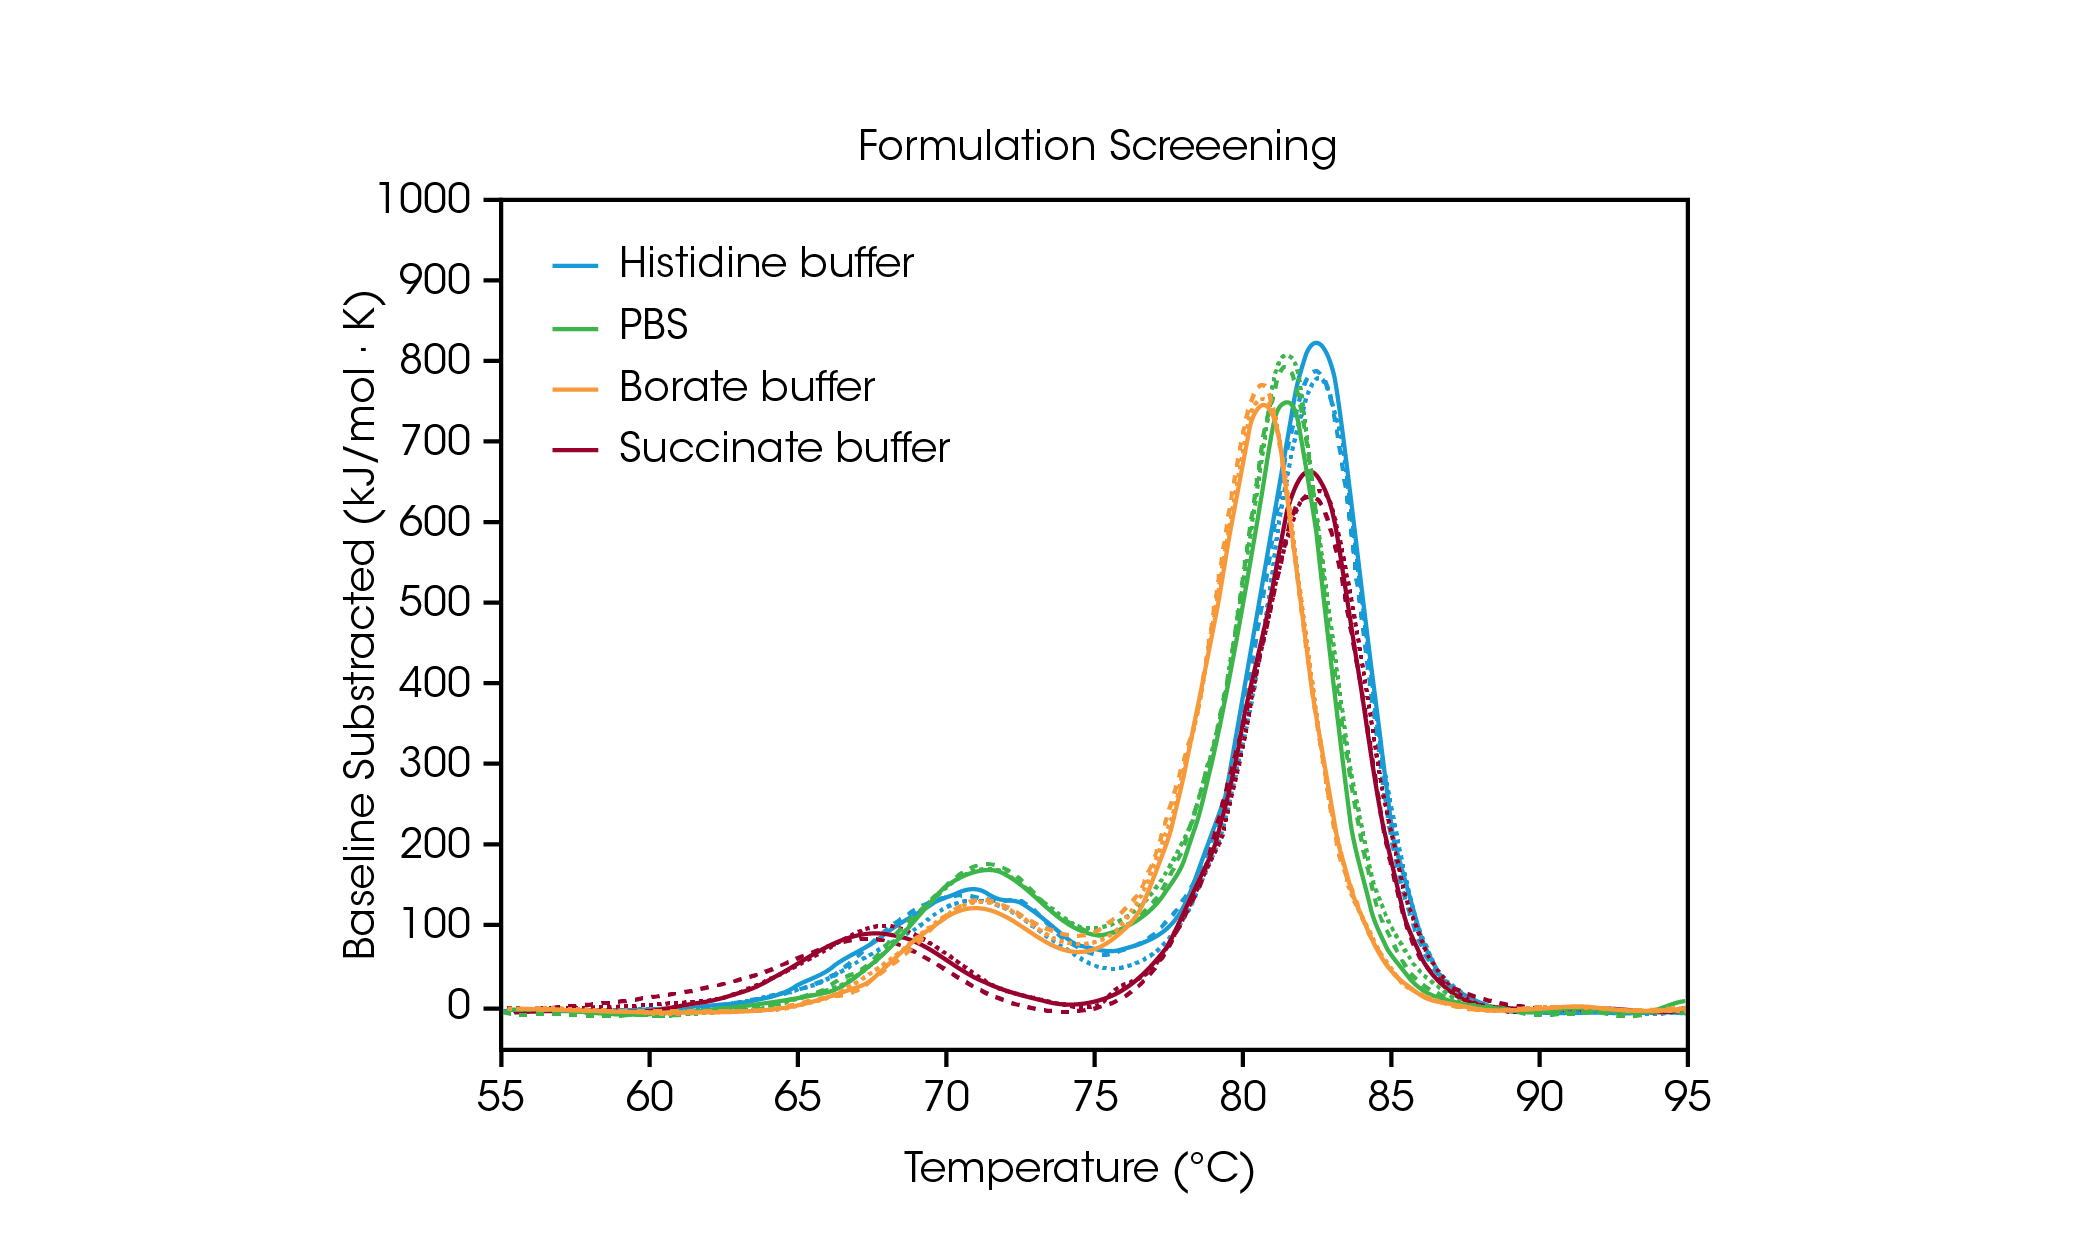
To demonstrate how the data from formulation screening can aid in selection of buffer components, we analyzed triplicate data from the antibody Herceptin Trastuzumab in four common buffer conditions (Figure 2 and Table 1). For this study, antibodies in varying formulation buffers were screened at ~ 20 mg/mL; however, the TA Instruments RS-DSC is uniquely designed to handle formulation strength protein concentrations up to 330+ mg/mL, allowing for thermal stability testing of undiluted drug product. For further information, see TA Instruments’ application note “Rapid Thermal Stability Screening of High Concentration Biologic Drugs” [7].

Table 1. Transition temperatures for formulation screen. Mean ± SD, n = 3.
| Buffer | Tmax,1 (°C) | Tmax,2 (°C) |
|---|---|---|
| Histidine | 70.76 ± 0.38 | 82.66 ± 0.09 |
| Borate | 70.84 ± 0.08 | 80.69 ± 0.02 |
| PBS | 71.12 ± 0.06 | 81.48 ± 0.02 |
| Succinate | 67.71 ± 0.22 | 82.66 ± 0.08 |
The first unfolding event, corresponding to unfolding of the CH2 domain, is not significantly impacted by the histidine, borate, or PBS buffers [8]. However, the succinate buffer destabilizes the CH2 domain resulting in lowering the onset of unfolding and Tmax,1 by about 3 °C. With respect to the main transition reflecting the Fab and CH3 unfolding events, the histidine and succinate buffers are the most stabilizing, with a Tmax,2 of 82.66 °C. The main transition is least stable in the borate buffer with a Tmax,2 of 80.69 °C. Unsurprisingly, the most stabilizing buffer formulation for trastuzumab in this sample set is the histidine buffer used for final formulation of the approved drug product.
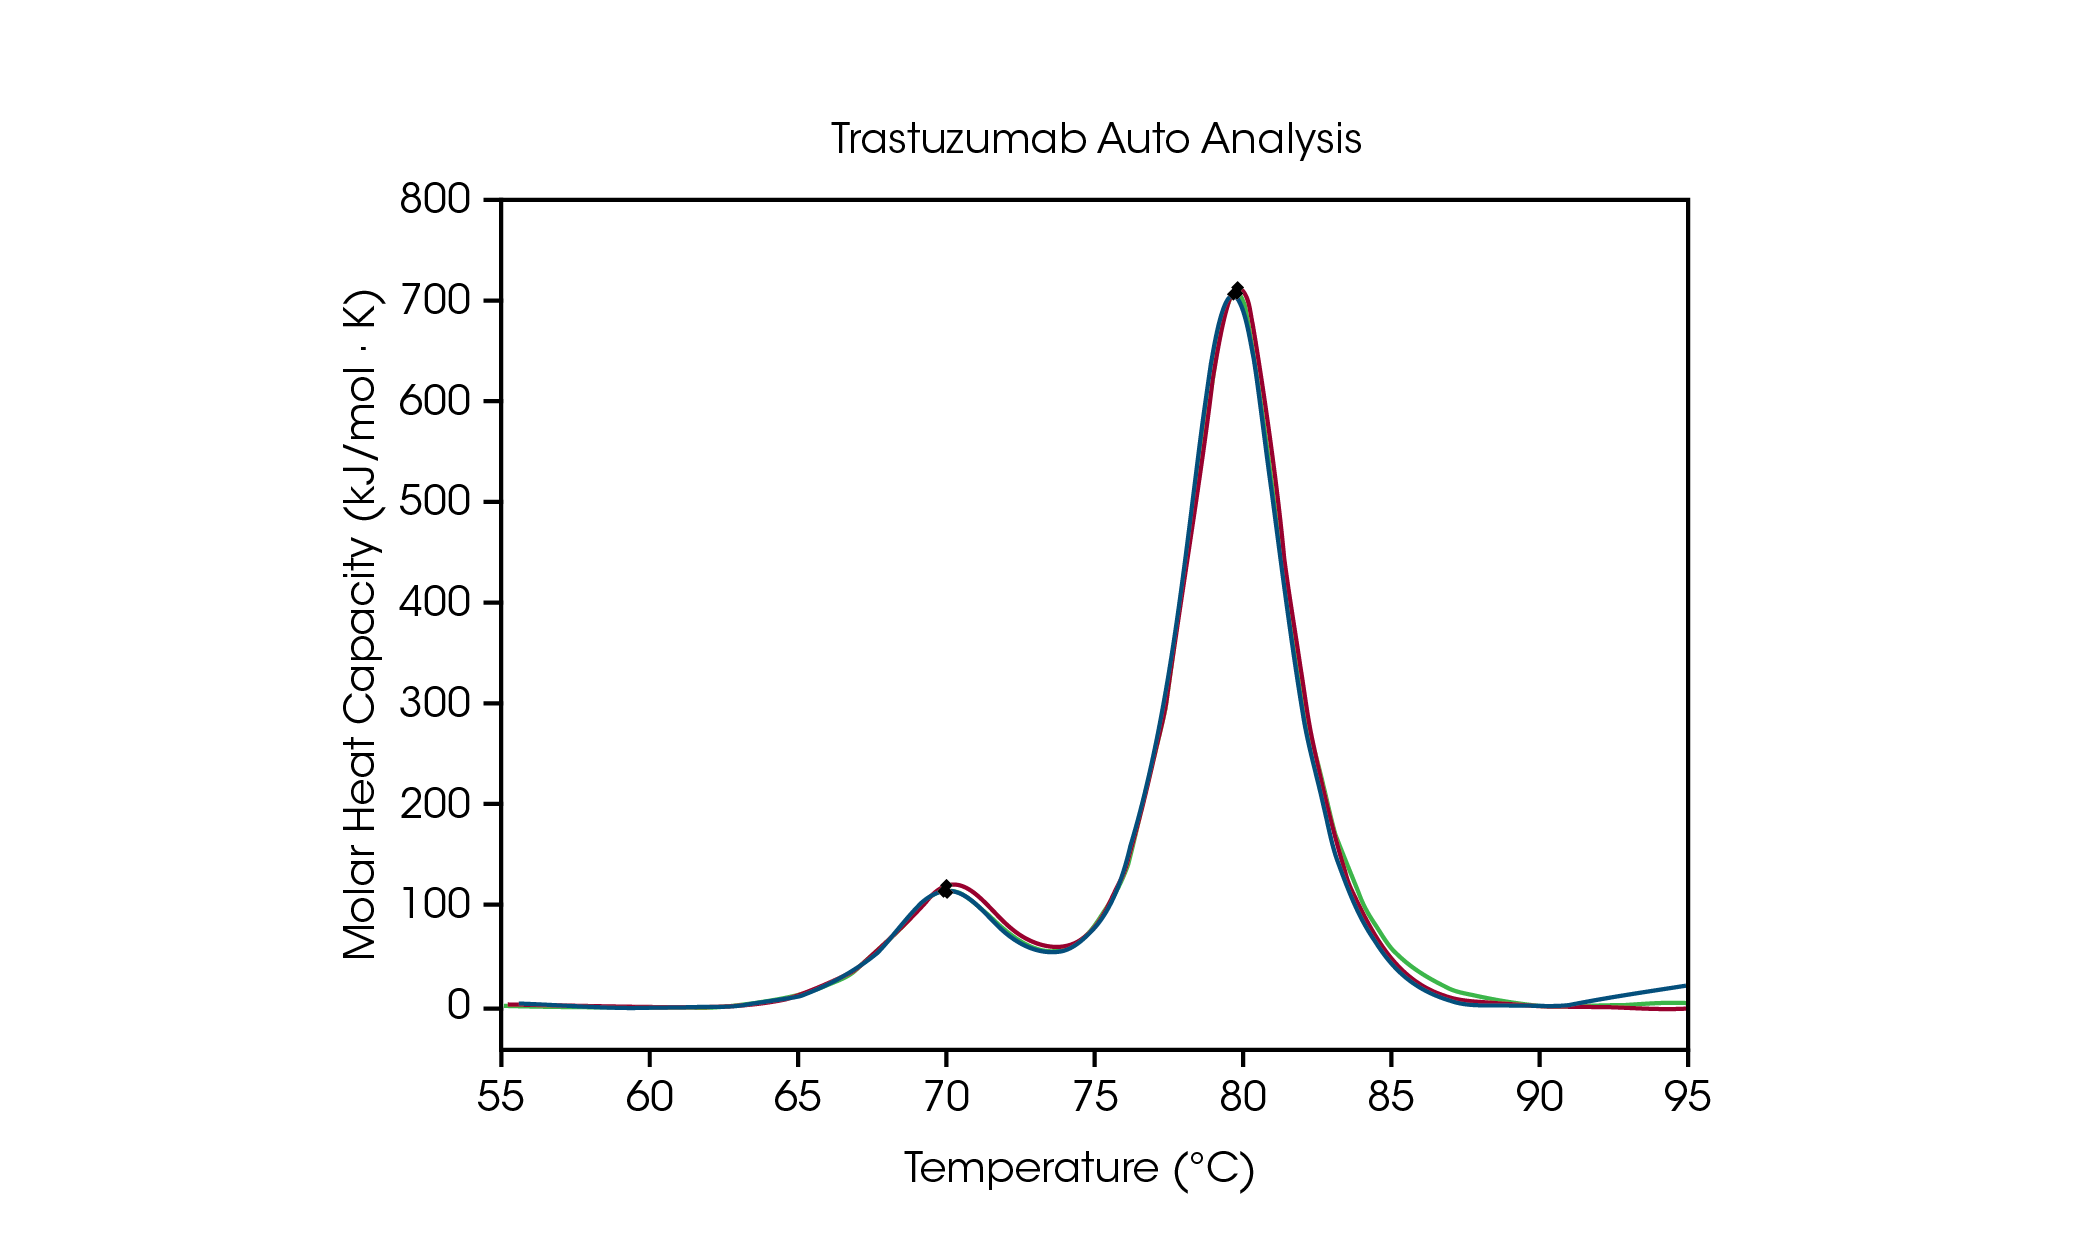
To facilitate data analysis of formulation screening, automated Tmax detection in NanoAnalyze Software allows for accurate detection of up to three transitions in protein stability screens. To demonstrate the accuracy of the peak picking algorithm, auto Tmax,1 and Tmax,2 for trastuzumab at 50 mg/mL in histidine formulation buffer is compared to manual peak picking and is outlined in Figure 3 and Table 2. For automated analysis, two peaks were detected after applying a fourth order baseline polynomial using the auto startup hook detection feature, which does not require specification of the temperature range of interest.

Table 2. Comparison between automated and manual Tmax detection for trastuzumab.
| Sample | Auto Tmax,1 (°C) | Manual Tmax,1 (°C) | Auto Tmax,2 (°C) | Manual Tmax,2 (°C) |
|---|---|---|---|---|
| Replicate 1 | 71.93 | 72.04 | 82.92 | 82.88 |
| Replicate 2 | 71.81 | 71.93 | 82.76 | 82.75 |
| Replicate 3 | 71.93 | 71.97 | 82.90 | 82.83 |
| Average | 71.89 ± 0.07 | 71.98 ± 0.06 | 82.86 ± 0.09 | 82.82 ± 0.07 |
The CH2 domain unfolding has an automated Tmax,1 of 71.89 °C compared to 71.98 °C for manual peak analysis. The main transition has an automated Tmax,2 of 82.86 °C compared to 82.82 °C for manual peak analysis. Excellent reproducibility for trastuzumab is observed. When tested in triplicate, the Tmax of both peaks is observed to be within the instrument accuracy limits of ± 0.2 °C, using both manual and automated peak analysis. Visual inspection is always recommended to ensure a complete understanding of the data. This data set demonstrates that the automated DSC analysis features provide accurate detection of Tmax in multi-transition thermograms.
Screening of sequence modifications
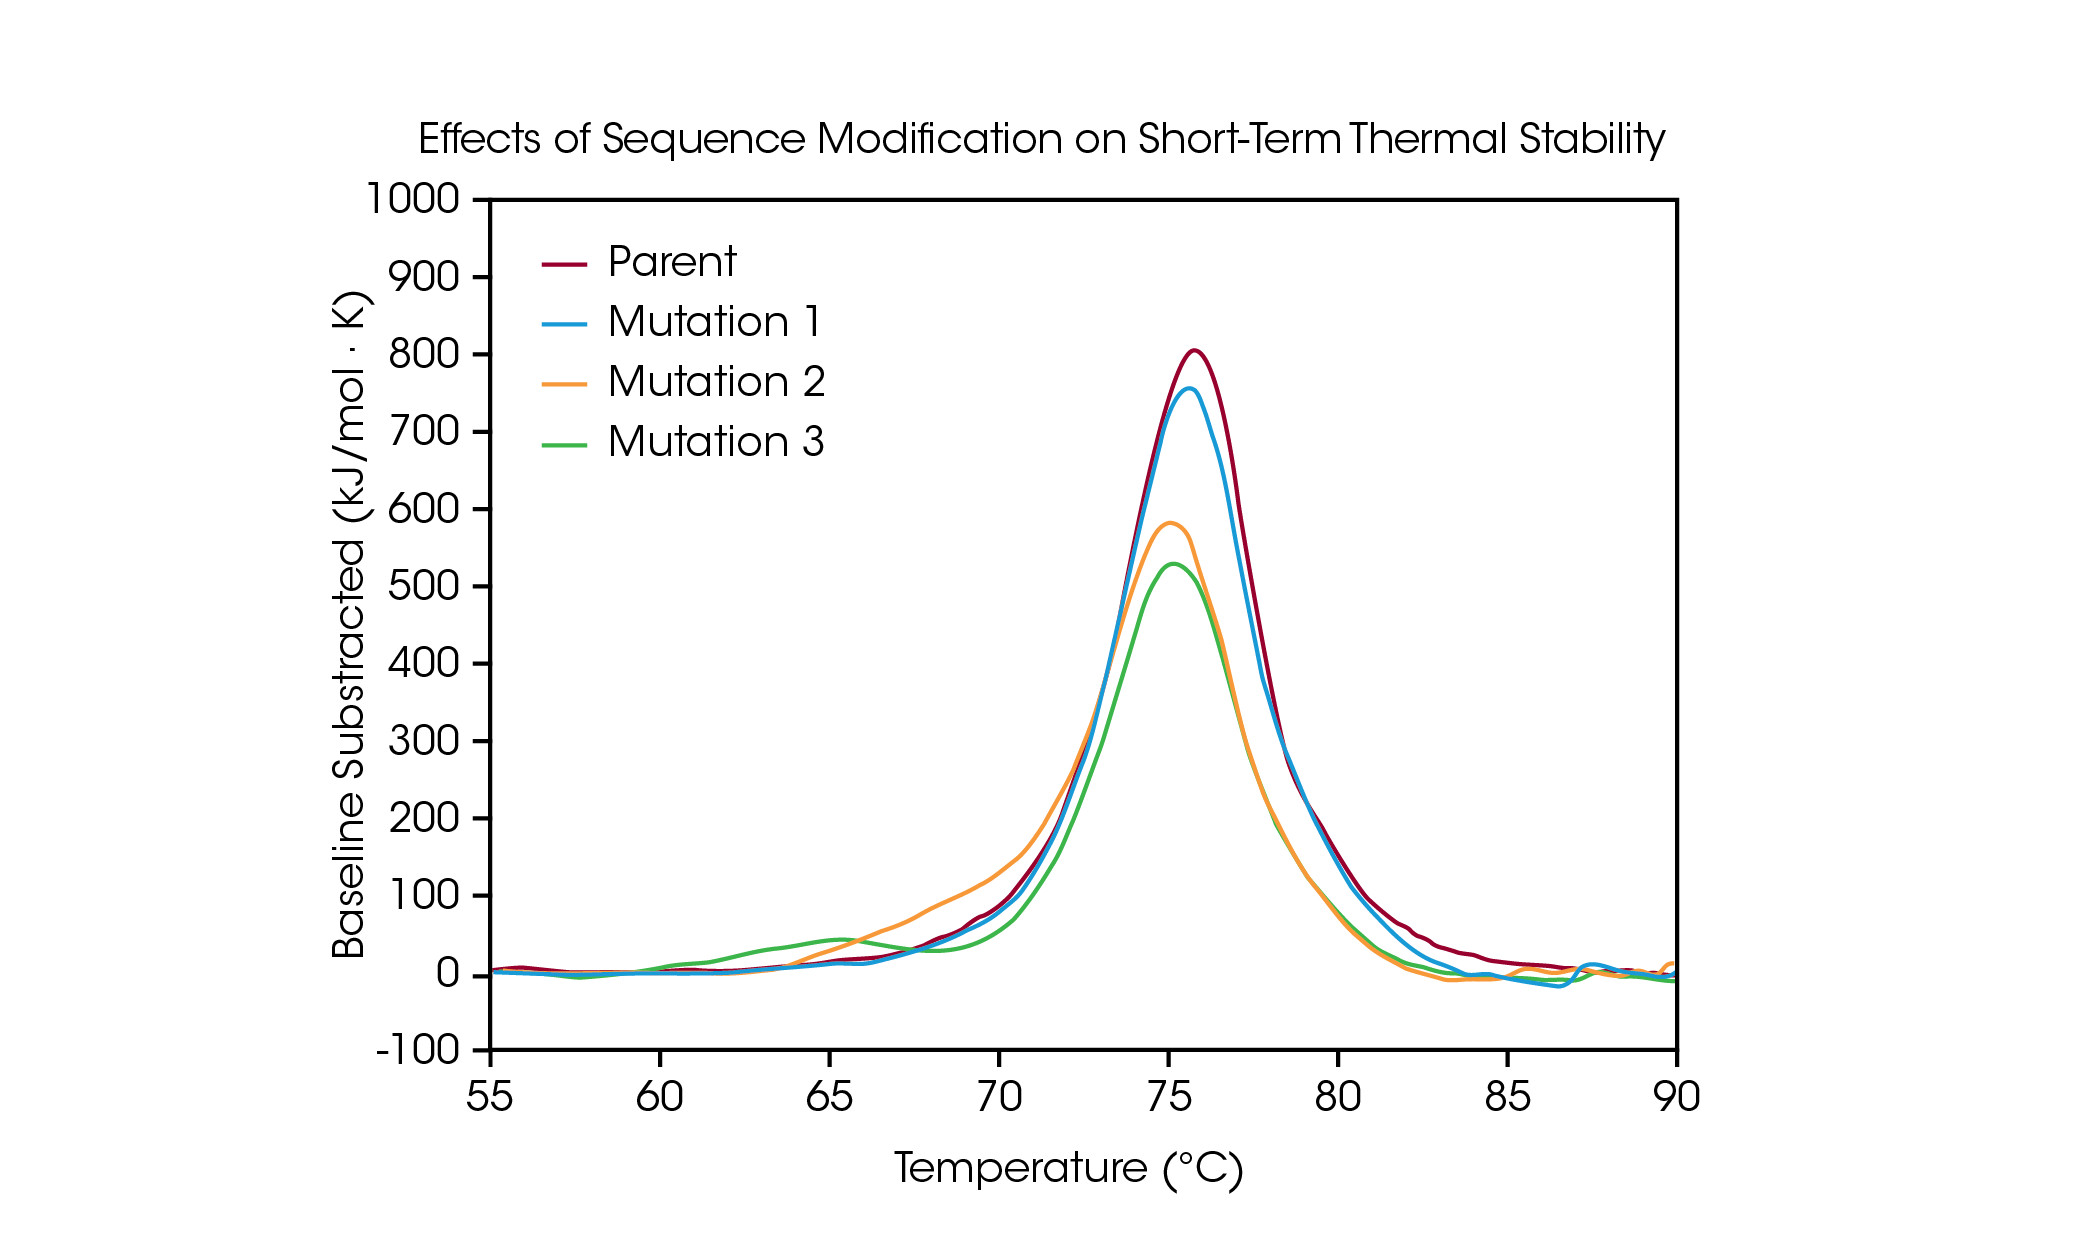
Protein mutations are a common strategy for optimizing protein structure and function, and even single amino acid modifications can have a measurable effect on overall protein stability. DSC is used to understand the impact of a mutation on the thermal stability of a protein and can help guide decision making in the biologic drug development pipeline. To demonstrate the types of effects a sequence modification can have on stability, a small panel of engineered antibodies were screened for changes in thermal unfolding resulting from a single amino acid mutation in the protein sequence (Figure 4 and Table 3).
In the parent antibody, unfolding of the CH2, Fab, and CH3 domains are contained within one major thermal transition at a Tmax of 75.92 °C. From the parent protein, a single amino acid mutation was made which has no major effect on short-term thermal stability (Mutation 1) with a Tmax of 75.52 °C. However, additional single amino acid mutations are shown to have significant impacts on the protein’s stability (Mutation 2 and Mutation 3). The presence of an obvious shoulder is observed in Mutation 2, likely corresponding to destabilization in the CH2 domain with an added Tmax,1 of 70.04 °C coupled with a small shift in the main transition relative to the parent protein with a Tmax,2 of 75.14 °C. Mutation 3 causes significant destabilization of the CH2 domain, resulting in a complete additional unfolding peak with a Tmax,1 of 64.85 °C. The main transition is relatively unaffected with a Tmax,2 of 75.29 °C. As illustrated in the significant destabilization in Mutation 3, modification does not always have the same effect; rather, it depends on both the site of the modification and on physicochemical properties of the new amino acid. Optimizing the desired functional benefits of sequence modification with the structural stability of the protein aids in the comprehension of the structure-function relationship and can facilitate development of advanced therapeutics.

Table 3. Transition temperature for mutation screen. Mean ± SD, n = 3. *Determined via Voigt Model.
| Sample | Tmax,1 (°C) | Tmax,2 (°C) |
|---|---|---|
| Parent | — | 75.92 ± 0.15 |
| Mutation 1 | — | 75.52 ± 0.14 |
| Mutation 2 | 70.04 ± 0.86* | 75.14 ± 0.06 |
| Mutation 3 | 64.85 ± 0.05* | 75.29 ± 0.06 |
Conclusions
Screening the impacts of solution environment and sequence modification on short-term thermal stability is critical for the development of high-quality pharmaceutical drug products. The TA Instruments RS-DSC enables high-throughput screening for thermal stability through simultaneous testing of up to 24 samples, significantly improving time to decision. Herein, we demonstrate accurate and reproducible analysis of complex-multiple transition antibody samples, and the rapid determination of buffer component and mutation impacts on overall protein structure. New algorithms in the data processing software, NanoAnalyze, facilitate the analysis of large quantities of thermal data now accessible with highthroughput screening. Overall, the TA Instruments RS-DSC provides a new platform for characterizing antibody drug product stability — an important variable in understanding resilience to thermal stress, product quality, and supporting regulatory approval.
References
- V. T. Oi, T. M. Vuong, R. Hardy, J. Reidler, J. Dangl, L. A. Herzenberg and L. Stryer, “Correlation between segmental flexibility and effector function of antibodies,” Nature, vol. 307, pp. 136-140, 1984.
- P. L. Privalov and S. A. Potekhin, “Scanning microcalorimetry in studying temperature-induced changes in proteins,” Methods in Enzymology, vol. 131, pp. 5-51, 1986.
- J. Wen, Y. Jiang and L. Nahri, “Effect of Carbohydrate on Thermal Stability of Antibodies,” American Pharmaceutical Review, vol. 11, p. 98, 2008.
- “Standard Practice for Calibration of Fixed-Cell Differential Scanning Calorimeters,” ASTM E2603-15, 2023.
- “NanoDSC: What to Consider when Choosing a Baseline and Model,” TA Instruments, MC154.
- C. M. Johnson, “Differential scanning calorimetry as a tool for protein folding and stability,” Archives of Biochemistry and Biophysics, vol. 531, pp. 100-109, 2013.
- “Rapid Thermal Stability Screening of High Concentration Biologic Drugs,” TA Instruments, MC177.
- K. J. Arlotta, A. V. Gandhi, H.-N. Chen, C. S. Nervig, J. F. Carpenter and S. C. Owen, “In-Depth Comparison of Lysine-Based Antibody-Drug Conjugates Prepared on Solid Support Versus in Solution,” Antibodies, vol. 7, p. 6, 2018.
Click here to download the printable version of this application note.

