Keywords: Rheology, Electrochemical Impedance Spectroscopy, Li-ion Battery, Cathode, Carbon Nanotubes
RH139
Abstract
Rheo-impedance spectroscopy (Rheo-IS) is a method for simultaneously measuring rheology and electrochemical impedance. It is currently attracting attention as a new method for evaluating the properties of dispersions such as slurries, pastes, and emulsion creams. In this article, the properties of electrode slurries for lithium-ion secondary batteries (LIB) are investigated using Rheo-IS. A Rheo-IS characterization of the cathode slurries, the electrical resistance of the resulting electrodes, and battery performance of the full cells are included in this study. The possibility of directly predicting critical aspects of battery performance from Rheo-IS data in the slurry phase is demonstrated in this article.
Introduction
Carbon nanotubes (CNT) have been gaining interest in recent years as a next-generation conductive additive in the development of LIB electrodes. CNTs are composed of sp2 carbon arranged in a tubular structure. Their aspect ratio makes them ideal as a conductive additive, with some varieties having diameters in the nanometer scale and lengths in the micron scale. Their properties are tunable, and are determined by the number of layers, structural defects, average physical dimensions, and surface functionalization. Due to this unique structure and high electronic conductivity, CNTs are expected to reduce the Ohmic resistance of the electrodes, improve capacity and capacity retention during fast charge, and ultimately extend the cycle life. LiFePO4 (LFP) is an active material for LIB cathodes and is increasingly being adopted due to its high thermal stability, cycling stability, and low cost. However, LFP has low electrical conductivity. Adding a small amount of CNT to LFP can improve the conductivity, making LFP/CNT an increasingly popular combination in LIB electrodes.
Rheo-IS is a new analytical technique for characterizing the viscoelastic and electrical properties of electrode slurries in a simultaneous measurement. It is a promising method for predicting the calendared electrode resistance and the final battery performance early in the manufacturing process. This article presents the results of Rheo-IS measurements of LFP cathode slurries with different amounts of CNT. Electrode and battery performance made from the LFP cathode slurries are also examined.
Experimental
Preparation of LFP slurries and evaluation of the slurries
Slurries were prepared by mixing LFP, multi-walled CNT, polyvinylidene fluoride (PVDF) binder, and N-methylpyrrolidone (NMP) solvent with a centrifugal mixer according to the composition shown in Table 1.
Rheo-IS measurements were performed using TA Instruments™ Discovery™ HR-30 Hybrid Rheometer with Rheo-Impedance Spectroscopy Accessory (dual-electrode lower plate, 40 mm upper plate, operating gap of 1 mm) and HIOKI™ IM3536 LCR meter. The initial static impedance, the simultaneous rheology-impedance measurement at each of the four shear rate steps from 0.01 to 100 s-1, and the static impedance after flow were measured at 25 °C. The impedance was measured with a voltage amplitude of 0.1 V and frequency from 4 Hz to 8 MHz.
Table 1. Solid composition of LFP cathode slurries (wt%)
| LFP | CNT | PVDF | |
|---|---|---|---|
| CNT 0.2 wt% | 96 | 0.2 | 3.8 |
| CNT 0.5 wt% | 96 | 0.5 | 3.5 |
| CNT 1.0 wt% | 96 | 1.0 | 3 |
| CNT 2.0 wt% | 96 | 2.0 | 2 |
The solid content of the slurries is 52–54 wt%.
Preparation of electrodes and full cells, evaluation of battery performance.
The four cathode slurries were coated, dried, and calendared for preparation of electrode sheets. The coating weight was 15 mg/ cm2 with a volumetric density of 2.1 g/cm3. The through-plane resistance of the electrodes was also measured.
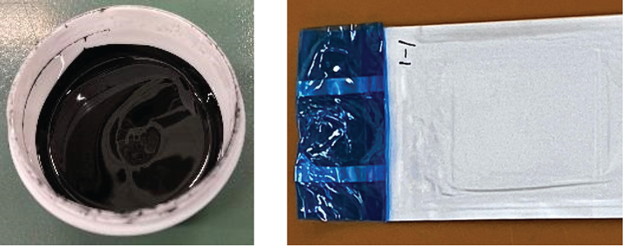
Laminated pouch cells, shown in Figure 1, were also prepared. The cells consisted of LFP positive electrode, a graphite-based negative electrode, a ceramic-coated polyethylene separator, and an electrolyte (1.0M LiPF6 in EC/EMC/DMC = 3/3/4 + VC). The initial charge/discharge rate characteristics of the cells were evaluated using TOSCAT-3000 (TOYO SYSTEM CO., LTD.).
Results and Discussion
Slurry impedance and electrode resistance
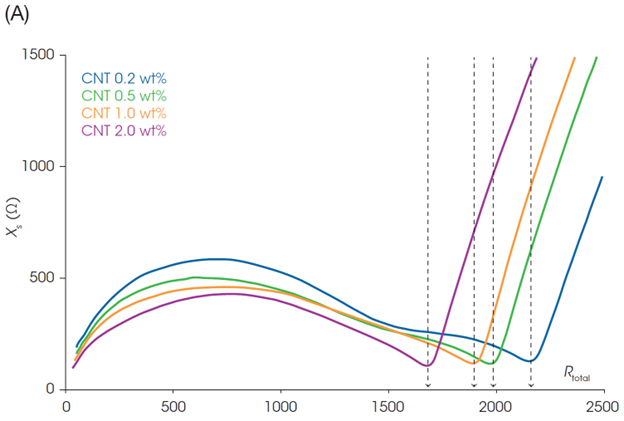
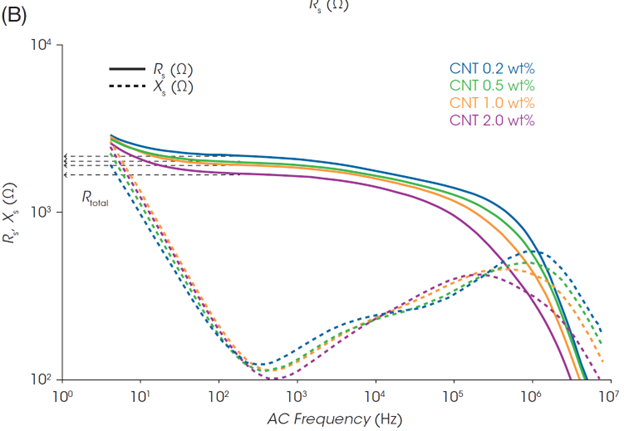
Figure 2 shows the static impedance results of LFP cathode slurries with different loadings of CNT. The curves of the Nyquist plot (Figure 2A) consist of a combination of multiple semicircles and a straight line. Resistance (Rs) is plotted on the x-axis and reactance (Xs) on the y-axis. The diameter of each semicircle represents the magnitude of the electrical resistance of each component. The semicircle closer to the origin, and at higher frequencies, reflects the conduction response of the more conductive components. The slurry with the higher CNT content has the smallest semicircle, meaning that sample has the lowest resistance.
Rs at the end of the rightmost semicircle can be considered the total resistance of the slurry. Rs at the minimum Xs, in the rightmost region was determined as the slurry resistance (Rtotal). Rtotal is identical to the low-frequency plateau of Rs in the Bode plot (Figure 2B) and reflects the response of all components in the slurry. The slurry resistance Rtotal will directly affect the electrode and battery performance.
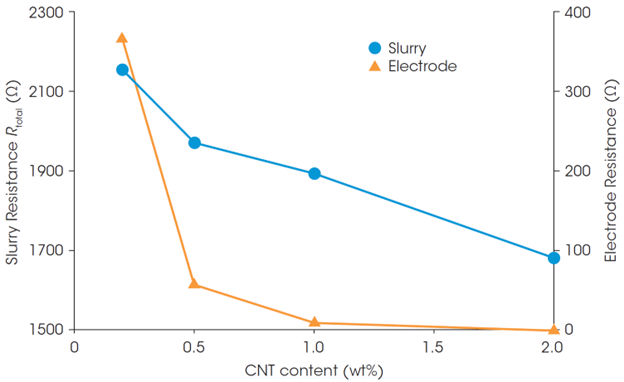
The Rtotal and through-plane resistance of the cathode sheets made from the slurries were plotted against the CNT content (Figure 3). The CNT content dependences of the Rtotal and electrode resistance are in good agreement: higher CNT content results in lower Rtotal and electrode resistance. The high electrode resistance at 0.2 wt% CNT suggests that the added amount of CNT would not be enough to establish a good conductive network.
Robustness assessment by Rheo-IS measurements
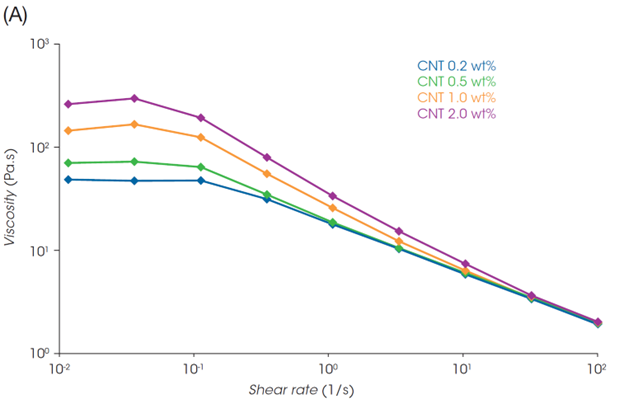
Rheo-IS data (the viscosity and impedance under flow) of the slurries are shown in Figure 4. The viscosity decreased with increasing shear rate in all slurry samples (Figure 4A). This shear thinning behavior is the result of the LFP, CNT, and PVDF inner structure collapsing due to flow. The viscosity at low shear rate increases with increasing the amount of CNT, suggesting that a more developed structure is formed through the CNT network.
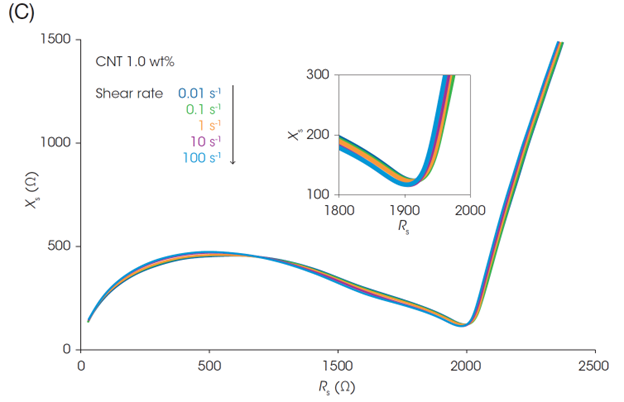
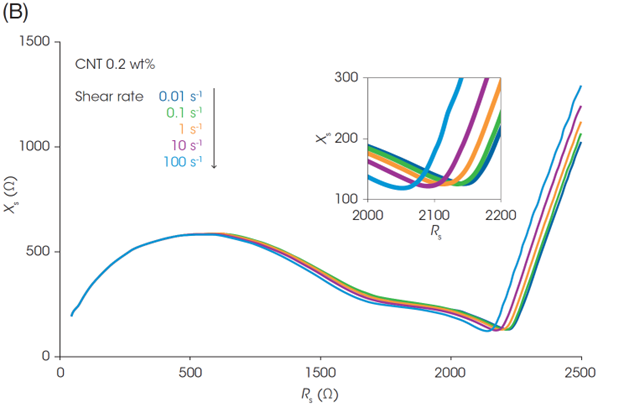
While viscosity changes under different flow conditions, the Nyquist plots of the slurry impedance do not change as dramatically as the rheology (Figures 4B and 4C). This indicates that an efficient electron path is maintained in the slurries despite structural changes under flow. If a part of the electrical contact in the inner structure is disrupted due to shear flow, the uniform dispersion of CNT and LFP enables electrical contact to remain in place.
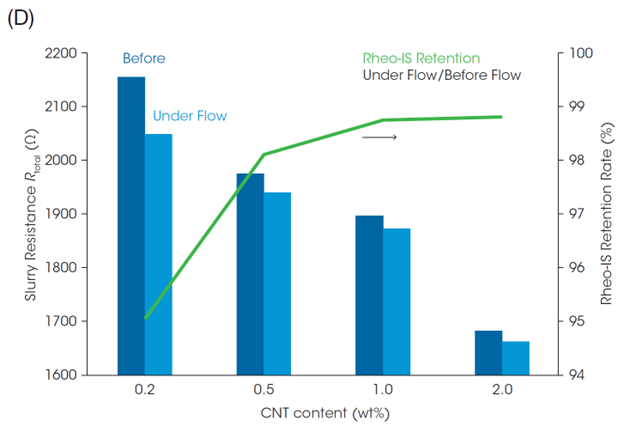
Focusing on the rightmost end of the semicircles in the plots in Figures 4B and 4C (i.e., Rtotal), the Rtotal for the LFP slurry with 1.0 wt% CNT is almost identical across the different shear rates. On the other hand, the Rtotal of the slurry with 0.2 wt% CNT decreases with increasing the shear rate. Figure 4D shows Rtotal before shear and under shear flow at 100 s-1, and the Rheo-IS retention rate (Rtotal under flow at 100 s-1 / Rtotal in initial static). The slurry with the lowest CNT content of 0.2 wt% shows the most significant change in Rtotal due to shear flow. Its electrical properties are easily affected by shear caused by coating or mixing, meaning that it is a slurry with poor process robustness.
Battery performance and Rheo-IS
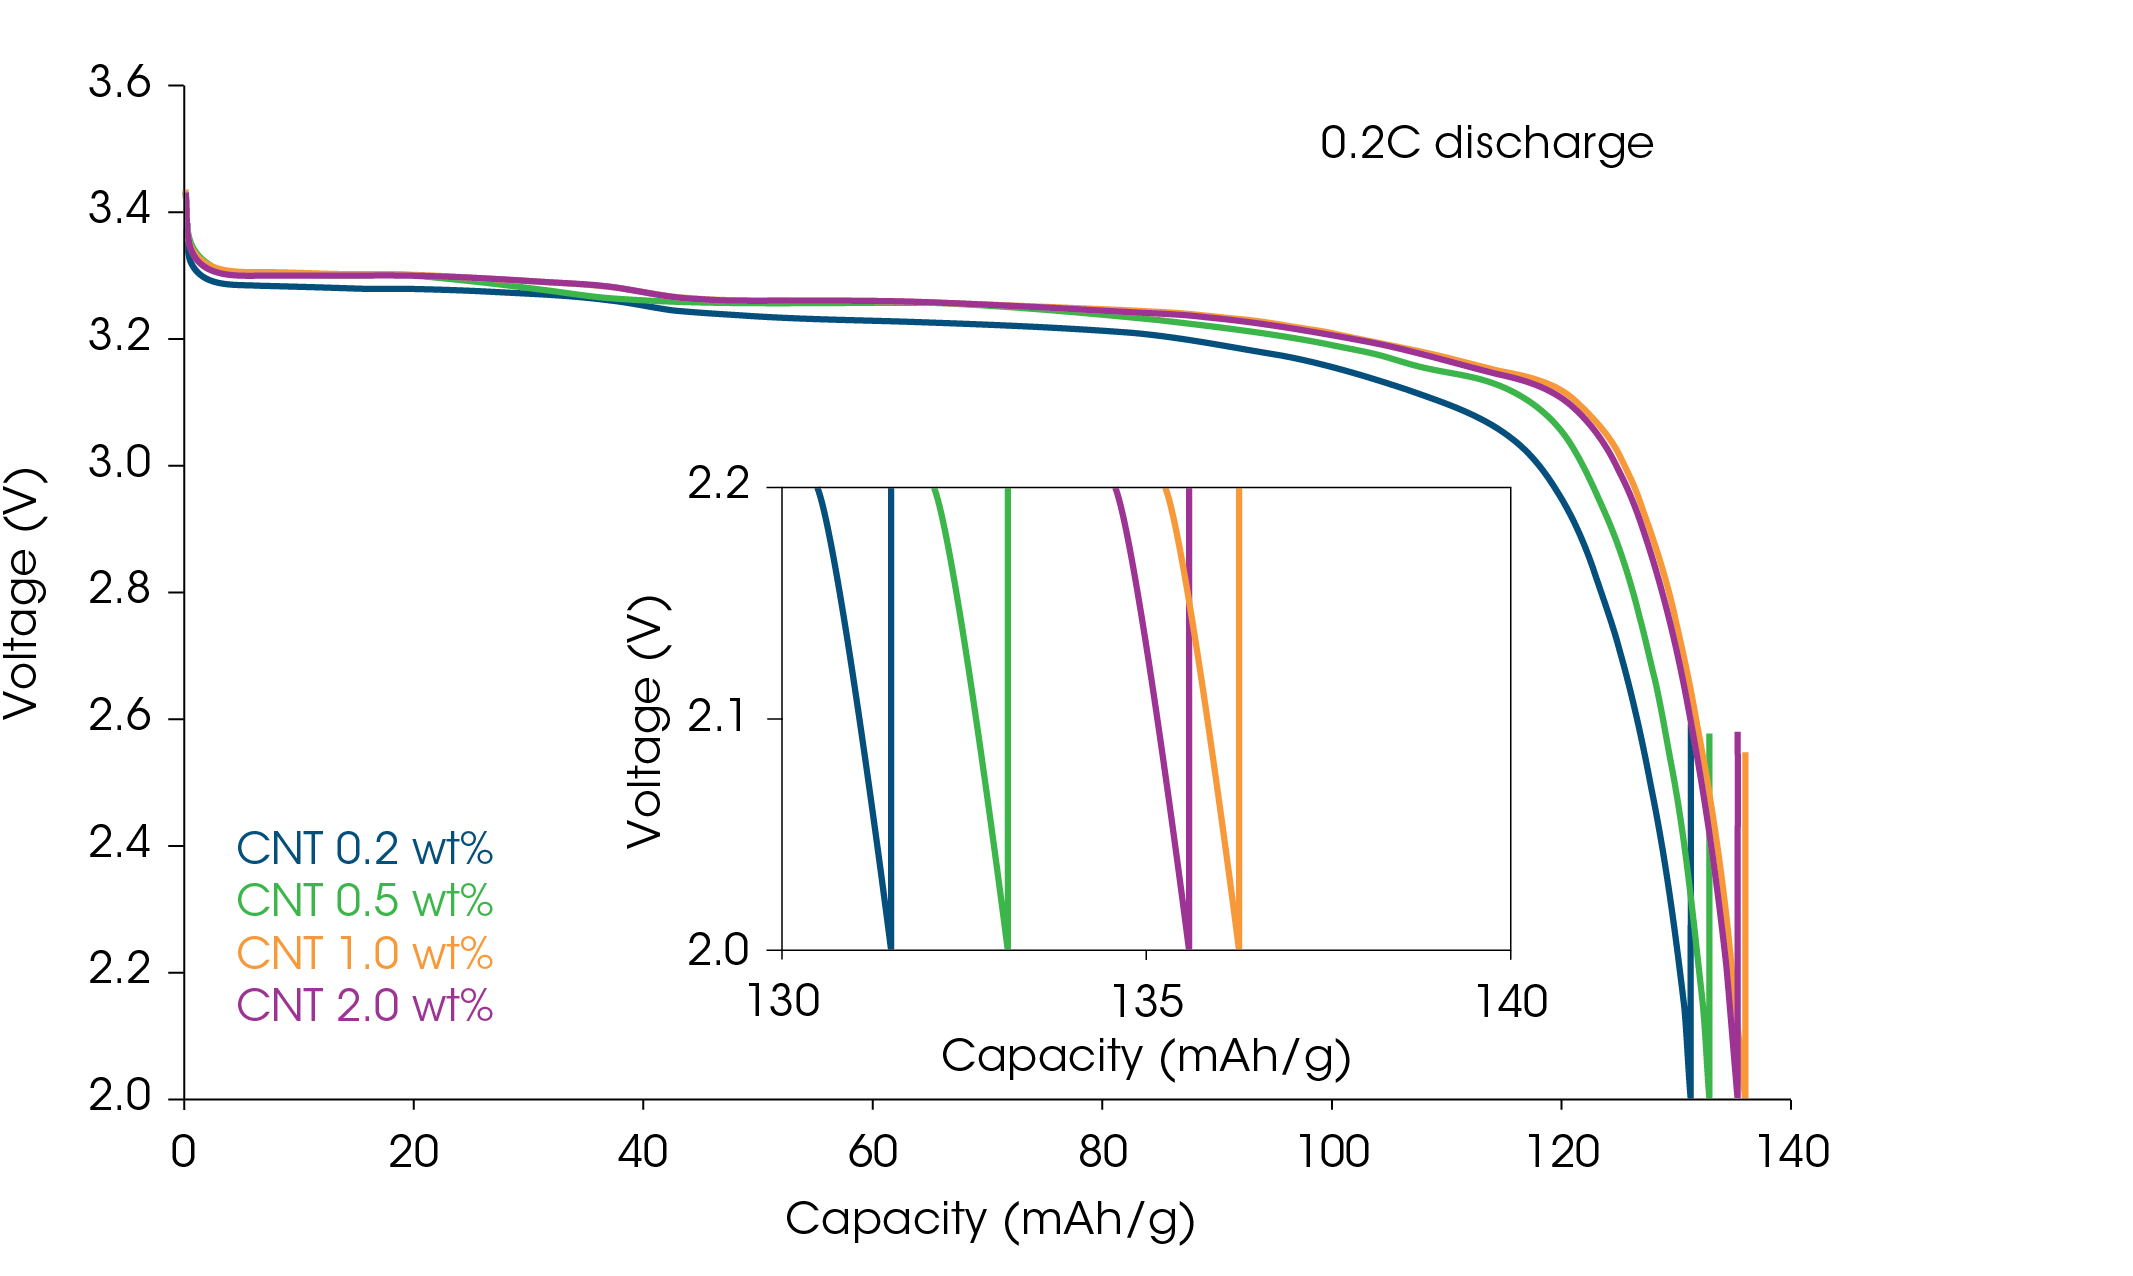
The slurry resistance Rtotal measured previously can be correlated to the electrode and battery performance. The charge/discharge characteristics of the full cells made from LFP cathode slurries with different CNT content are shown in Figure 5. Comparing the discharge capacity at 25 °C and 0.2 °C, the CNT 1.0 wt% cell has a discharge capacity of 136.3 mAh/g, while the CNT 0.2 wt% cell has a discharge capacity of 131.5 mAh/g. As mentioned above, the slurry and electrode with 0.2 wt% CNT had a significantly higher resistance (Figure 3). The low electronic conductivity of the cathode will also result in poor discharge performance. The 2.0 wt% CNT cell had a discharge capacity of 135.6 mAh/g, slightly lower than the 1.0 wt%. The impedance of the full cell with 2.0 wt% CNT was higher, although the through-plane electrode resistance is lower. It is possible that higher CNT loadings will impede Li-ion mobility, increasing the mass transport resistance and reducing discharge capacity.
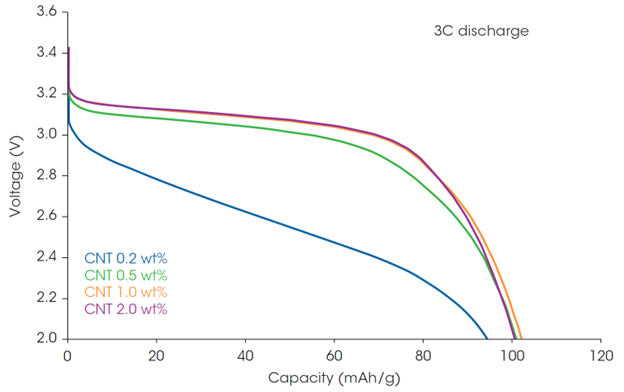
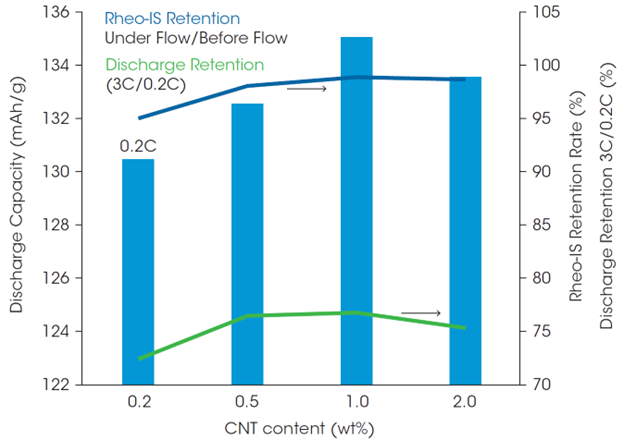
The high charge rate (C-rate) performance of the cells was also examined. The discharge capacity at 3C was generally lower than at 0.2C and the differences from CNT mass % were more significant (Figure 6). The capacity retention was measured as a function of discharge rate, with rates ranging from 0.2C to 3C. Figure 7 shows the discharge capacity at 0.2C and the capacity retention rate at 3C (ratio of 3C discharge capacity when 0.2C discharge capacity is taken as 100%), as well as the Rheo-IS retention rate (Rtotal under flow when Rtotal in initial static). The cell with 0.2 wt% CNT had a low discharge capacity and 3C capacity retention rate, which indicates that amount of CNT is not sufficient for good performance. The same tendency was observed in the Rheo-IS retention rate (blue in Figure 7). This result is an example where an important aspect of battery performance can be directly predicted from the Rheo-IS of the electrode slurry.
Conclusions
The characterization of the LFP cathode slurries with different CNT content was investigated using Rheo-IS measurements. Electrode and battery performance of cells made from the slurries were also examined. The slurry resistance determined from the impedance measurements agreed well with the electrode penetration resistance after coating, indicating that Rheo-IS measurement of slurries can be applied as an analytical method further upstream in the process. Furthermore, in the battery with the lowest CNT addition amount, which showed the largest change in impedance under flow, the discharge capacity and high-rate discharge performance were poor. This is an example where battery performance can be directly predicted from the Rheo-IS of the electrode slurry. Rheo-IS is a powerful tool in the optimization of active material types and electrode composition for the development of next-generation electrodes, which are essential for the battery development.
References
- A. Helal, T. Divoux, and G. H. McKinley, “Simultaneous Rheoelectric Measurements of Strongly Conductive Complex Fluids” Phys. Rev. Applied, 6, 064004, 2016.
- A. C. Lazanas, et.al, “Electrochemical Impedance Spectroscopy A Tutorial”, ACS Meas. Sci. Au 2023, 3, 162−193
- Z. Wang, T. Zhao, J. Yao, Y. Kishikawa, and M. Takei, “Evaluation of the Electrochemical Characterizations of Lithium-Ion Battery (LIB) Slurry with 10-Parameter Electrical Equivalent Circuit (EEC),” J. Electrochem., 164 (2), A8-A17, 2017.
- TA Instruments Application Note RH-137, “Characterization of LIB Cathode Slurries Using Simultaneous Measurements of Rheology and Impedance Spectroscopy”.
Acknowledgement
For more information or to request a product quote, please visit www.tainstruments.com to locate your local sales office information.
This note was a collaboration between URUTAMA.INC and TA Instruments.
This note was written by Yuki Kawata, PhD and Jeremy May, PhD.
TA Instruments and Discovery are trademarks of Waters Technologies Corporation. HIOKI is a trademark of Hioki E.E.
Click here to download the printable version of this application note.

