Keywords: Linear Viscoelastic Region, Rheology
RH109
Problem
Materials such as polymers exhibit viscoelastic behavior which is directly related to molecular structure and formulation differences. To accurately evaluate the relationships between molecular structure and viscoelastic behavior requires that experiments, such as rheological measurements, be conducted in regions where the viscoelastic properties observed are independent of imposed stress or strain levels. That is, experiments must be conducted in the linear viscoelastic region.
Solution
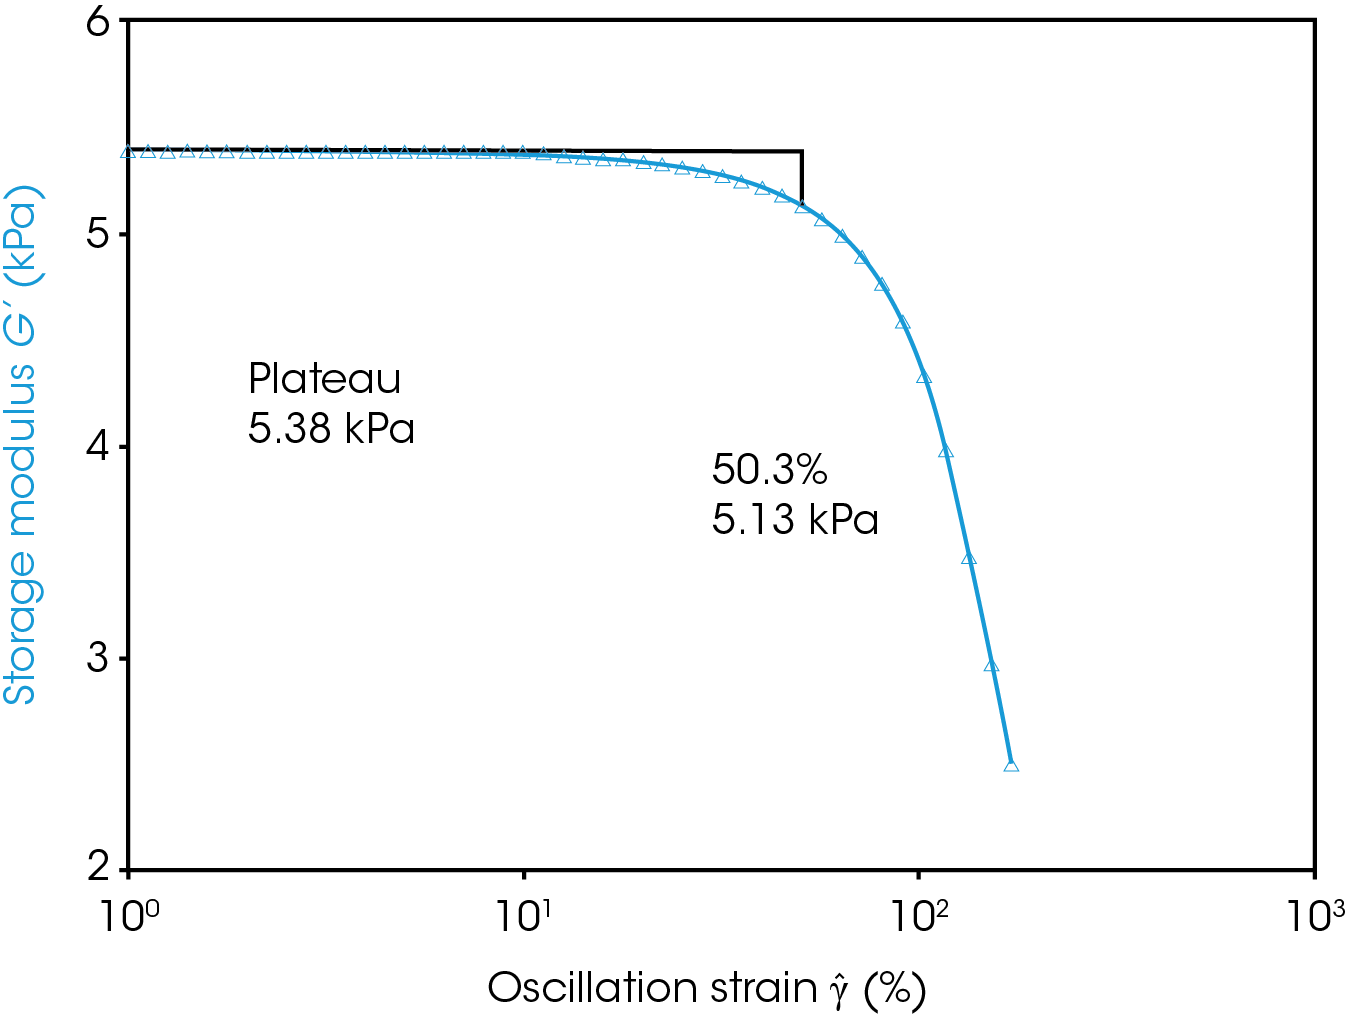
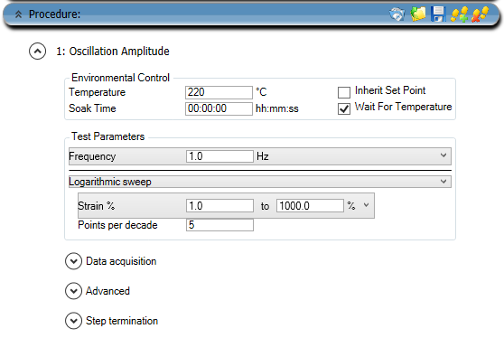
A dynamic oscillation approach is used and increasing cyclic levels of stress and strain are applied at a constant frequency. This is a strain sweep. The point at which a dynamic viscoelastic function (usually G’, the storage modulus) deviates by more than 5% from a constant (plateau) value indicates departure from linear viscoelastic behavior. Figure 1 illustrates the oscillatory strain sweep results for polystyrene at 1 Hz and 220 °C. Departure from linear behavior occurs at about 5.13 kPa and at about 50.3 % strain. The following test can be programmed in TRIOS to generate similar data with other samples (Figure 2).


Acknowledgement
Click here to download the printable version of this application note.

