Keywords: Linear Viscoelastic Region, DMA, Dynamic Mechanical Analysis
TA438
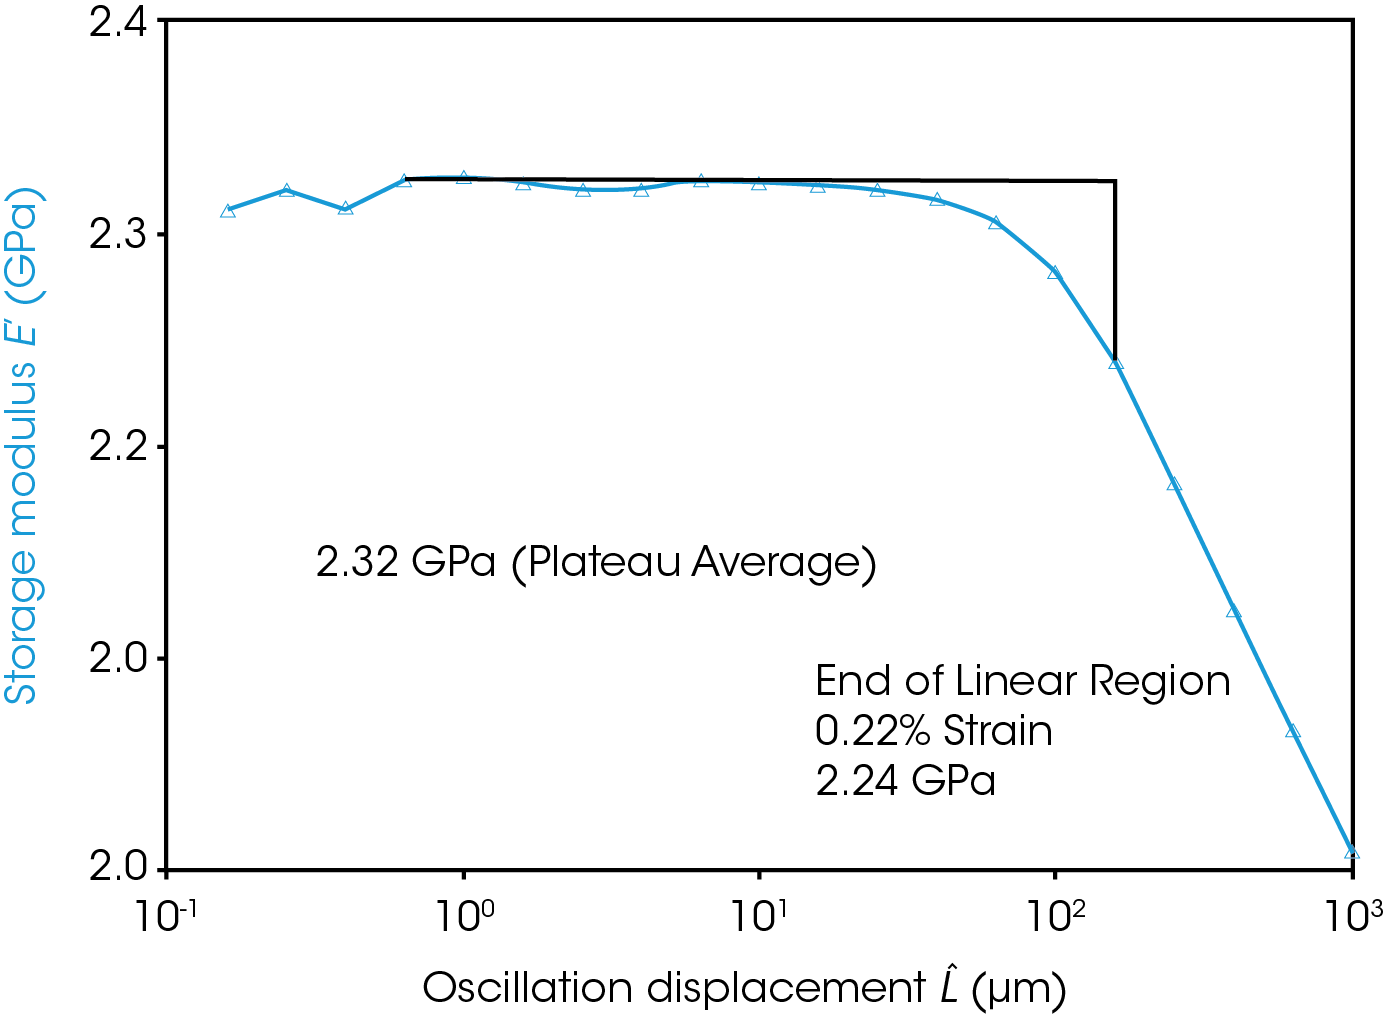
Dynamic mechanical analysis DMA is a very powerful technique which allows for determination of mechanical properties (modulus and damping), detection of molecular motions (transitions), and for the development of morphology relationships (crystallinity, molecular weight, crosslinking, etc).1 In DMA, a sinusoidal deformation is applied to a sample at a specified frequency and the materials response is measured. In order to use DMA to accurately determine mechanical properties and develop morphological relationships, the material must be deformed at an amplitude that is within the linear viscoelastic region of the material. Within the linear viscoelastic region, the materials response is independent of the magnitude of the deformation and the materials structure is maintained intact (unbroken). Characterization of the material within the linear region yields a “fingerprint” of the structure of the polymer. Therefore, any differences in the structure of polymers can easily be measured as differences in the dynamic mechanical properties. Special care should begiven when selecting an amplitude for a DMA test. As a general rule of thumb, solids are linear at strains less than 0.1% (0.001 strain units). However, this is a general rule and may not apply to all samples so the linear region may require verification. The linear region can be measured for a material using a strain sweep test. In a strain sweep test (Figure 1), the frequency of the test is fixed, and the amplitude is incrementally increased. To determine the linear viscoelastic region, the storage modulus should be plotted against the amplitude or strain. To find the end of the linear region, a good rule is to find the amplitude at which the plateau value of the storage modulus drops by ~5%. Figure 1 shows a strain of polycarbonate in single cantilever at room temperature.
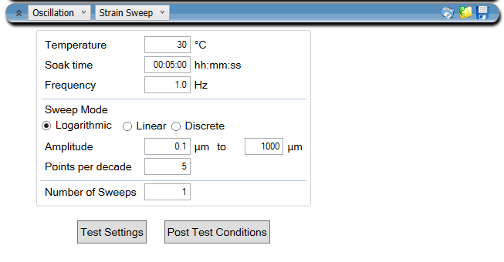
The test in Figure 1 can obtained from a strain sweep test programmed in TRIOS as in Figure 2.


References
- Reference: Turi, Edith A., Thermal Characterization of Polymeric Materials, Second Edition, Volume I., Academic Press, Brooklyn, New York, 1997, P. 980.
Click here to download the printable version of this application note.

