Keywords: DSC, non-isothermal kinetics, PP, recycling, X3 DSC, kinetics, Avrami, crystallization, crystallization kinetics, nucleation
TA454
Abstract
The crystallization kinetics of different color marker pen caps made from polypropylene (PP) were evaluated using a non-isothermal crystallization DSC experiment. A reference sample of PP and PP containing a chemical nucleator Millad 3988 (DMDBS) were also included for comparison. Significant differences in crystallization rate constant k, Avrami geometric exponent n, and activation energy ΔE were observed with some of the colors showing crystallization rates exceeding and activation energies approaching PP containing the chemical nucleator.
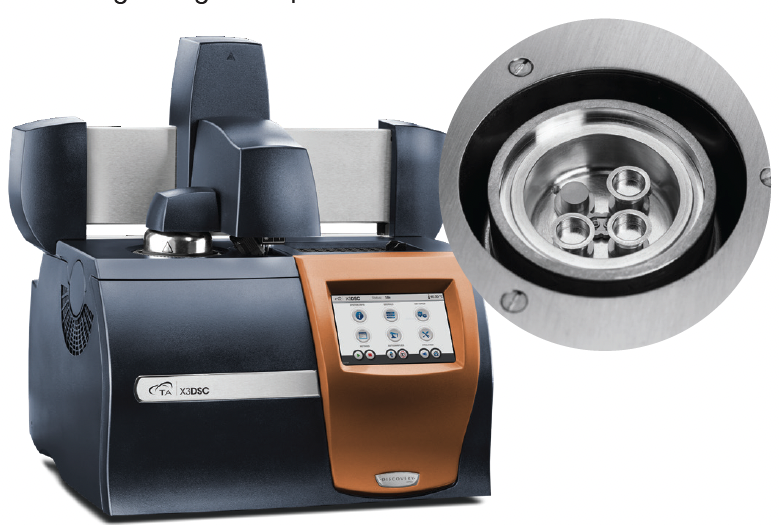
In the crystallization kinetics experiment, four or five runs are made either isothermally (vary temperatures) or non-isothermally (vary heating rates). The TA Instruments Discovery X3® DSC is well suited to this experiment as the analyst can run three samples simultaneously cutting the analysis time to one third of a DSC containing a single sample sensor.
Background
In a previous work, it was demonstrated that colorants can have a profound effect on the crystallization temperature and the Avrami parameters of PP [1]. Other authors have demonstrated that β and γ-quinacridone pigments commonly used as colorants have profound effects on crystallization and mechanical properties of PP at concentrations as low as 0.01% [2] [3]. In this work, a new set of samples were evaluated, and results of a more extensive kinetics experiment are presented.
For the DSC experiment the exothermic process is expressed as a function of temperature using Equation 1.

where:
X(T) is fraction crystallized at temperature T
ΔHC = Overall heat of crystallization – area under the crystallization curve of the DSC experiment.
dHC = enthalpy of crystallization released during infinitesimal temperature range dT.
T0 = the temperature at crystallization onset taken from the DSC data.
T = temperatures during crystallization process
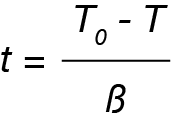
where:
t = time in minutes or seconds
T0 = temperature at crystallization onset
T = Temperature during crystallization
β = cooling rate (ºC / min)
The Avrami macrokinetic model (Equation 3) is used to analyze non-isothermal crystallization data.
X(t) = 1-exp ( -ka tna ) (3)
where:
X(t) = fraction crystallized as a function of time
ka = Avrami Rate Constant (function of nucleation and crystal growth rate)
na = Avrami Exponent (function of growth geometry)
t = time (seconds or minutes)
Equation 3 can be rearranged to yield the linear form:
log(-ln( 1-X(t)) = logka + na logt (4)
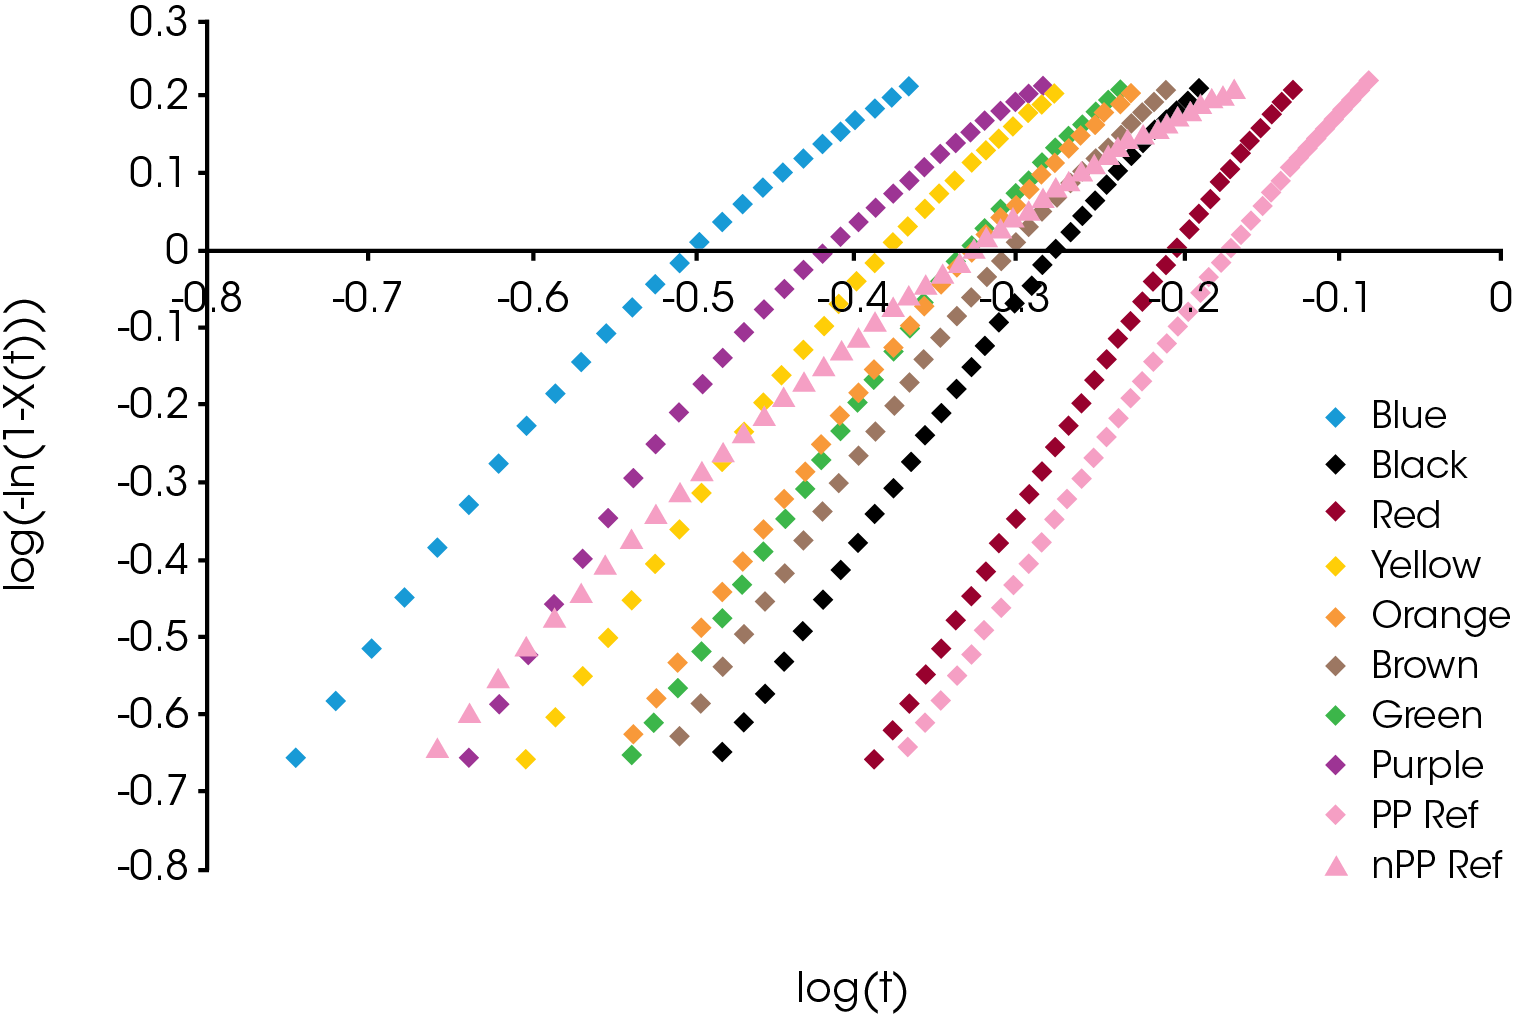
A plot of the log (-ln(1-X(t)) versus log t (typically 0.2 ≤X(t)≤ 0.8) yields the Avrami parameters ka (antilog of intercept) and na (slope).
The crystallization half-time (t1/2 ) can be calculated from the Avrami parameters:
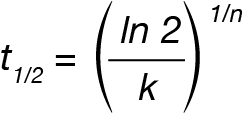
The activation energy can be calculated from the rate data using the Arrhenius relation
ψTc = ψ0 exp (-ΔE/RT) (6)
Where:
ΨTc = k, k1/n,1/ t1/2 or [dX/dt]X(t)
Ψ0 = pre-exponential
k=Avrami Rate Constant (min -1)
n = Avrami Exponent
t ½ = crystallization half-time
[dX/dt]X(t) = instantaneous crystallization rate – Friedman isoconversional method [5]
The non-isothermal crystallization experiment is done by cooling the sample at four or five different cooling rates chosen so that the resulting crystallization temperatures span a range of approximately 10 °C. The resulting exotherms are integrated using the TRIOS® instrument software and can be analyzed using any of several macrokinetic models including the Avrami model which is used in this work. In a previous work, it was demonstrated that heating significantly above the equilibrium melting temperature is needed to destroy the crystal structure to obtain more consistent results [6]. This may not be possible for some polymers that may decompose, so evaluation of the decomposition temperature by TGA is important.
Experimental
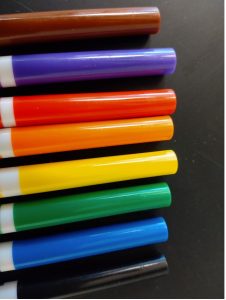
The samples chosen for this experiment are eight different color marker pen caps made from PP and purchased from Amazon (Figure 2). A reference sample of PP and a sample of PP containing a chemical nucleator Millad 3988 (DMDBS) were also analyzed for comparison. Samples are heated to 230 °C and held for 1 minute to remove thermal history then cooled at four different cooling rates. Fresh sample is used for each run.
Table 1. Experimental Parameters
| Instrument | TA Instruments DSC X3 |
|---|---|
| Sample Mass | 3 mg nominal |
| Pan | Tzero Aluminum |
| Purge | N2 @ 50 mL / min |
| Cooling Rates | 2.5, 5, 10, and 20 °C / min |
Data Reduction
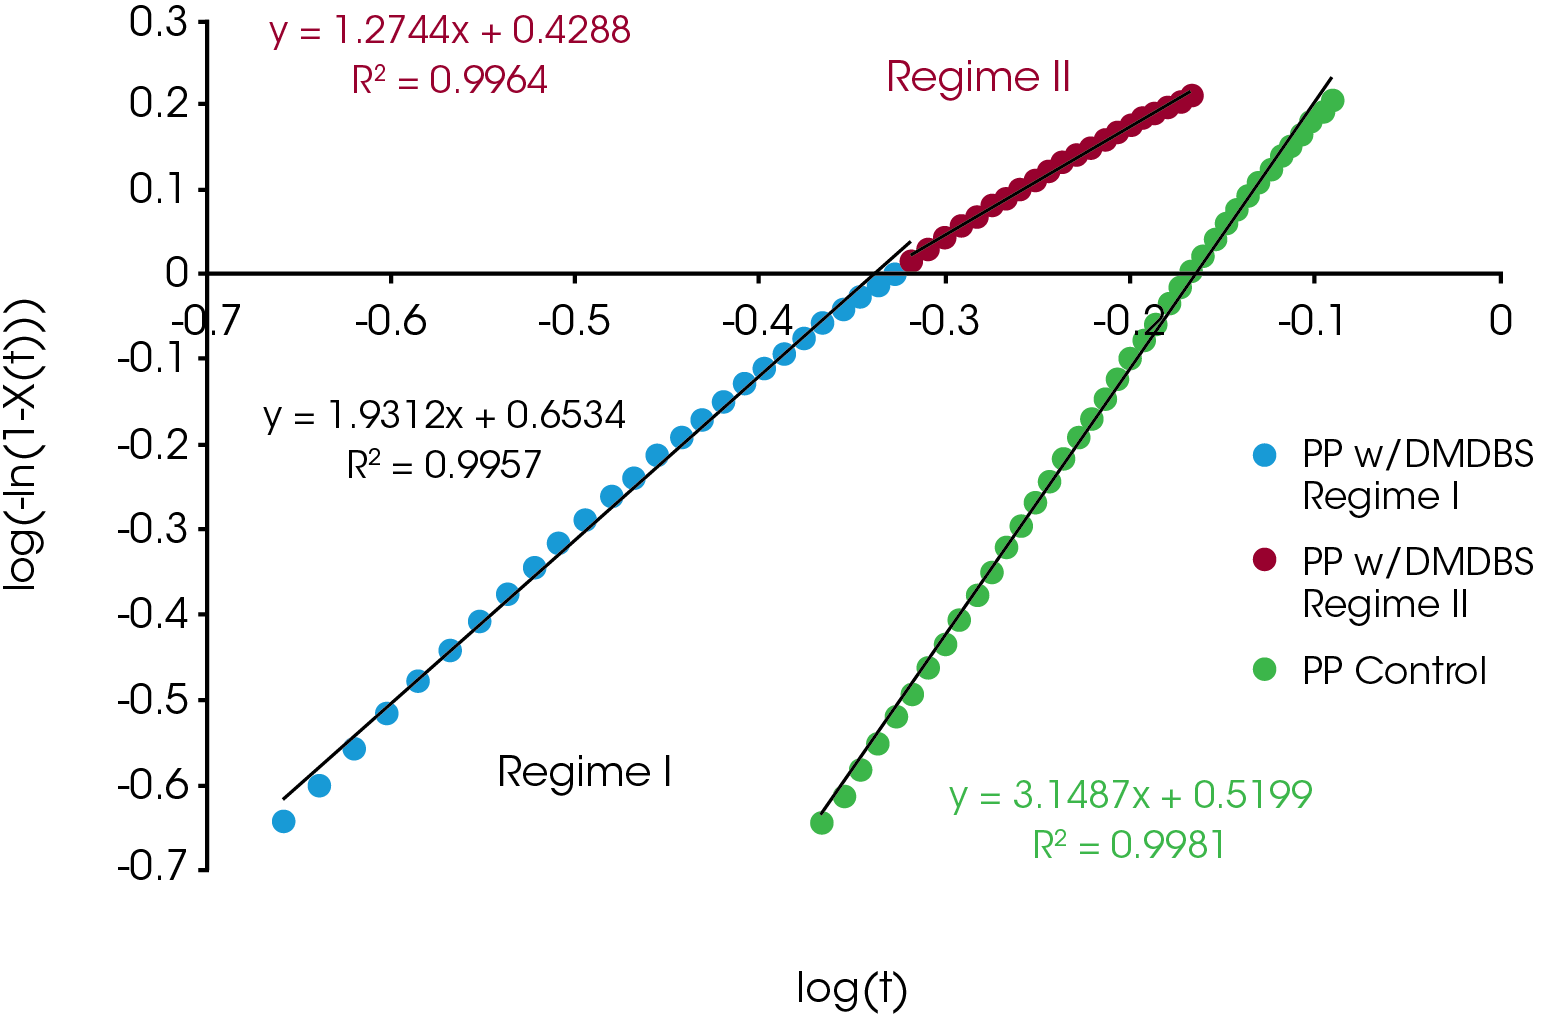
The relative crystallinity data obtained using Equation 1 was fit using the linear form of the Avrami equation (Equation 4) using limits of X(t) ranging from 0.2 to 0.8. Often this results in a linear fit, but many cases in our sample set the data deviates from linearity and was fit by splitting it into two parts – Regime I and Regime II. Regime I is the initial crystallization and crystal growth and Regime II is the late stages of crystallization characterized by a reduction in new crystal emergence. An example is shown in Figure 3 which compares the Avrami analysis of the PP sample containing DMDBS which shows deviation from linearity and the PP control which appears linear throughout the crystallization process. For the sample sets showing significant deviation from linearity, separate Avrami parameters (slope and intercept of Equation 4) and activation energies were calculated representing Regime I and II. In most cases, at the lowest heating rate there was little deviation from linearity and the samples were analyzed with a single linear fit.
Results and Discussions
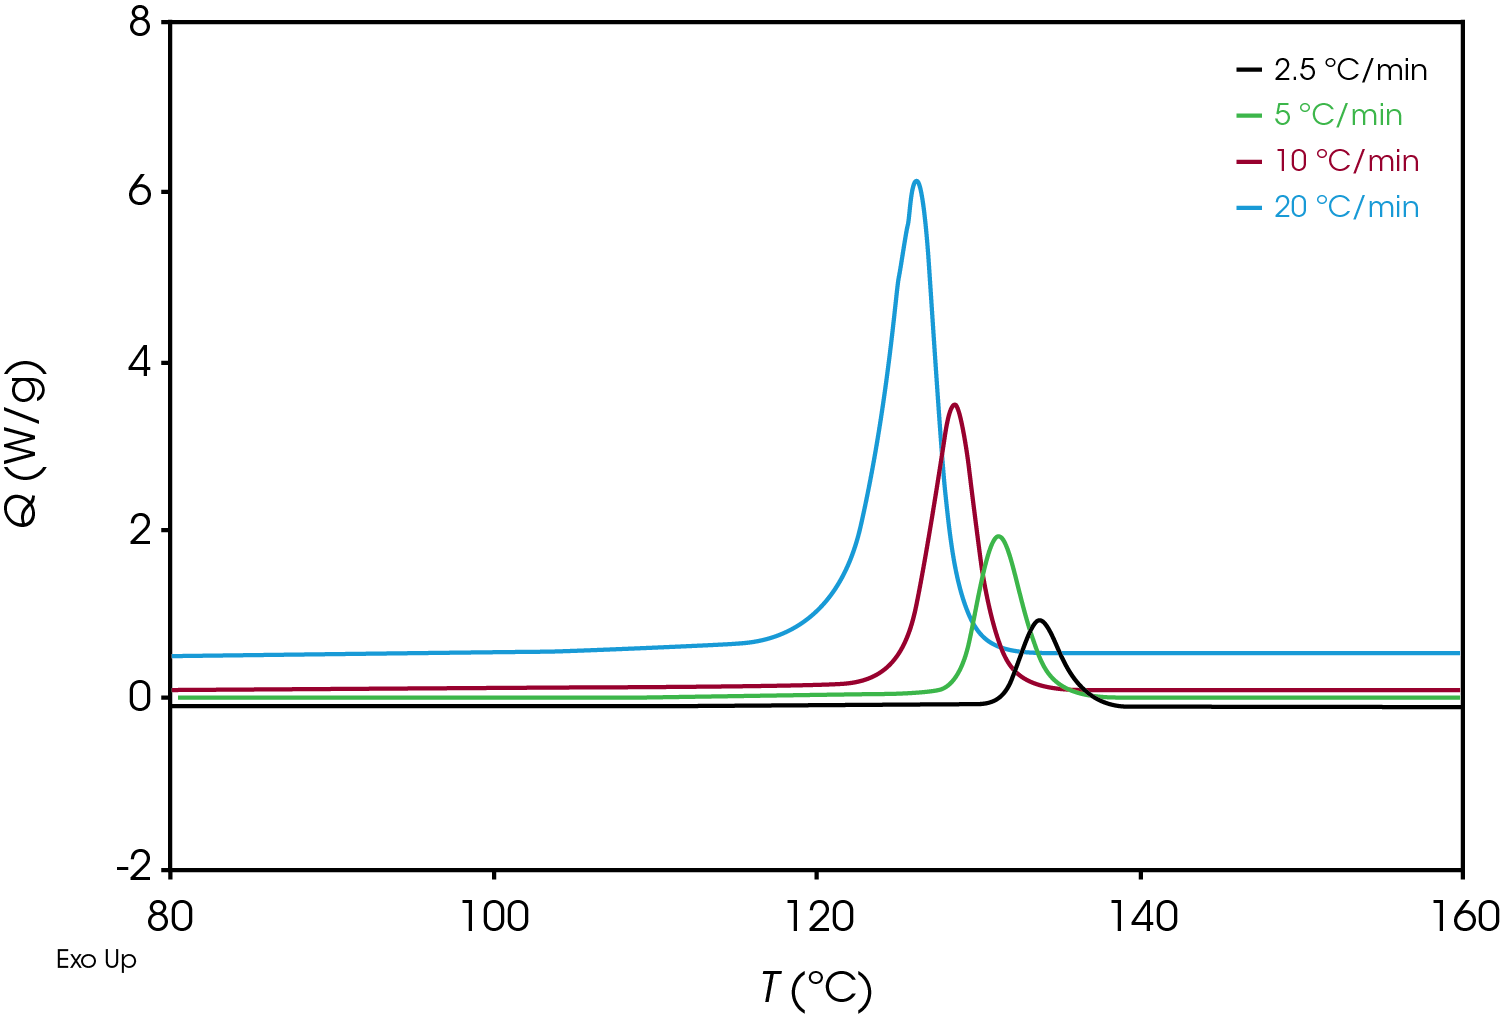
An example of crystallization exotherms resulting from the non-isothermal experiment for the green sample is shown Figure 4.
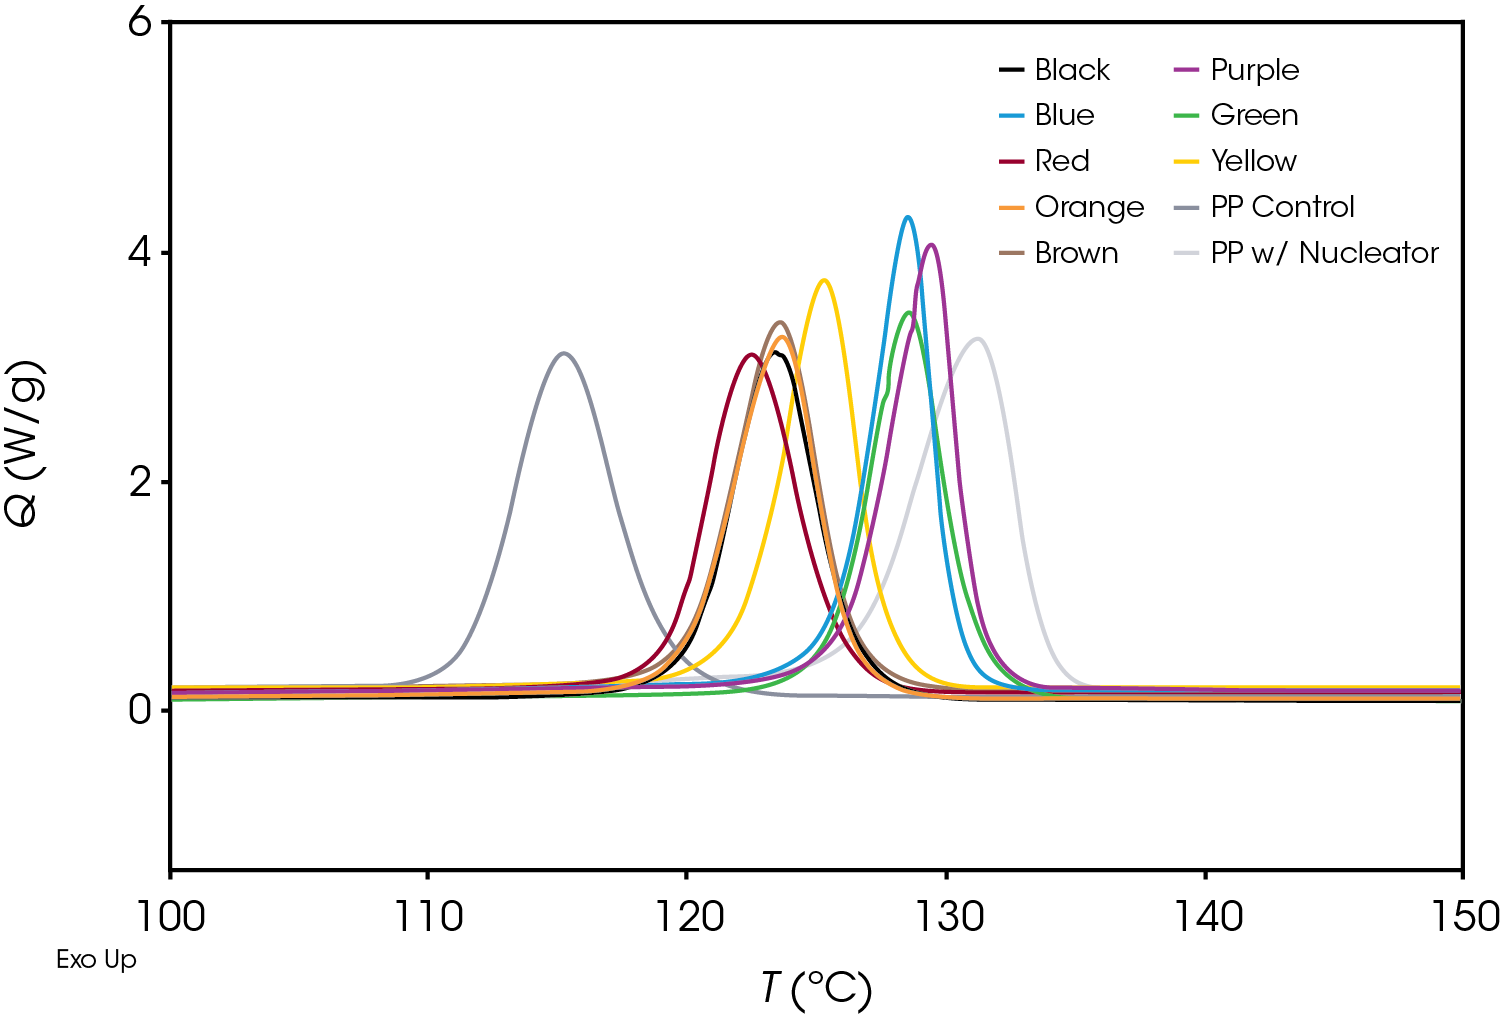
Figure 5 shows a comparison of the crystallization exotherms of all samples at a cooling rate of 10 °C / min. There is a significant difference in the crystallization temperature as well as the overall shape of the exotherms.
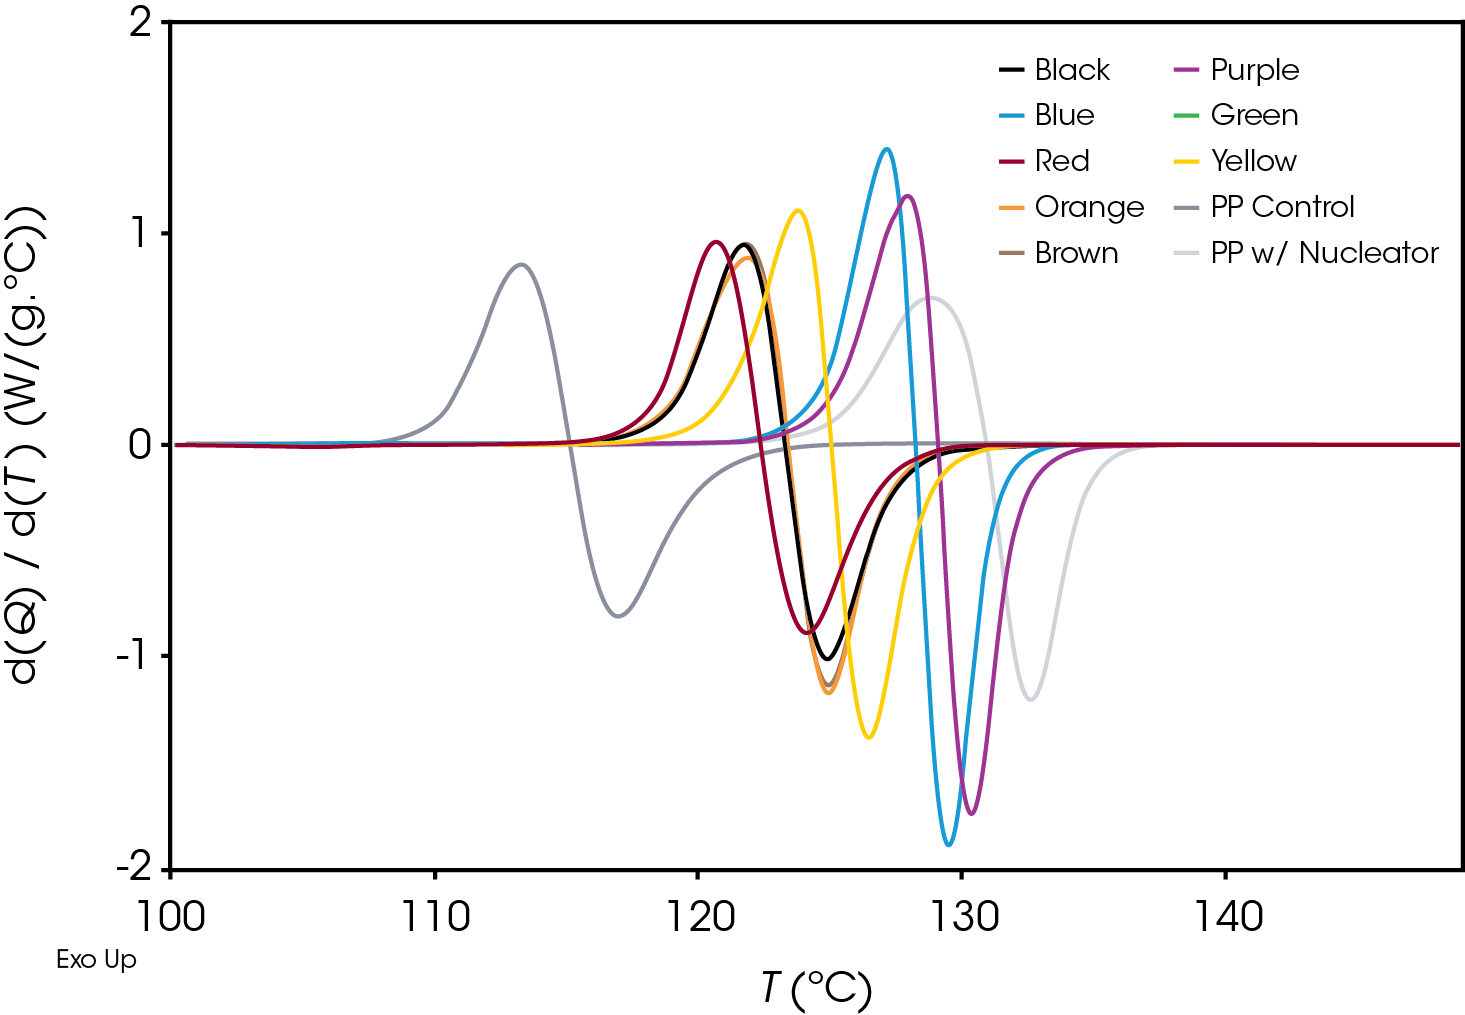
Plotting the derivative of the heat flow with respect to temperature (Figure 6) also illustrates the differences in the samples and the position and shape of the curves and can be used as a diagnostic to determine if further kinetics analysis is needed.
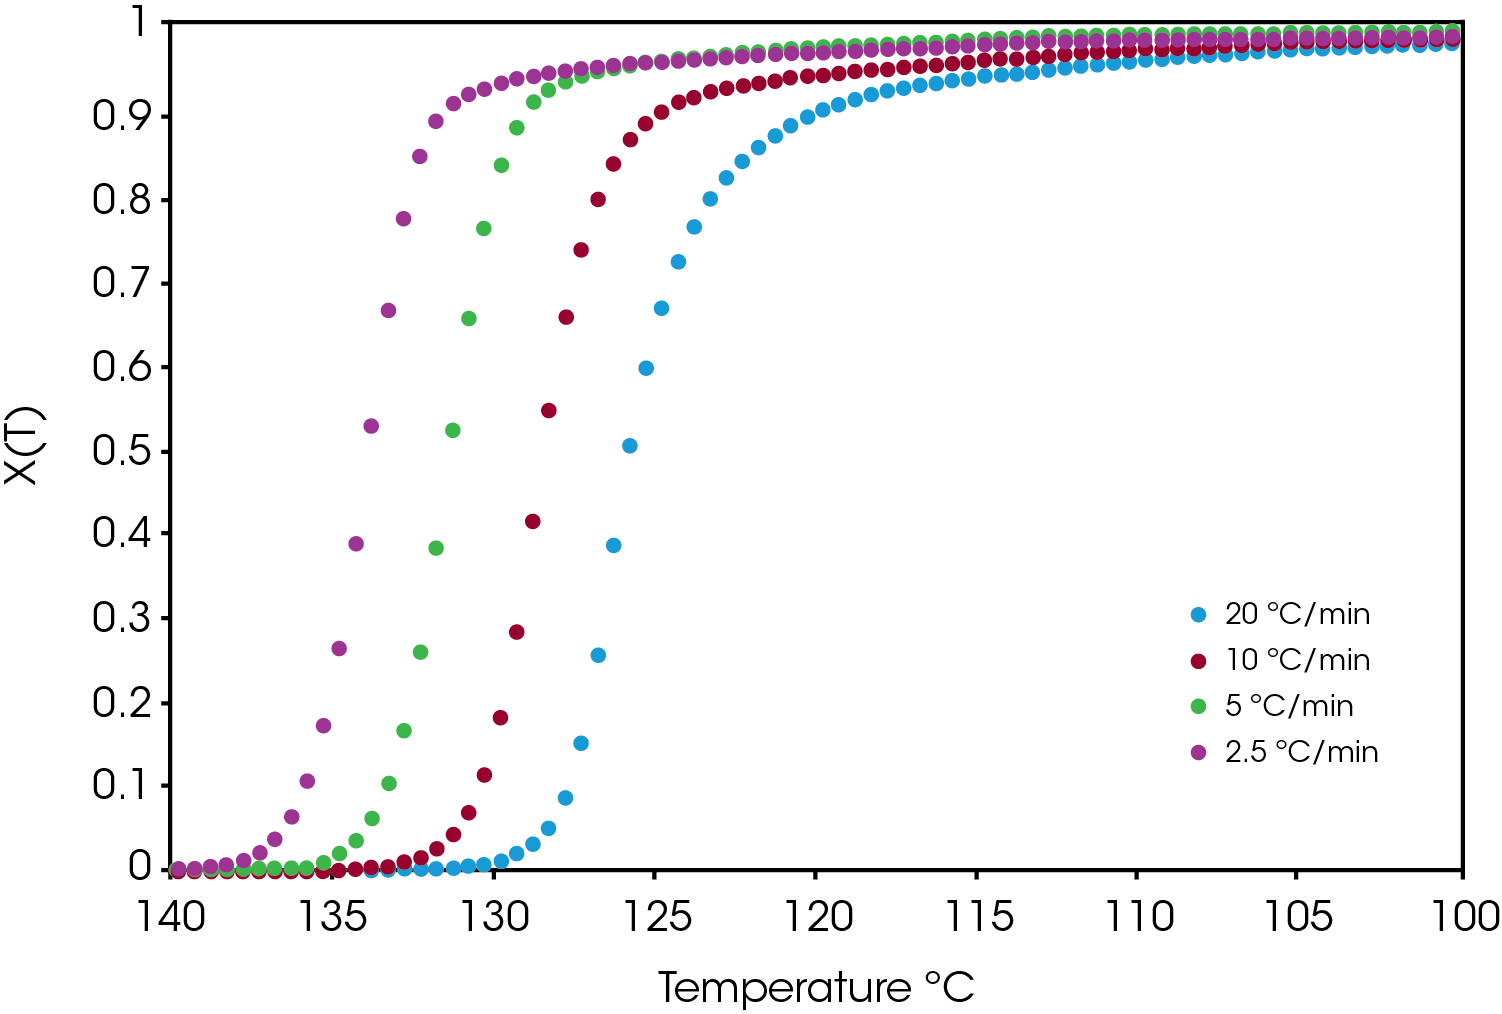
An example of the relative crystallinity (X(t)) as function of temperature calculated using Equation 1 of the green sample is shown in Figure 7.
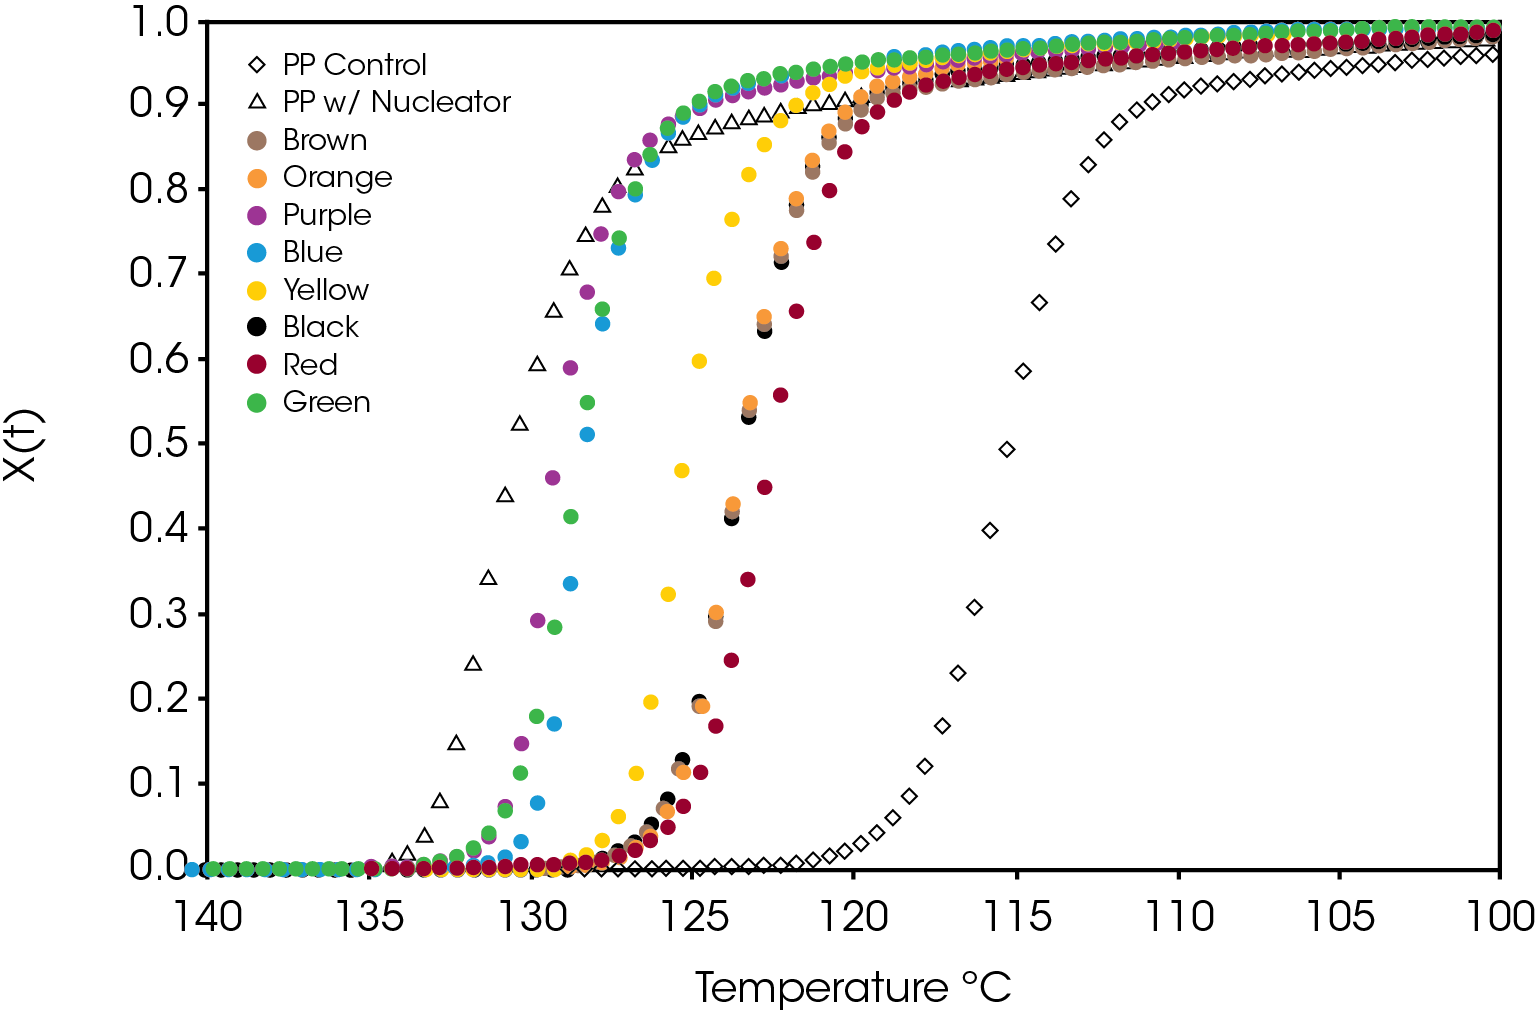
A comparison of the relative crystallinity at a cooling rate of 10 °C /min for each sample is shown in Figure 8. All the samples fall between the reference PP and the sample containing the nucleator demonstrating the effect of the colorants on crystallization presuming that the resin formulation in the caps is the same.
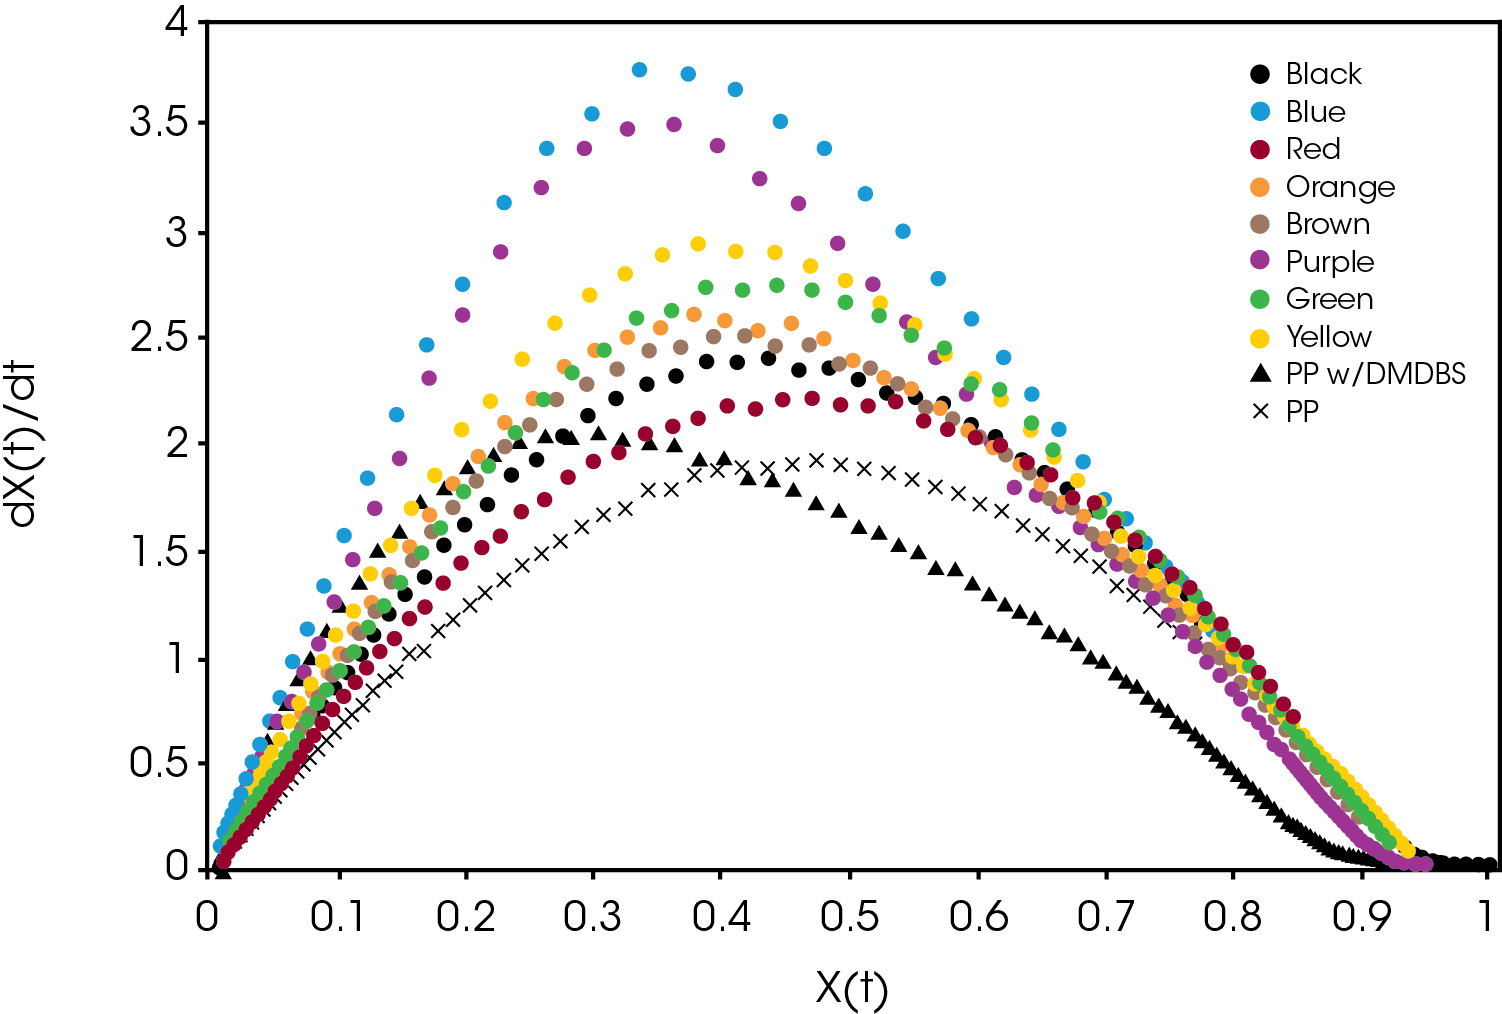
A plot of the crystallization rate as function of conversion is shown in Figure 9. There are significant differences in the rates particularly in the blue and purple samples. Several of the samples reach a higher crystallization rate than the PP reference containing the nucleator.
An example comparison of the Avrami data fit for each of the samples at a cooling rate of 10 °C / min is shown in Figure 10. The slope of the line is the Avrami geometric exponent n, the position of the line relates to the rate of crystallization – moving right to left is a faster crystallization rate.
The Avrami constant n is roughly correlated to the crystal growth geometry summarized in Table 2.
Table 2. Simplistic Interpretation of Avrami Exponent n
| Value of n | Growth Geometry |
|---|---|
| 1≤n≤2 | 1-dimensional, rod like |
| 2≤n≤3 | 2-dimensional, disc like |
| 3≤n≤4 | 3-dimensional, spherulitic |
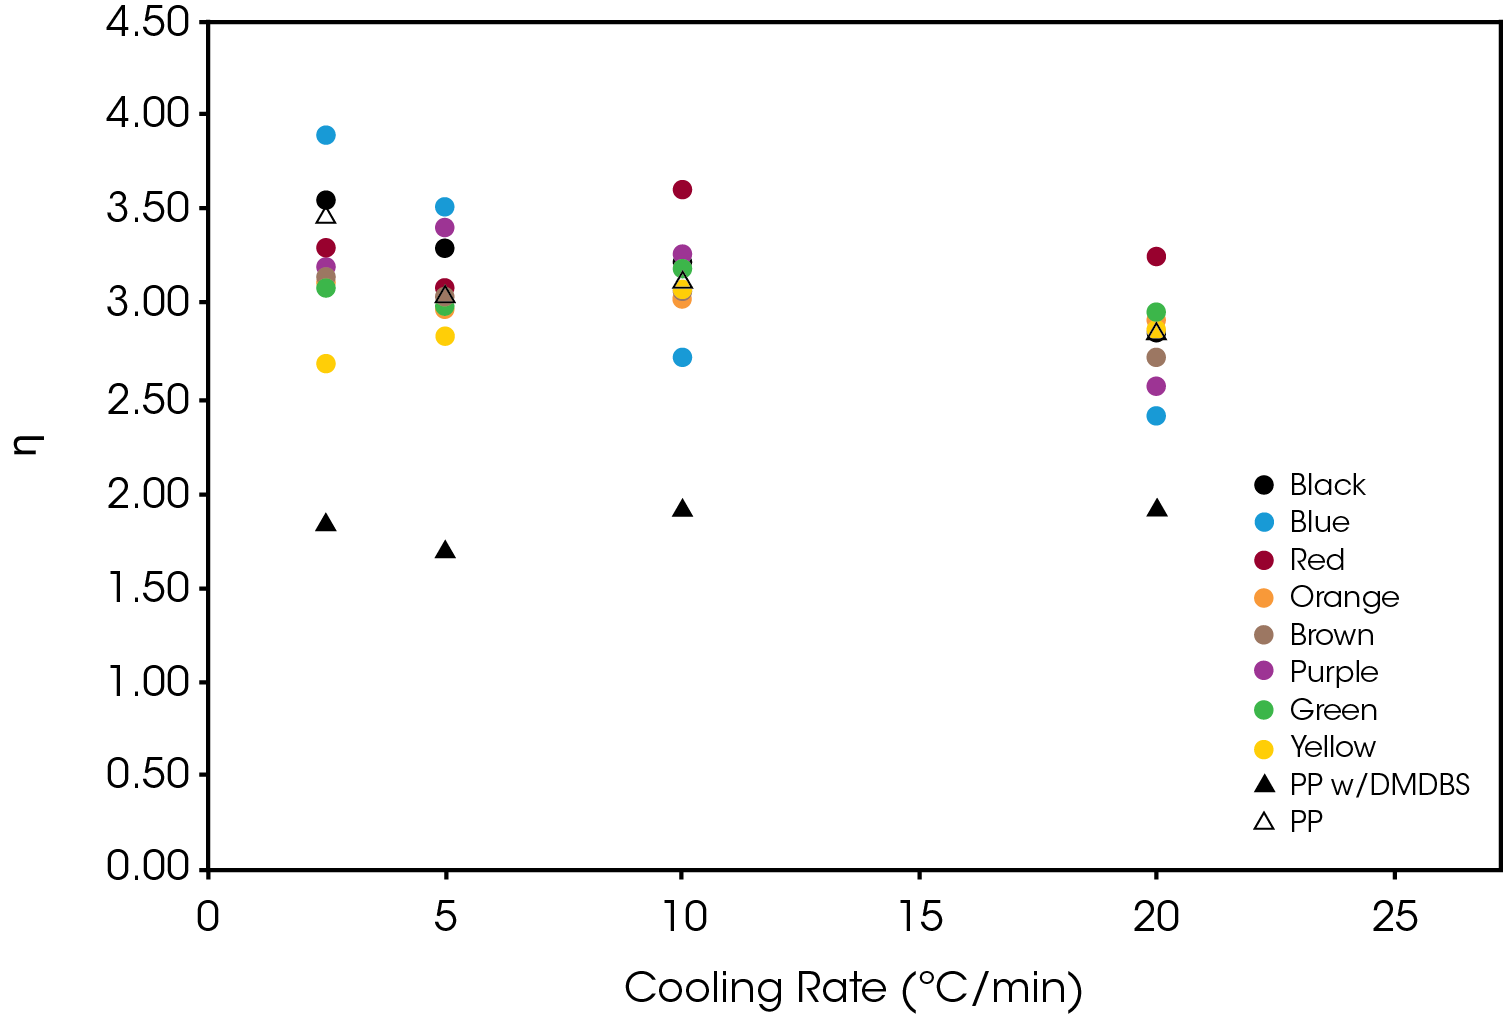
For Regime I (Figure 11), the values of n were between 2.5 and 4 with the notable exception being the PP containing the nucleating agent DMDBS which was approximately 2. Some of the samples showed a decrease in n with increasing heating rate (blue, purple, PP reference) with the others remaining approximately constant.
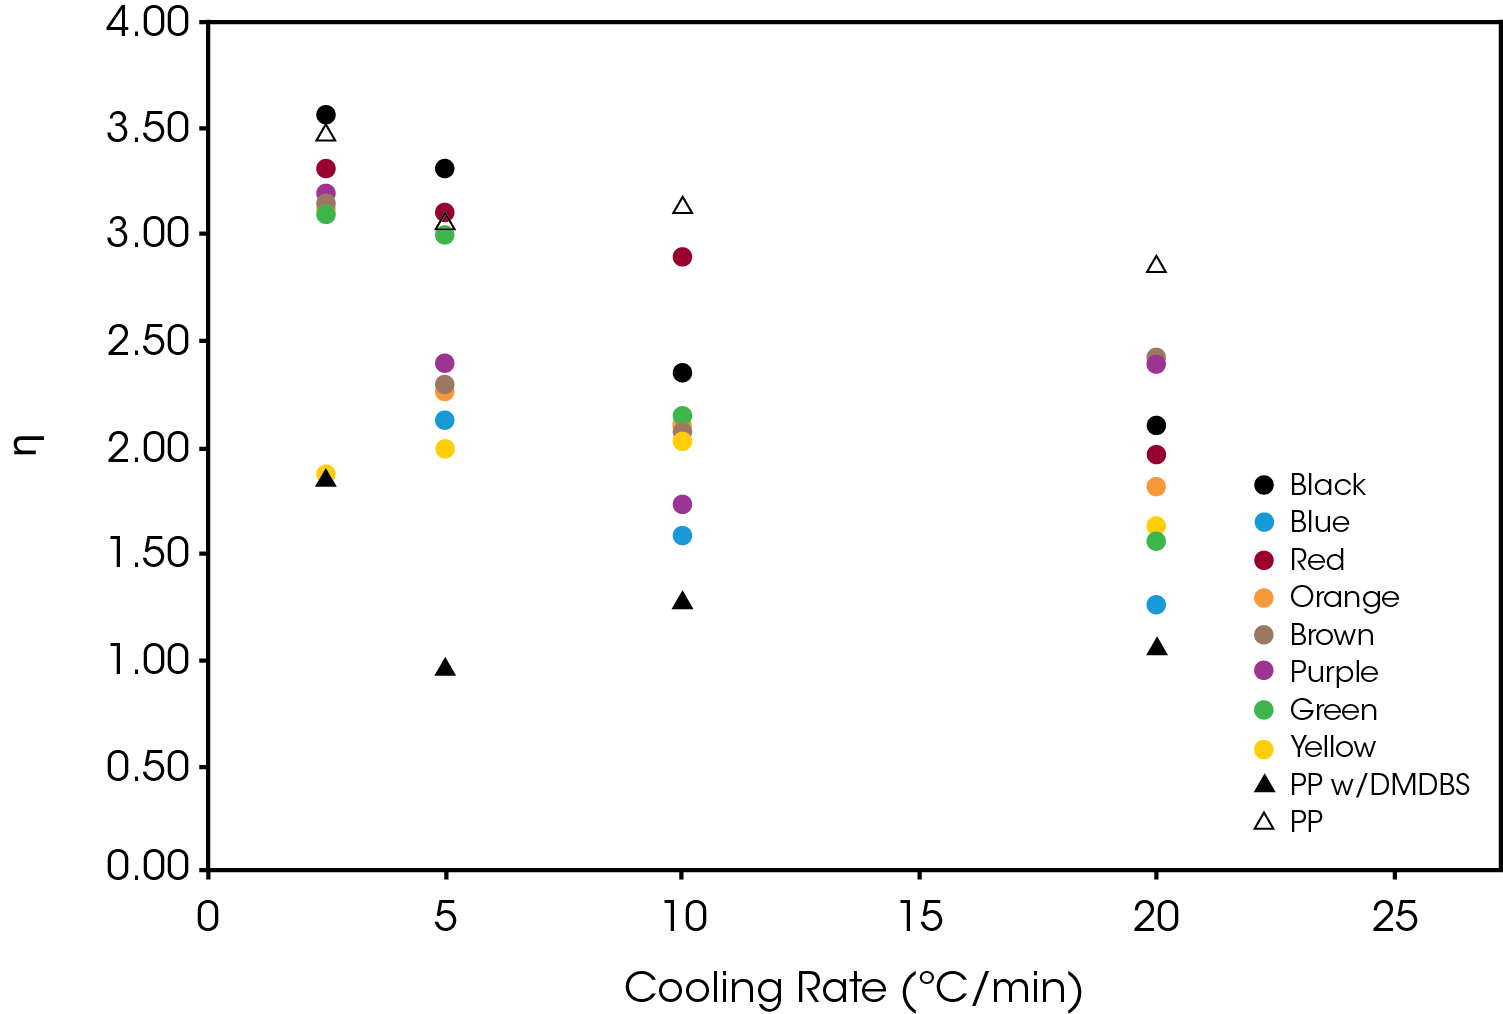
For Regime II (Figure 12) most of the samples showed a decrease from 3 to 2 with increasing heating rate. Yellow and PP with DMDBS remaining approximately constant at 2.
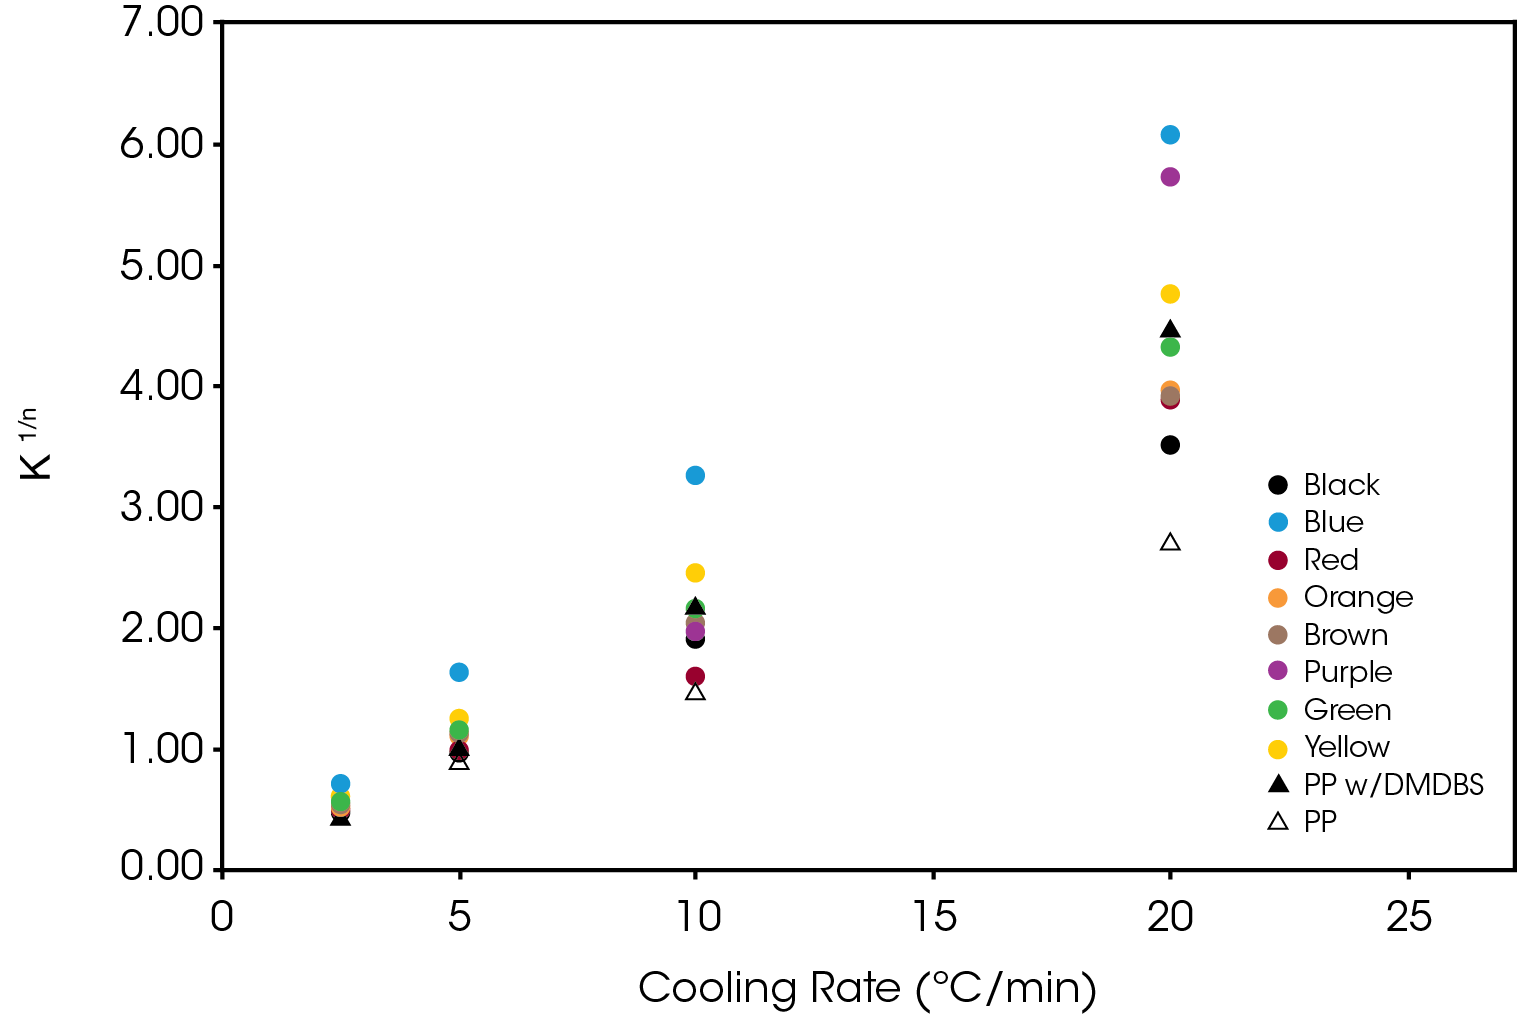
The effect of the colorant on the normalized Avrami rate constant (k1/n) is shown in Figure 13 for Regime I. The divergence increase as a function of cooling rate demonstrates the potential effect on processing as cooling rates in mold tools would be substantially higher than the DSC experimental conditions.
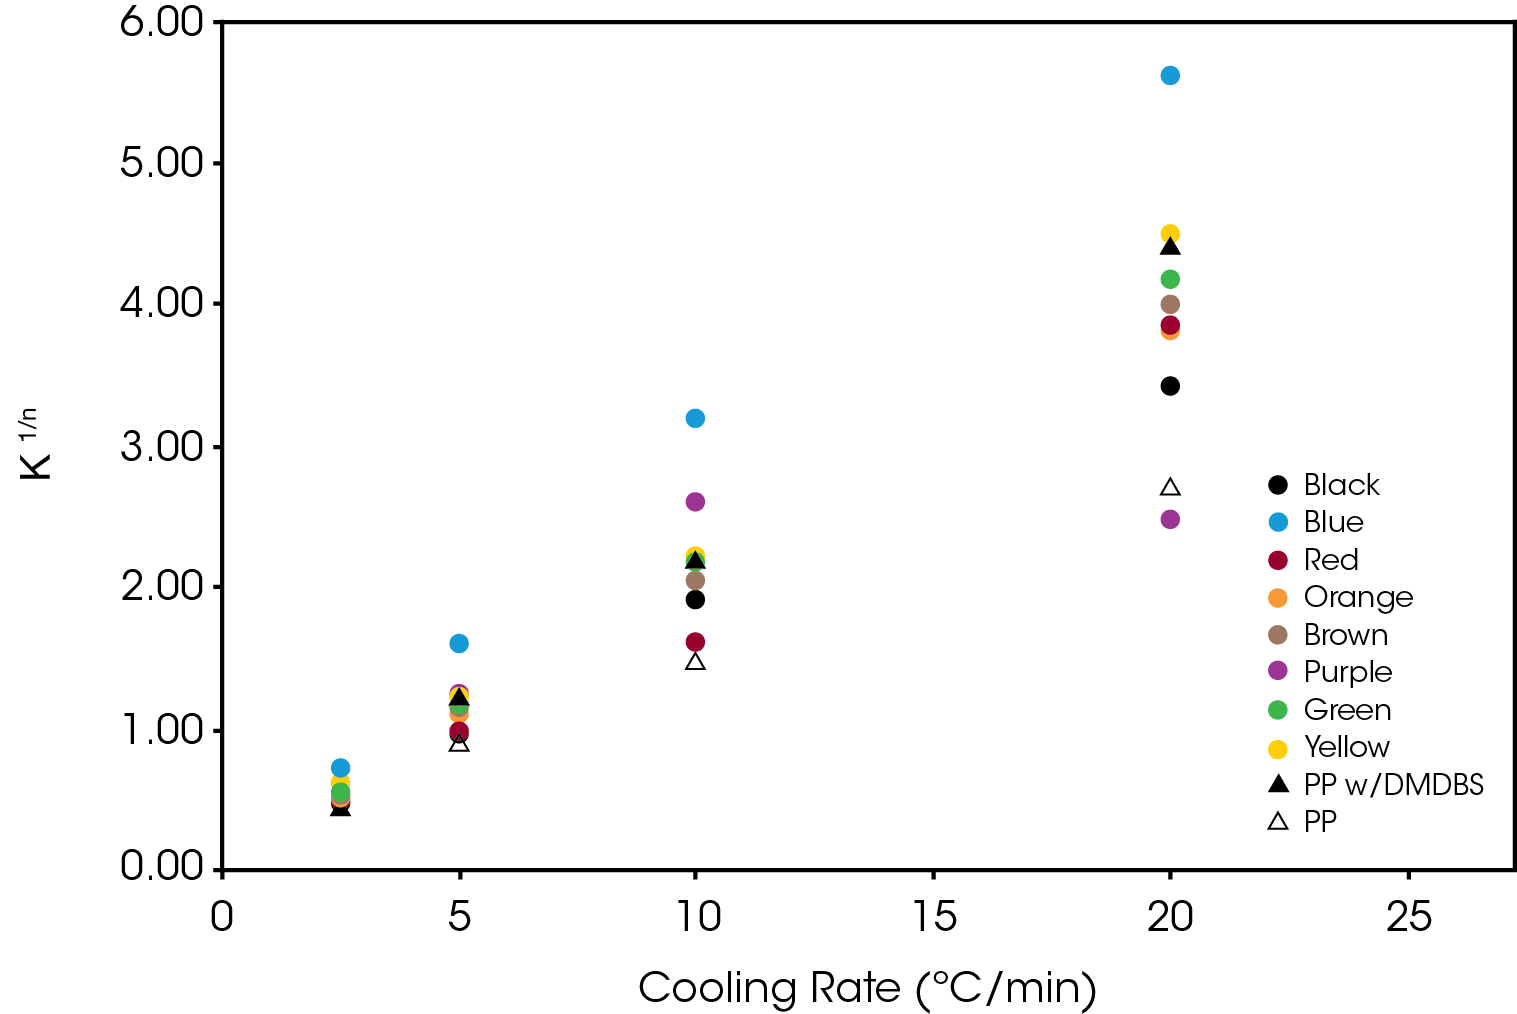
The normalized Avrami rate constant for Regime II is shown in Figure 14.
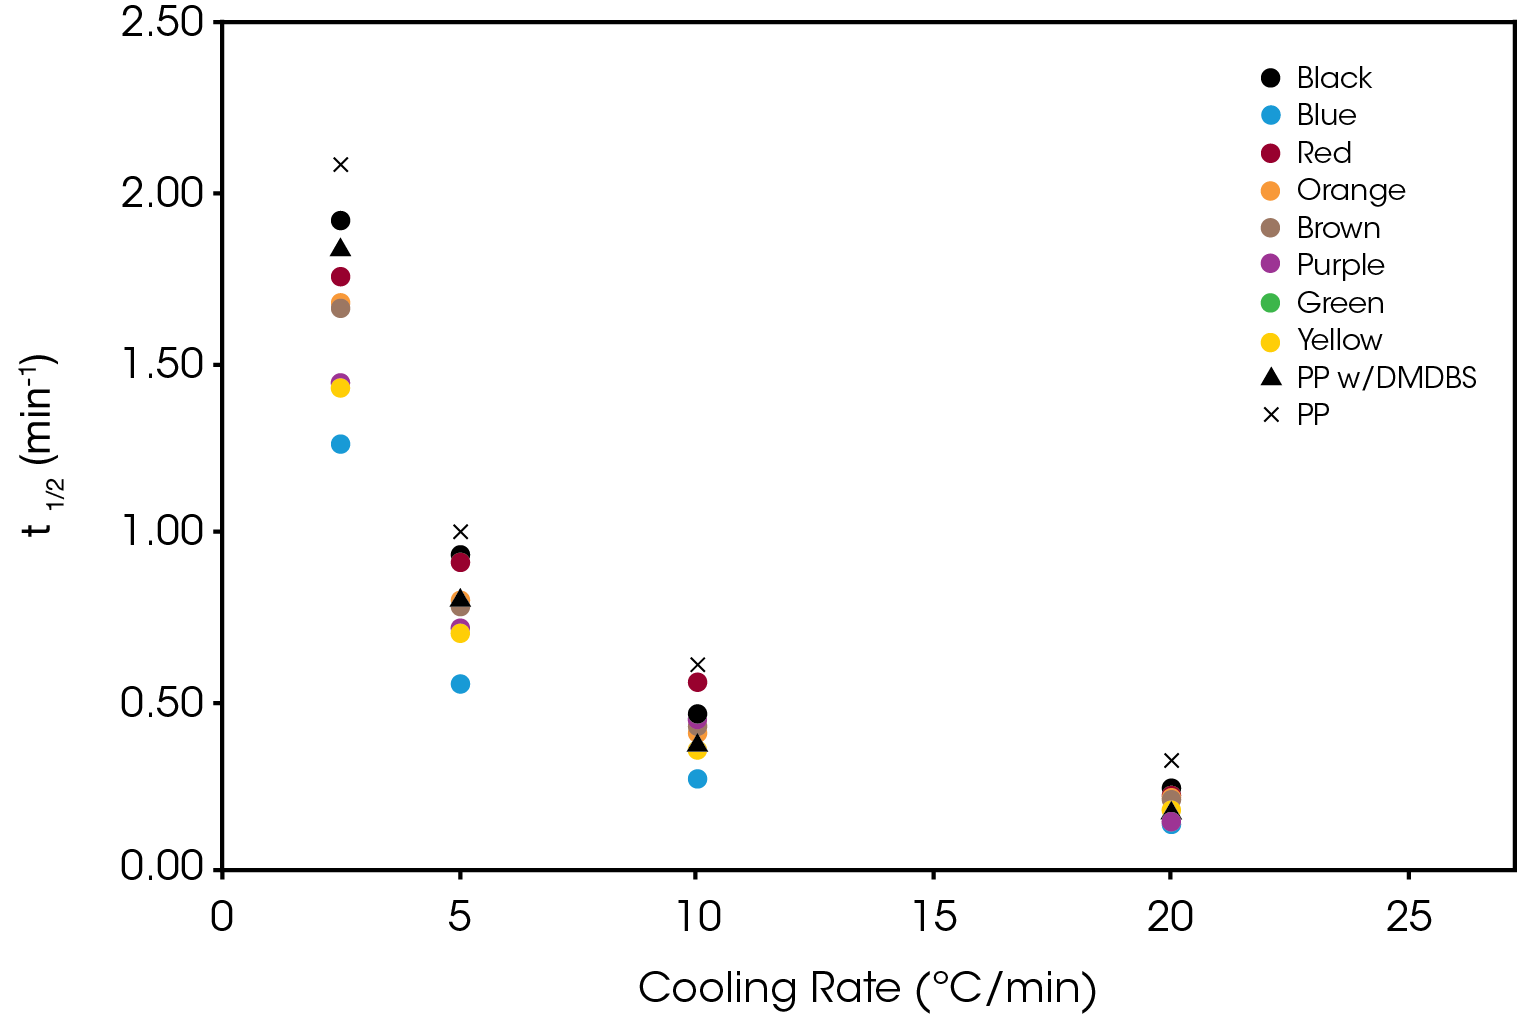
The crystallization half-time calculated from Equation 5 is shown in Figure 15.
The activation energy (ΔE) was calculated using Equation 6 with ψ = k1/n. The results are summarized in Table 3. All samples show a significantly lower activation energy than the reference PP with blue and purple approaching the activation energy of the PP with DMDBS. Purple also shows a large change in activation energy from Regime I to Regime II.
Table 3. Activation Energy Calculated from Normalized Avrami Rate Constant
| Sample | Regime I ΔE (kJ/mol) | r2 | Regime II ΔE (kJ/mol) | r2 |
|---|---|---|---|---|
| Black | -273.2 | 0.994 | -270.3 | 0.993 |
| Blue | -457.7 | 0.993 | -443.7 | 0.990 |
| Red | -284.0 | 0.992 | -282.9 | 0.992 |
| Orange | -309.5 | 0.987 | -304.1 | 0.986 |
| Brown | -286.3 | 0.995 | -288.2 | 0.995 |
| Purple | -475.7 | 0.986 | -327.2 | 0.935 |
| Green | -331.5 | 0.999 | -326.9 | 0.999 |
| Yellow | -345.6 | 0.997 | -335.6 | 0.999 |
| PP Ref | -220.6 | 0.996 | – | – |
| PP /w DMDBS | -521.3 | 0.997 | -502.8 | 0.987 |
The activation energy was also calculated using the method of Friedman [5] and shown in Figure 16. Purple and blue show large increases in activation energy as function of conversion. This is also observed in the PP sample with the nucleator as expected. This increase in activation energy is likely due to the reduction of crystal growth due to impingement of proximal structure and primary nucleation in interstitial areas of the crystal domains. The other samples show increasing or relatively constant activation energies as crystallization proceeds.
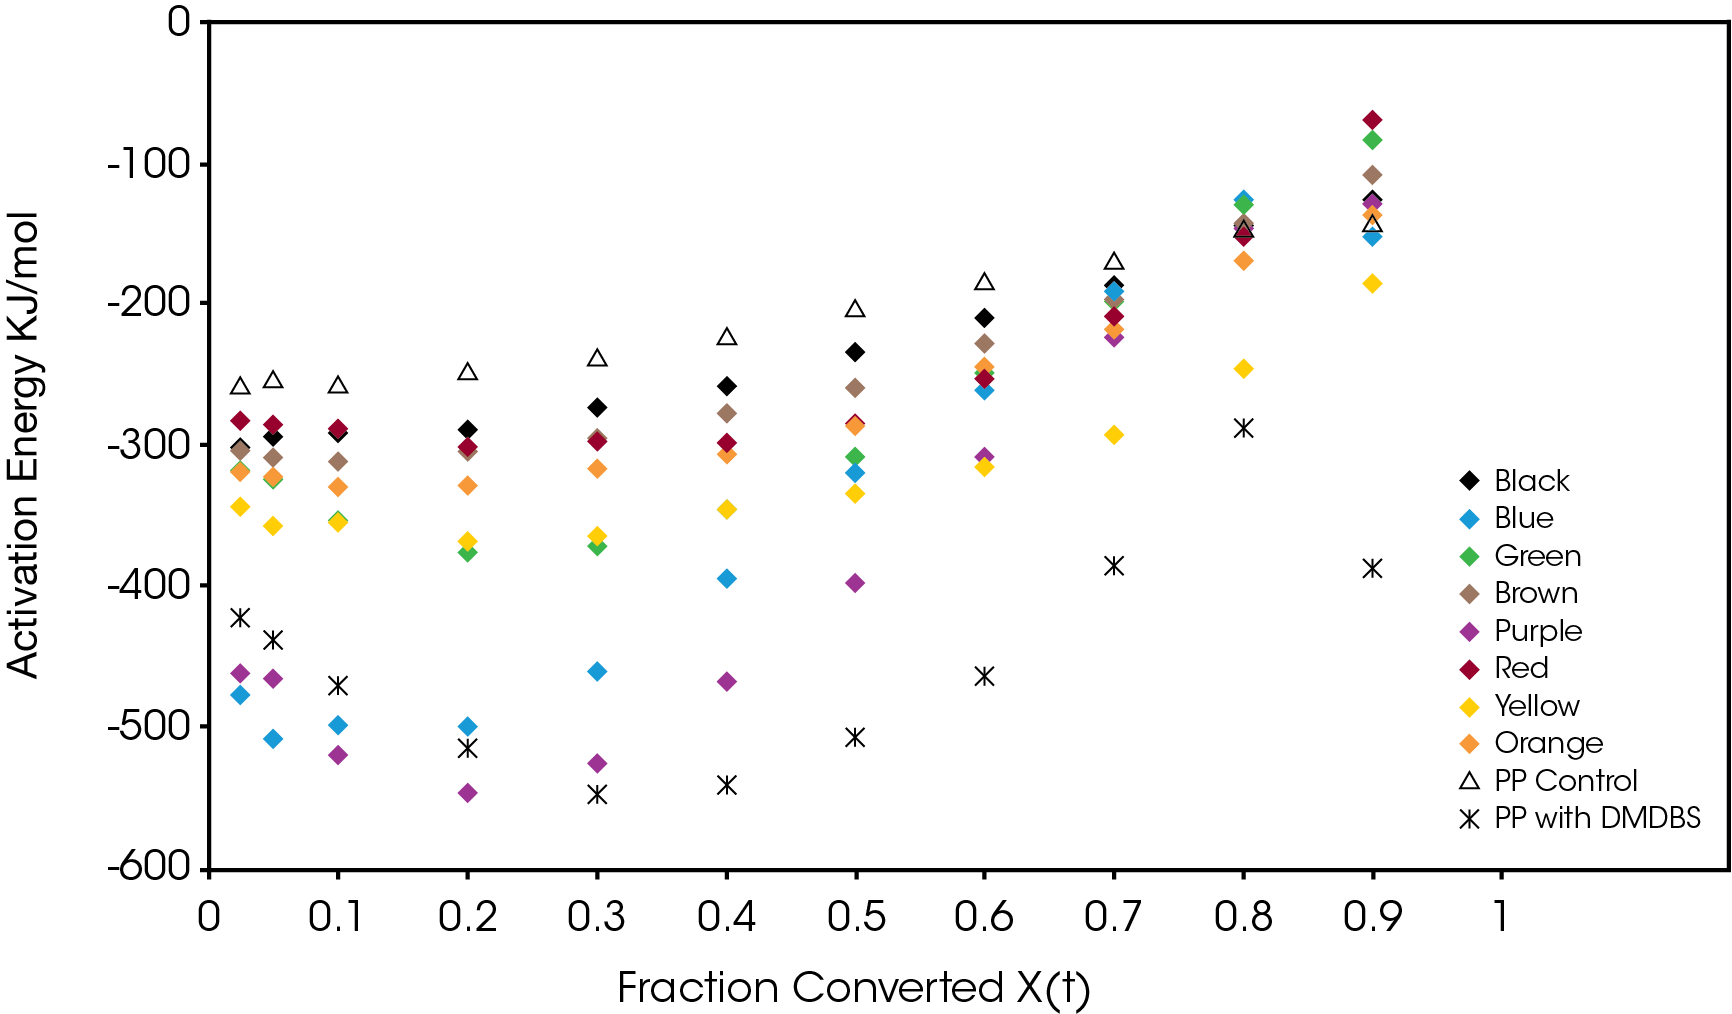
Table 4. Avrami Parameters Regime I
| Sample | Cooling Rate °C / min | n | k (min-1) |
|---|---|---|---|
| Black | 20 | 2.90 | 37.84 |
| 10 | 3.22 | 7.99 | |
| 5 | 3.31 | 0.84 | |
| 2.5 | 3.56 | 0.07 | |
| Blue | 20 | 2.42 | 78.54 |
| 10 | 2.74 | 25.26 | |
| 5 | 3.52 | 5.67 | |
| 2.5 | 3.91 | 0.28 | |
| Red | 20 | 3.27 | 84.68 |
| 10 | 3.61 | 5.49 | |
| 5 | 3.10 | 0.91 | |
| 2.5 | 3.31 | 0.11 | |
| Orange | 20 | 2.92 | 55.84 |
| 10 | 3.04 | 10.41 | |
| 5 | 2.99 | 1.34 | |
| 2.5 | 3.14 | 0.13 | |
| Brown | 20 | 2.73 | 42.05 |
| 10 | 3.07 | 8.87 | |
| 5 | 3.03 | 1.46 | |
| 2.5 | 3.16 | 0.14 | |
| Purple | 20 | 2.59 | 90.87 |
| 10 | 3.27 | 9.19 | |
| 5 | 3.43 | 2.14 | |
| 2.5 | 3.21 | 0.21 | |
| Green | 20 | 2.95 | 74.83 |
| 10 | 3.20 | 11.67 | |
| 5 | 3.00 | 1.56 | |
| 2.5 | 3.10 | 0.18 | |
| Yellow | 20 | 2.86 | 86.28 |
| 10 | 3.08 | 16.01 | |
| 5 | 2.85 | 1.86 | |
| 2.5 | 2.70 | 0.26 | |
| PP Ref | 20 | 1.94 | 18.17 |
| 10 | 1.93 | 4.50 | |
| 5 | 1.71 | 1.00 | |
| 2.5 | 1.85 | 0.22 | |
| PP/ w DMDBS | 20 | 2.86 | 17.09 |
| 10 | 3.13 | 3.28 | |
| 5 | 3.07 | 0.68 | |
| 2.5 | 3.48 | 0.05 |
Table 5. Avrami Parameters Regime II
| Sample | Cooling Rate °C / min | n | k (min-1) |
|---|---|---|---|
| Black | 20 | 2.11 | 13.32 |
| 10 | 2.35 | 4.52 | |
| 5 | 3.31 | 0.84 | |
| 2.5 | 3.56 | 0.07 | |
| Blue | 20 | 1.26 | 8.80 |
| 10 | 1.58 | 6.30 | |
| 5 | 2.13 | 2.74 | |
| 2.5 | 3.14 | 0.35 | |
| Red | 20 | 1.97 | 14.30 |
| 10 | 2.90 | 3.90 | |
| 5 | 3.10 | 0.91 | |
| 2.5 | 3.31 | 0.11 | |
| Orange | 20 | 1.82 | 11.46 |
| 10 | 2.11 | 4.93 | |
| 5 | 2.26 | 1.23 | |
| 2.5 | 3.14 | 0.13 | |
| Brown | 20 | 1.62 | 9.49 |
| 10 | 2.07 | 4.37 | |
| 5 | 2.30 | 1.36 | |
| 2.5 | 3.16 | 0.14 | |
| Purple | 20 | 2.39 | 8.70 |
| 10 | 1.73 | 5.24 | |
| 5 | 2.40 | 1.72 | |
| 2.5 | 3.21 | 0.21 | |
| Green | 20 | 1.56 | 9.29 |
| 10 | 2.15 | 5.27 | |
| 5 | 3.00 | 1.56 | |
| 2.5 | 3.10 | 0.18 | |
| Yellow | 20 | 1.63 | 11.56 |
| 10 | 2.03 | 5.03 | |
| 5 | 1.99 | 1.50 | |
| 2.5 | 1.86 | 0.39 | |
| PP Ref | 20 | 1.06 | 4.79 |
| 10 | 1.27 | 2.68 | |
| 5 | 0.95 | 1.22 | |
| 2.5 | 1.85 | 0.22 | |
| PP/ w DMDBS | 20 | 2.86 | 17.09 |
| 10 | 3.13 | 3.28 | |
| 5 | 3.07 | 0.68 | |
| 2.5 | 3.48 | 0.05 |
Conclusions
The effect of colorants on the crystallization of PP was evaluated by DSC using non-isothermal crystallization kinetics. Significant differences in crystallizaiton rate were observed with most of the samples developing faster crystallization rates than the reference PP containing the nucleator and all samples faster than the reference PP. Each color sample had lower activation energies than the reference PP and blue and purple have activation energies that approach the PP containing a nucleator. The correlation of crystallization with mechanical properties including modulus, clarity, tensile strength, enlongation at break, and impact strength makes DSC an important tool in diagnostics of potential performance and processing issues in PP and other plastics. Understanding the antagonistic and synergestic effects of combinations of additives, fillers, and pigments becomes more important as mechanical recycling of plastics increases due to environmental concerns. The heterogeneity of recycle streams will neccesitate more DSC testing which makes the DSC X3 indispensible for laboratories supporting renewable plastics resources.
TA Instruments Discovery X3® DSC improves the efficiency of the kinetics experiment three-fold by allowing the analyst to run three samples at once. In this work ten samples were evaluated at four cooling rates for a total of forty samples. Normally sixty hours of instrument time would be required for this experment but data collection was completed in twenty hours. The X3 DSC is an invaluable tool to researchers running a large number of samples, evaluating reproducibility or including a reference or standard in the same run. Other applications include optimizing additive formulations and comparing ‘good’ and ‘bad’ samples simultaneously. This is especially important for laboratories doing customer support as there is nearly always an element of time ugency.
R&D, support, plant, and contract laboratories will benefit from improved efficiency and cost savings by choosing the Discovery X3 as their front-line DSC.
References
-
- Browne J, “TA393 – Comparison of Crystallization Behavior of Different Colored Parts Made from Polypropylene Using a Single DSC Experiment,” TA Instruments, New Castle, 2017.
- M. Barczewski, “Effect of Quinacridone Pigments on Properies of Injection Molded Isotactic Polypropylene,” International Journal of Polymer Science, 2017.
- Y. Mubarak, “Effect of Nucleating Agents and Pigments on Crystallization, Morphology, and Mechanical Properties of Polypropylene,” Plastics, Rubber, and Composites, vol. 29, no. 7, pp. 307-315, 2000.
- P. Supaphol, “Non-isothermal Melt Crystallization Kinetics for Three Aromatic Polyesters,” Thermochimica Acta, vol. 406, pp. 207-220, 2003.
- X. Zhang, “Applications of Kinetic Methods in Thermal Analysis: A Review,” Engineered Science, vol. 14, pp. 1-13, 2021.
- Browne, J, “TA 395 Assessing the Effects of Process Temperature on Crystallization Kinetics of Polyphenylene Sulfide Utilizing Differential Scanning Calorimetry (DSC)”.
Acknowledgement
This paper was written by James Browne, Senior Scientist at TA Instruments.
Click here to download the printable version of this application note.

