Keywords: Evolved Gas Analysis, EGA, TGA/FTIR, Thermogravimetric analysis, TGA, FTIR, Fourier Transform Infrared Spectroscopy
TA464
Introduction
TGA/FTIR is a powerful tool for evaluating the composition of off-gases evolved during the TGA experiment. Over time, the generated decomposition products may contaminate the windows of the gas cell. The contamination will be evident in the single beam spectrum and maybe the 100% line. While the contaminant may be ratioed out of the spectrum, eventually the performance of the spectrometer will be degraded, and the windows will have to be cleaned or replaced. Evaluation of the single beam and 100% line is important in any FTIR analysis and especially in TGA/FTIR.
Follow the manufacturers suggestions on cleaning or replacing the windows and safe disassembly of the gas cell. Handle the windows carefully as they can be damaged with improper handling or storage.
Evaluating the Single Beam
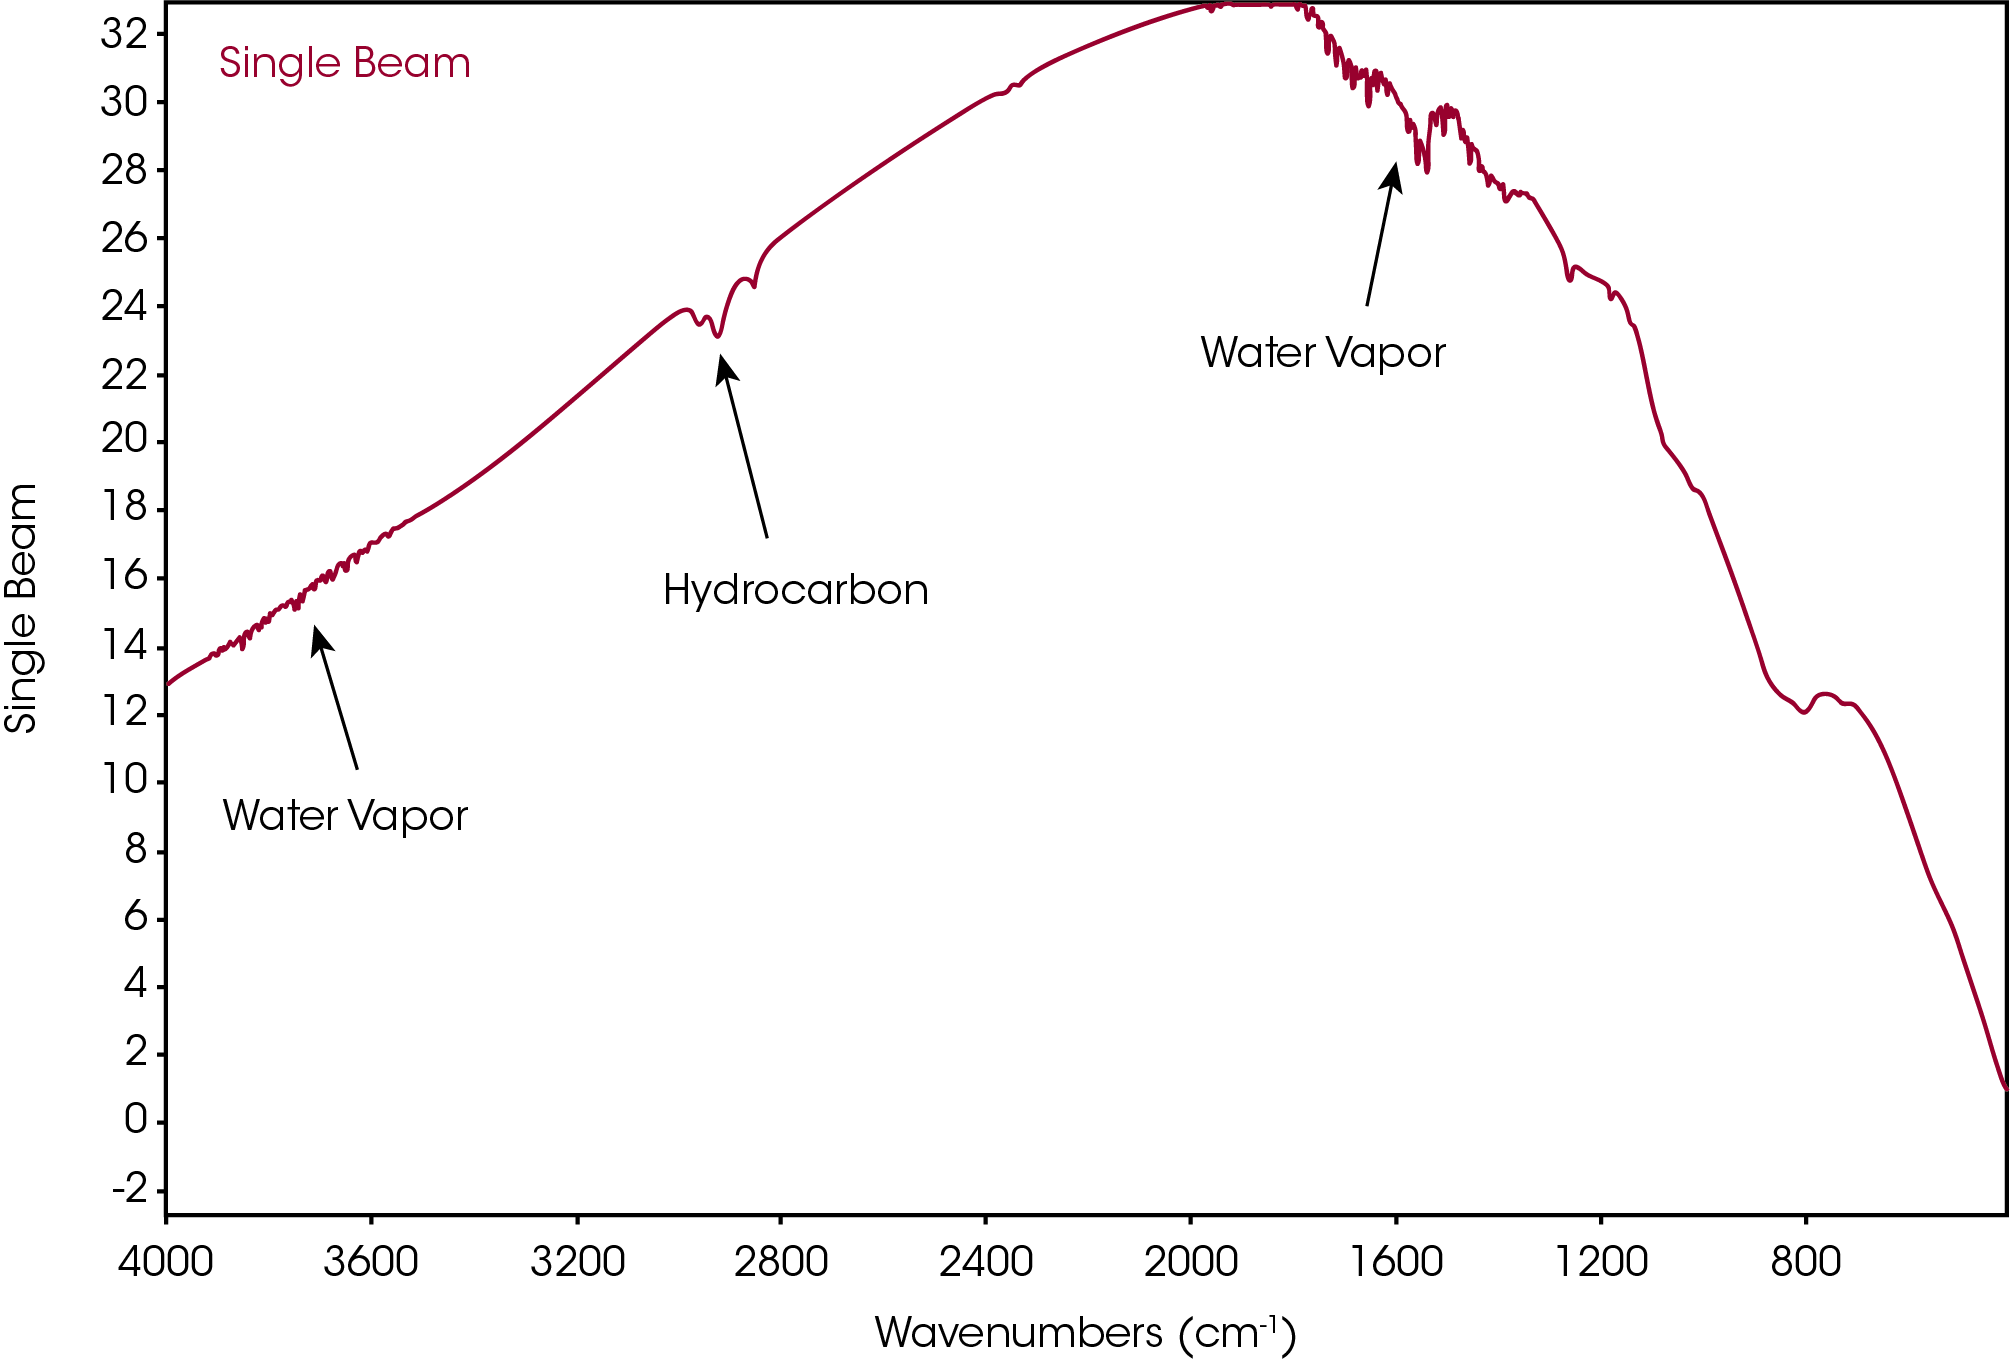
The single beam spectrum with no sample in the gas cell (no sample in a transmission cell) is a plot of the detector response as function of wavenumber. The background data collection before sample collection is a single beam spectrum. It is important to know what a ‘normal’ single beam for your spectrometer looks like. An example of a normal single beam is shown in Figure 1. Although there is some water vapor and some hydrocarbon contamination, these features will be ratioed out of the final sample spectrum and do not present a problem.
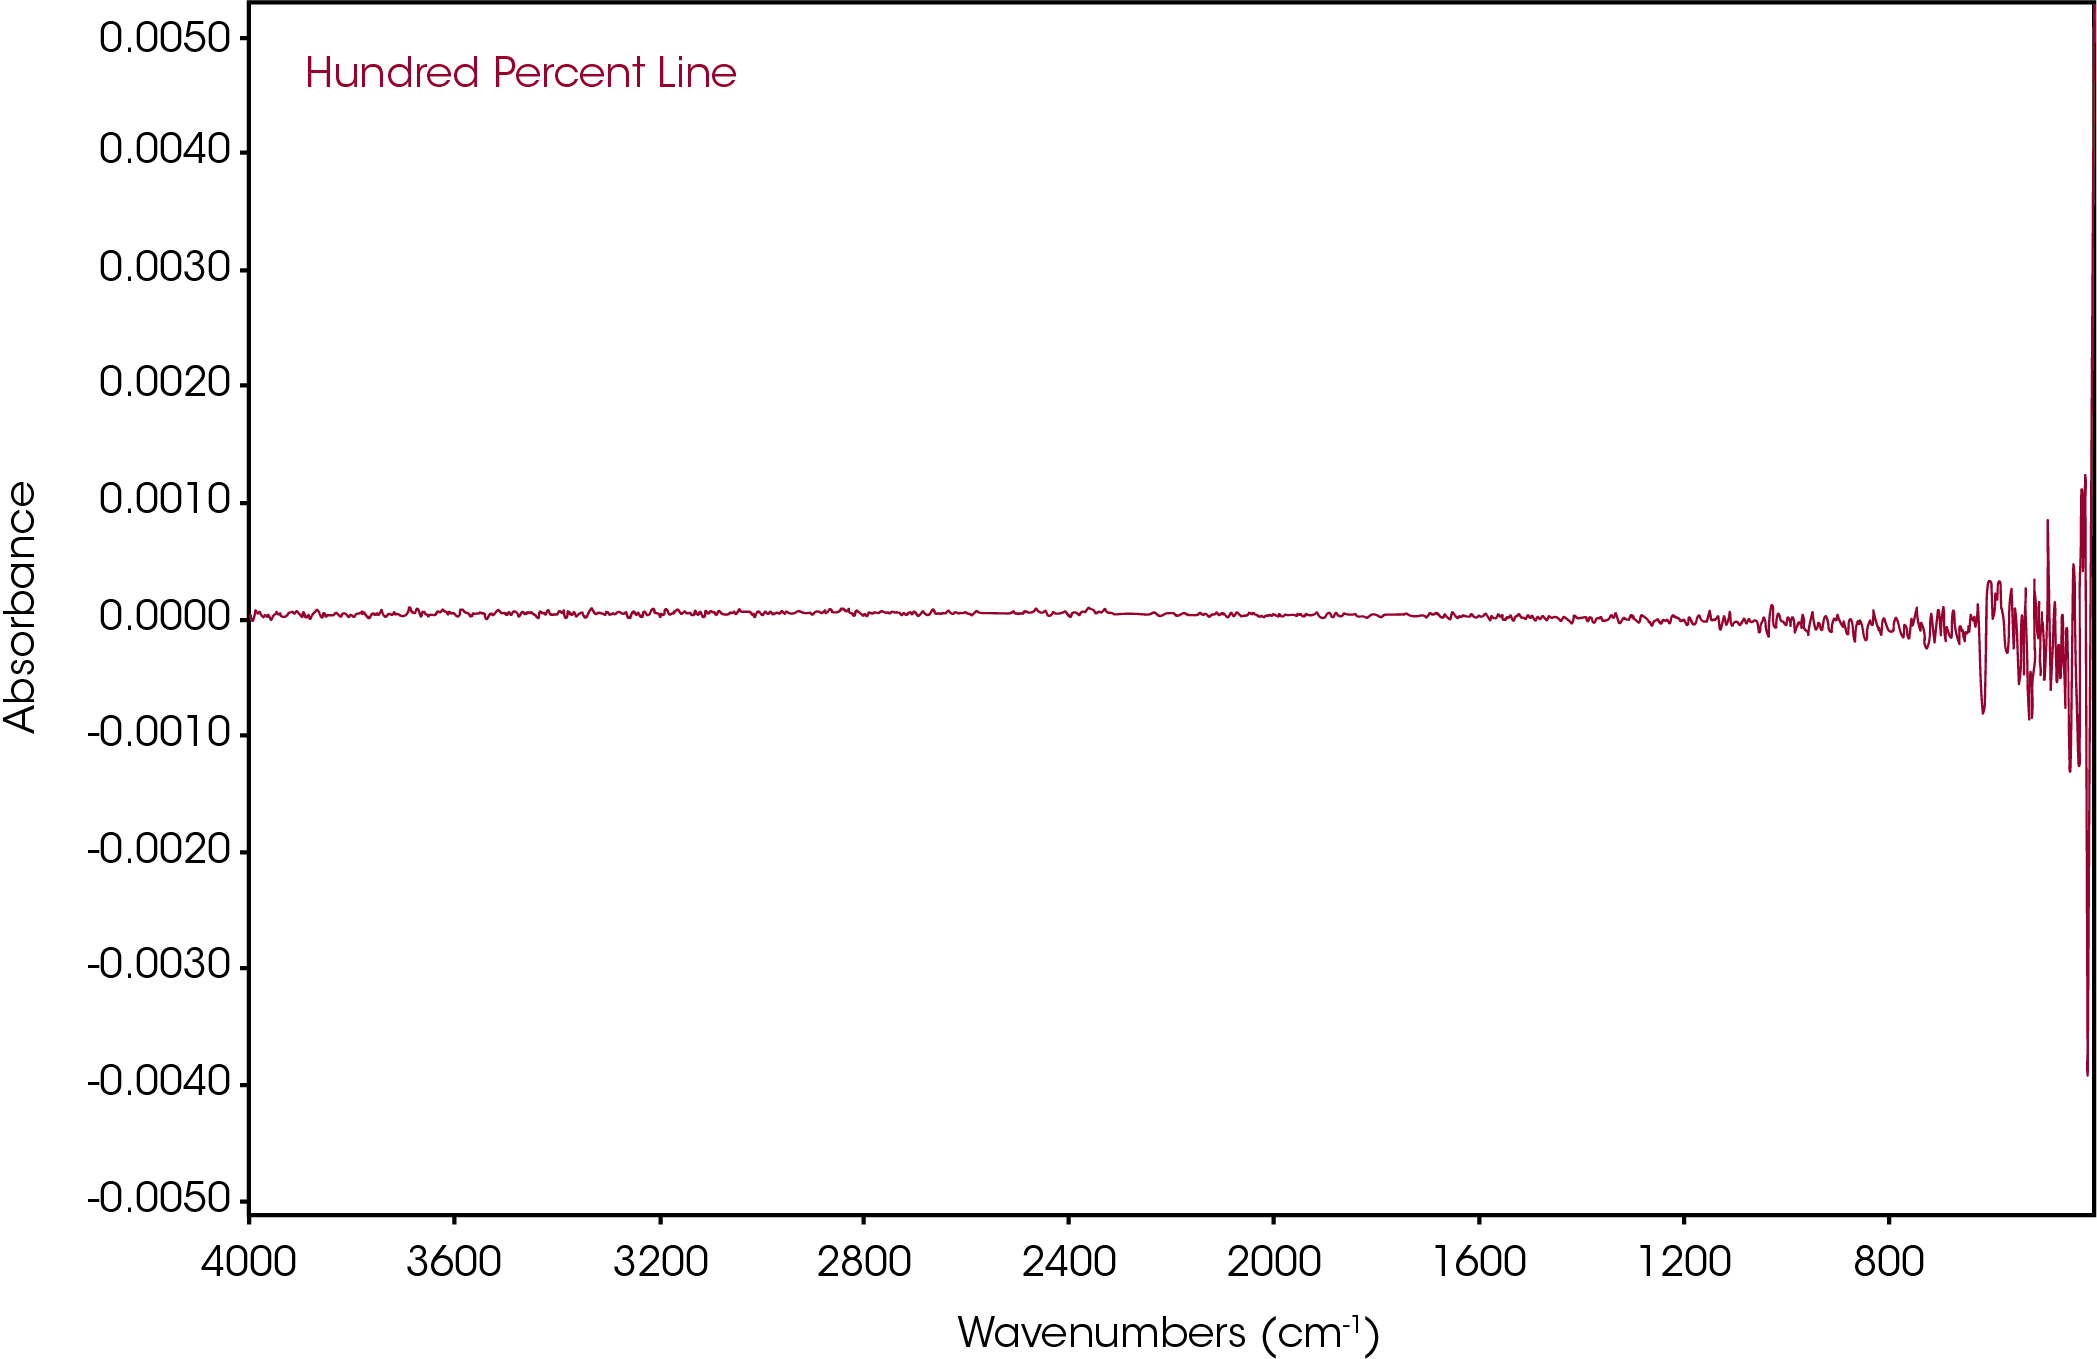
After collecting the single beam, collect another single beam as a sample run to generate a 100% line. This line should be free of any absorbances and be reasonably flat. An example of a normal 100% line is shown in Figure 2.
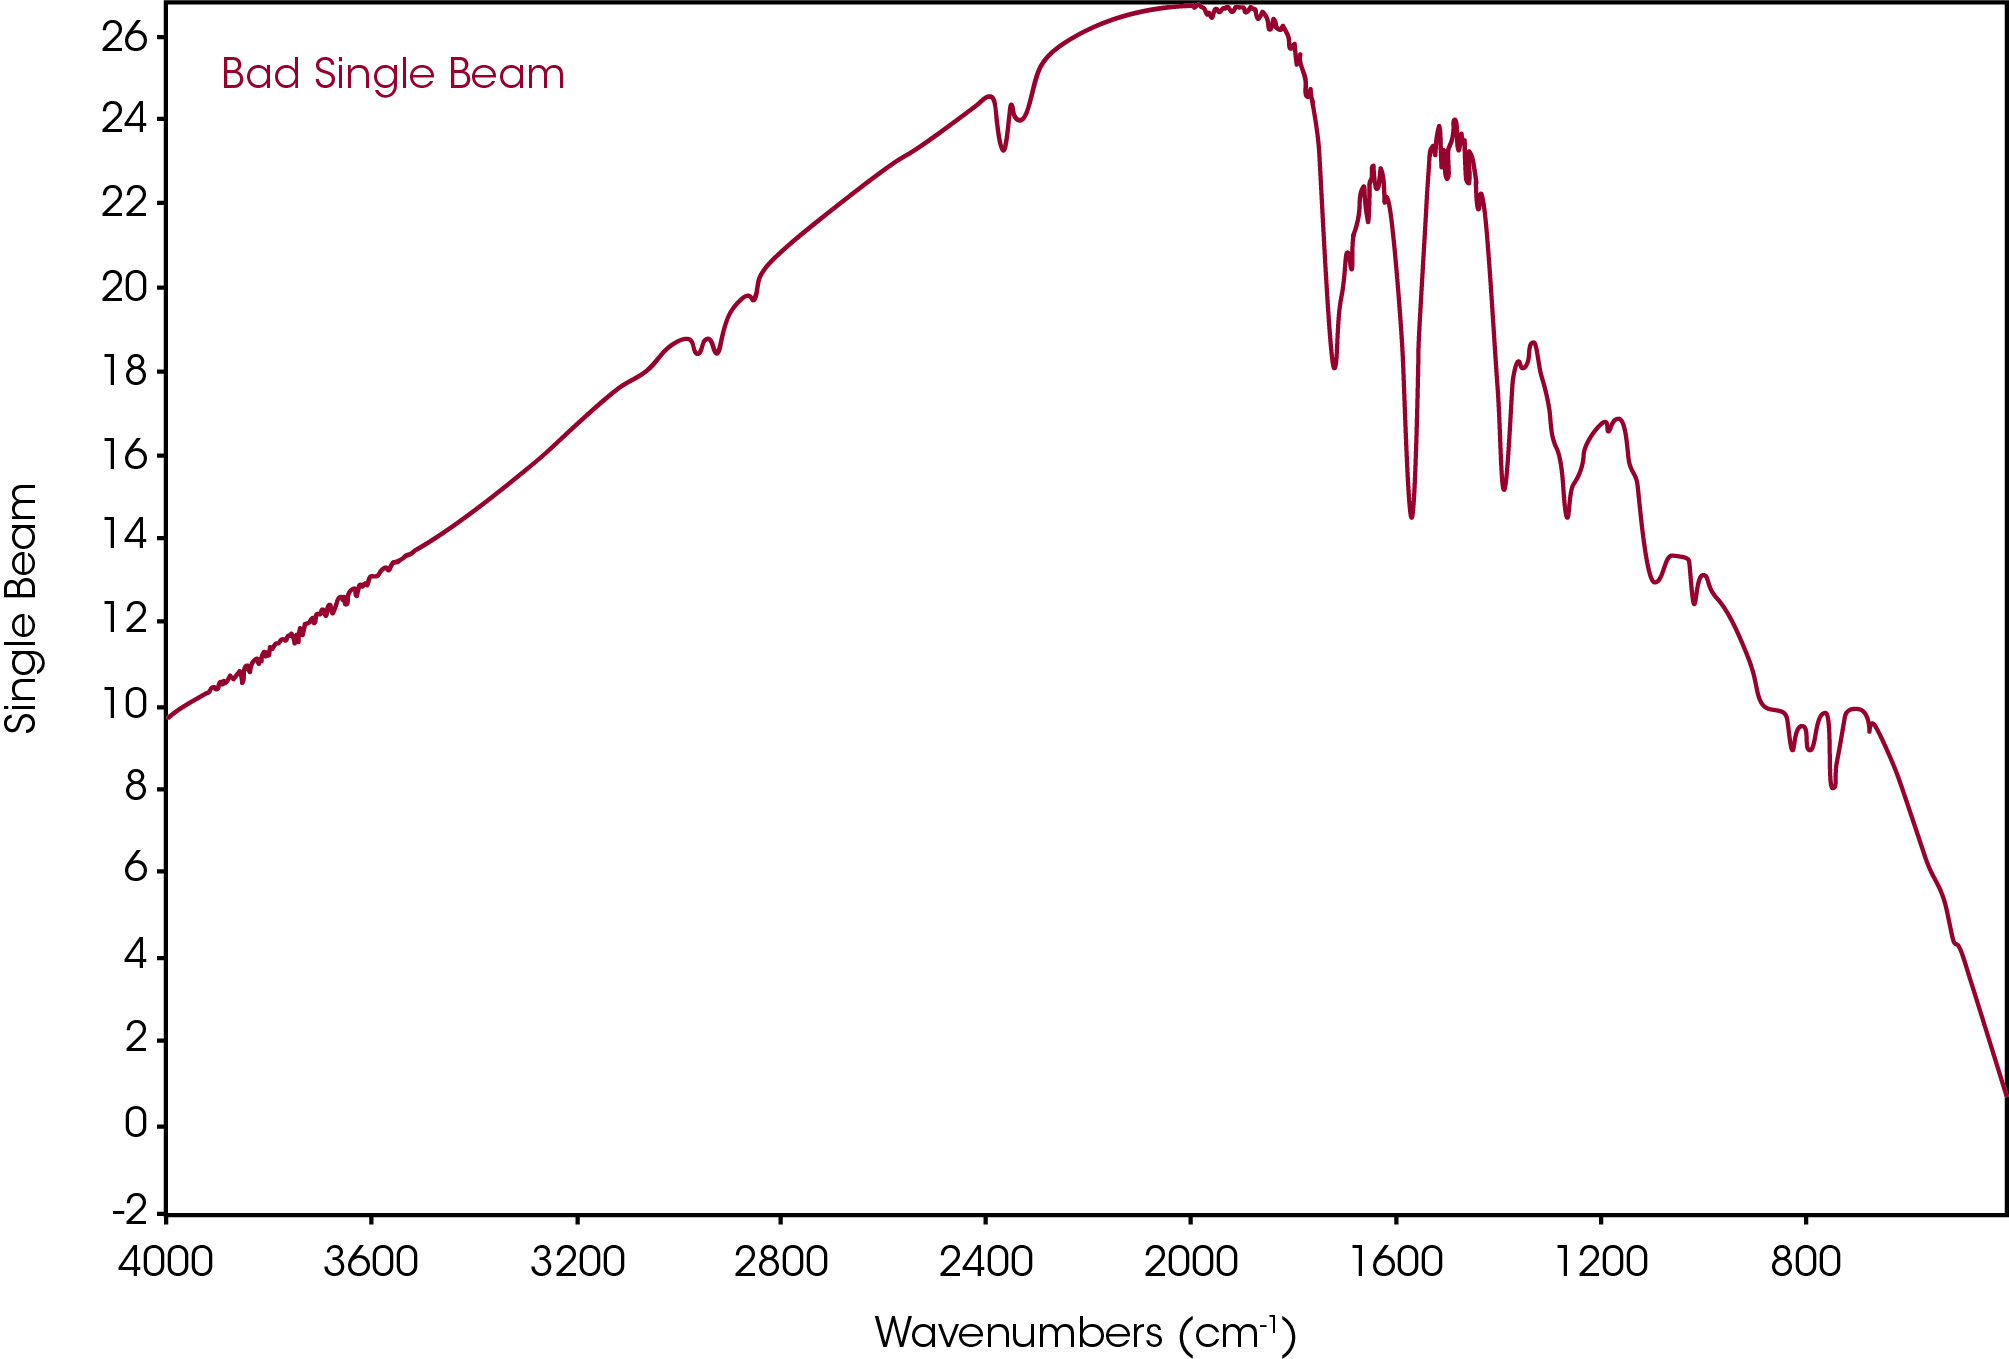
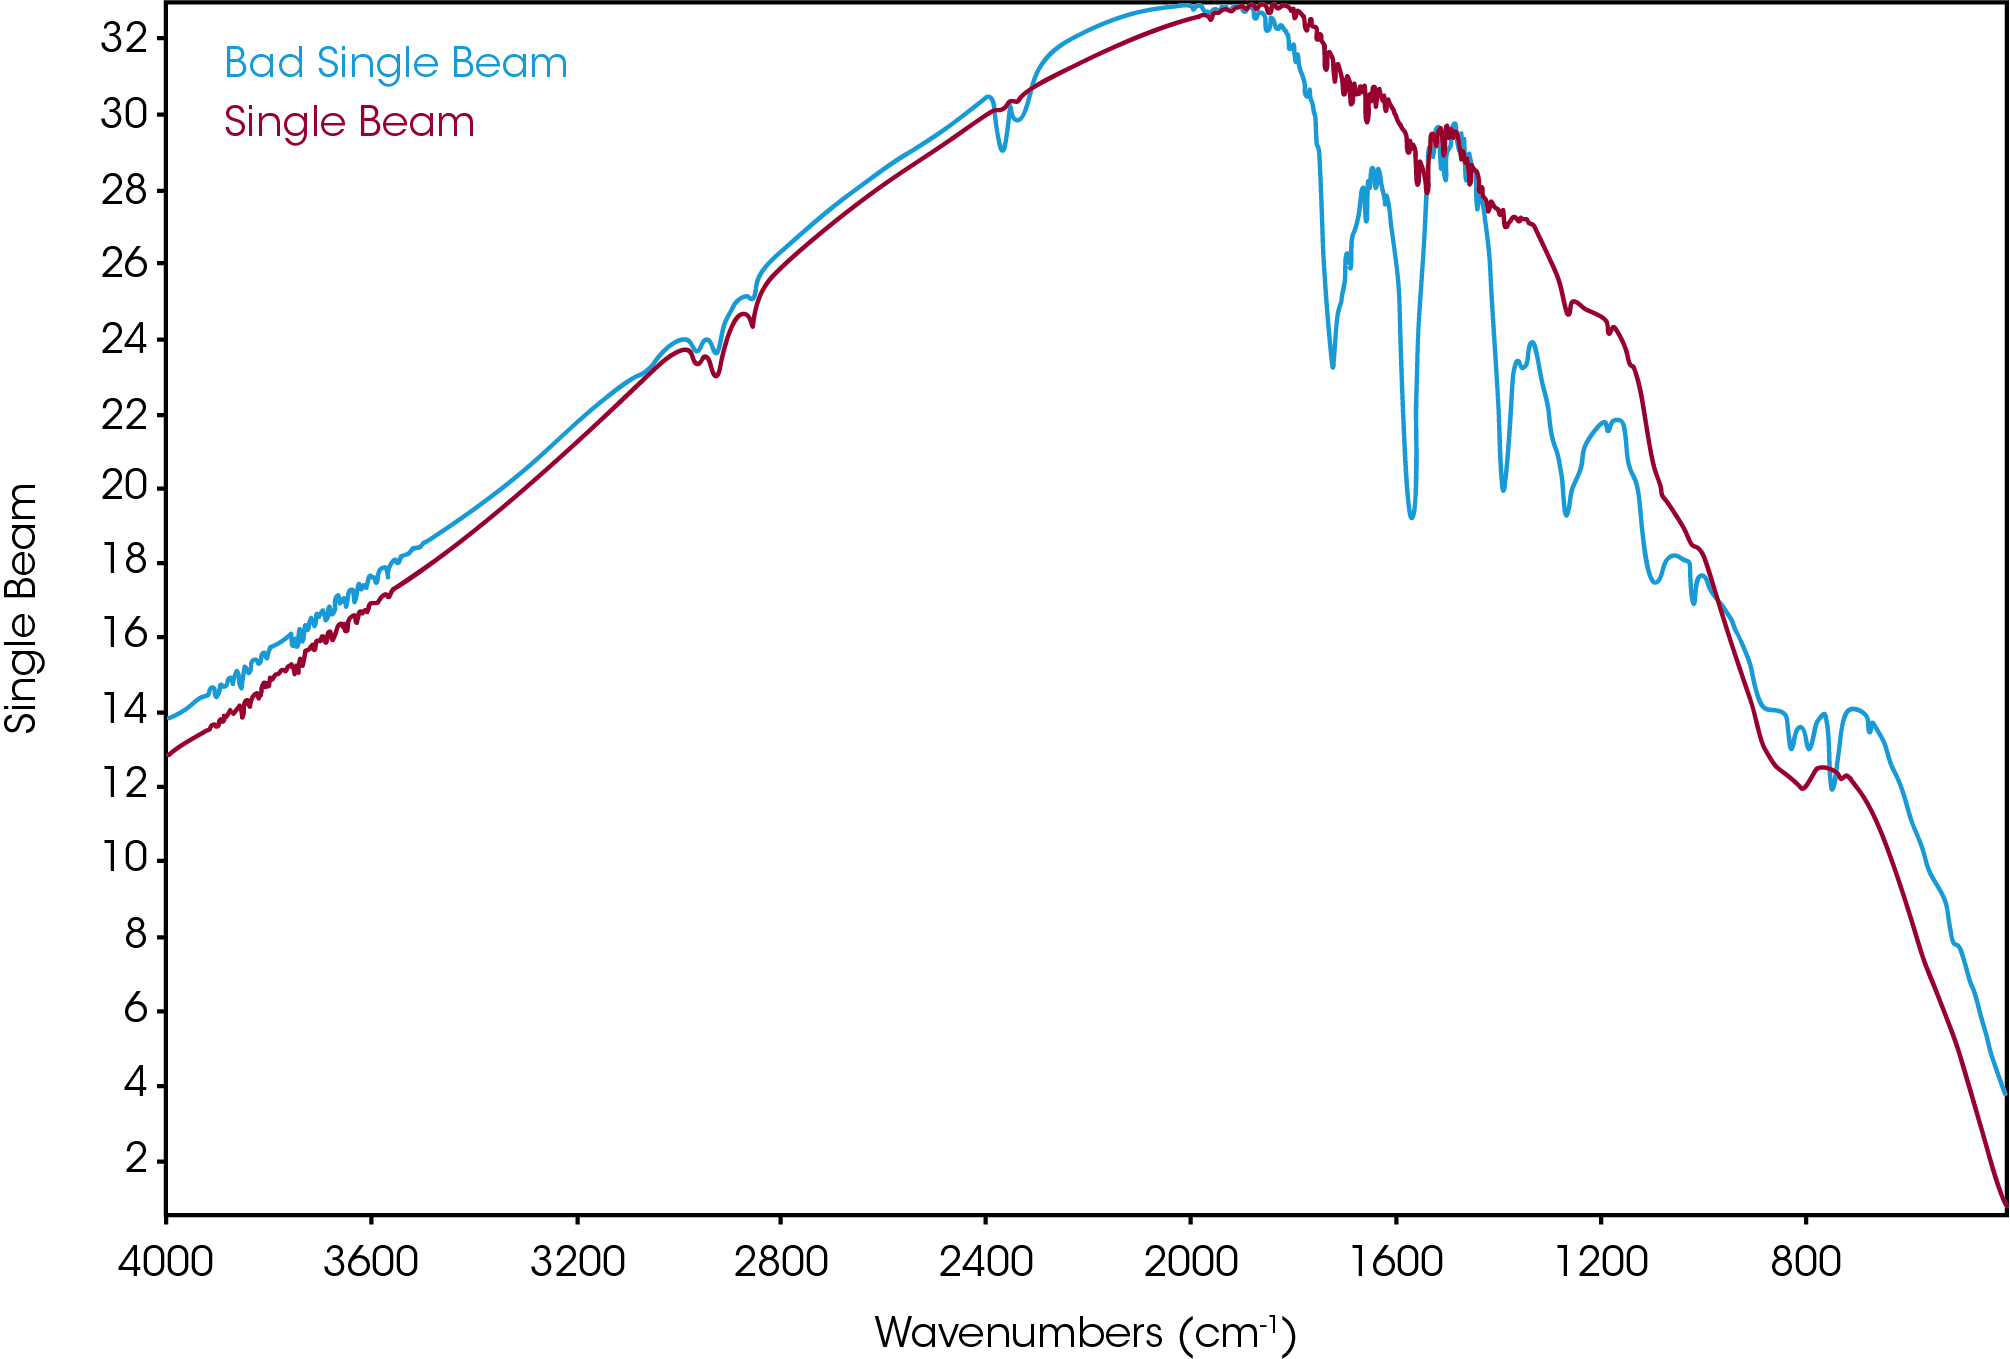
An example of a problem single beam is shown in Figure 3 and is compared to a normal one in Figure 4. Note the extra spectral features. Occasionally these features may diminish after a period of time, or may be ratioed out. Collect a 100% line to check.
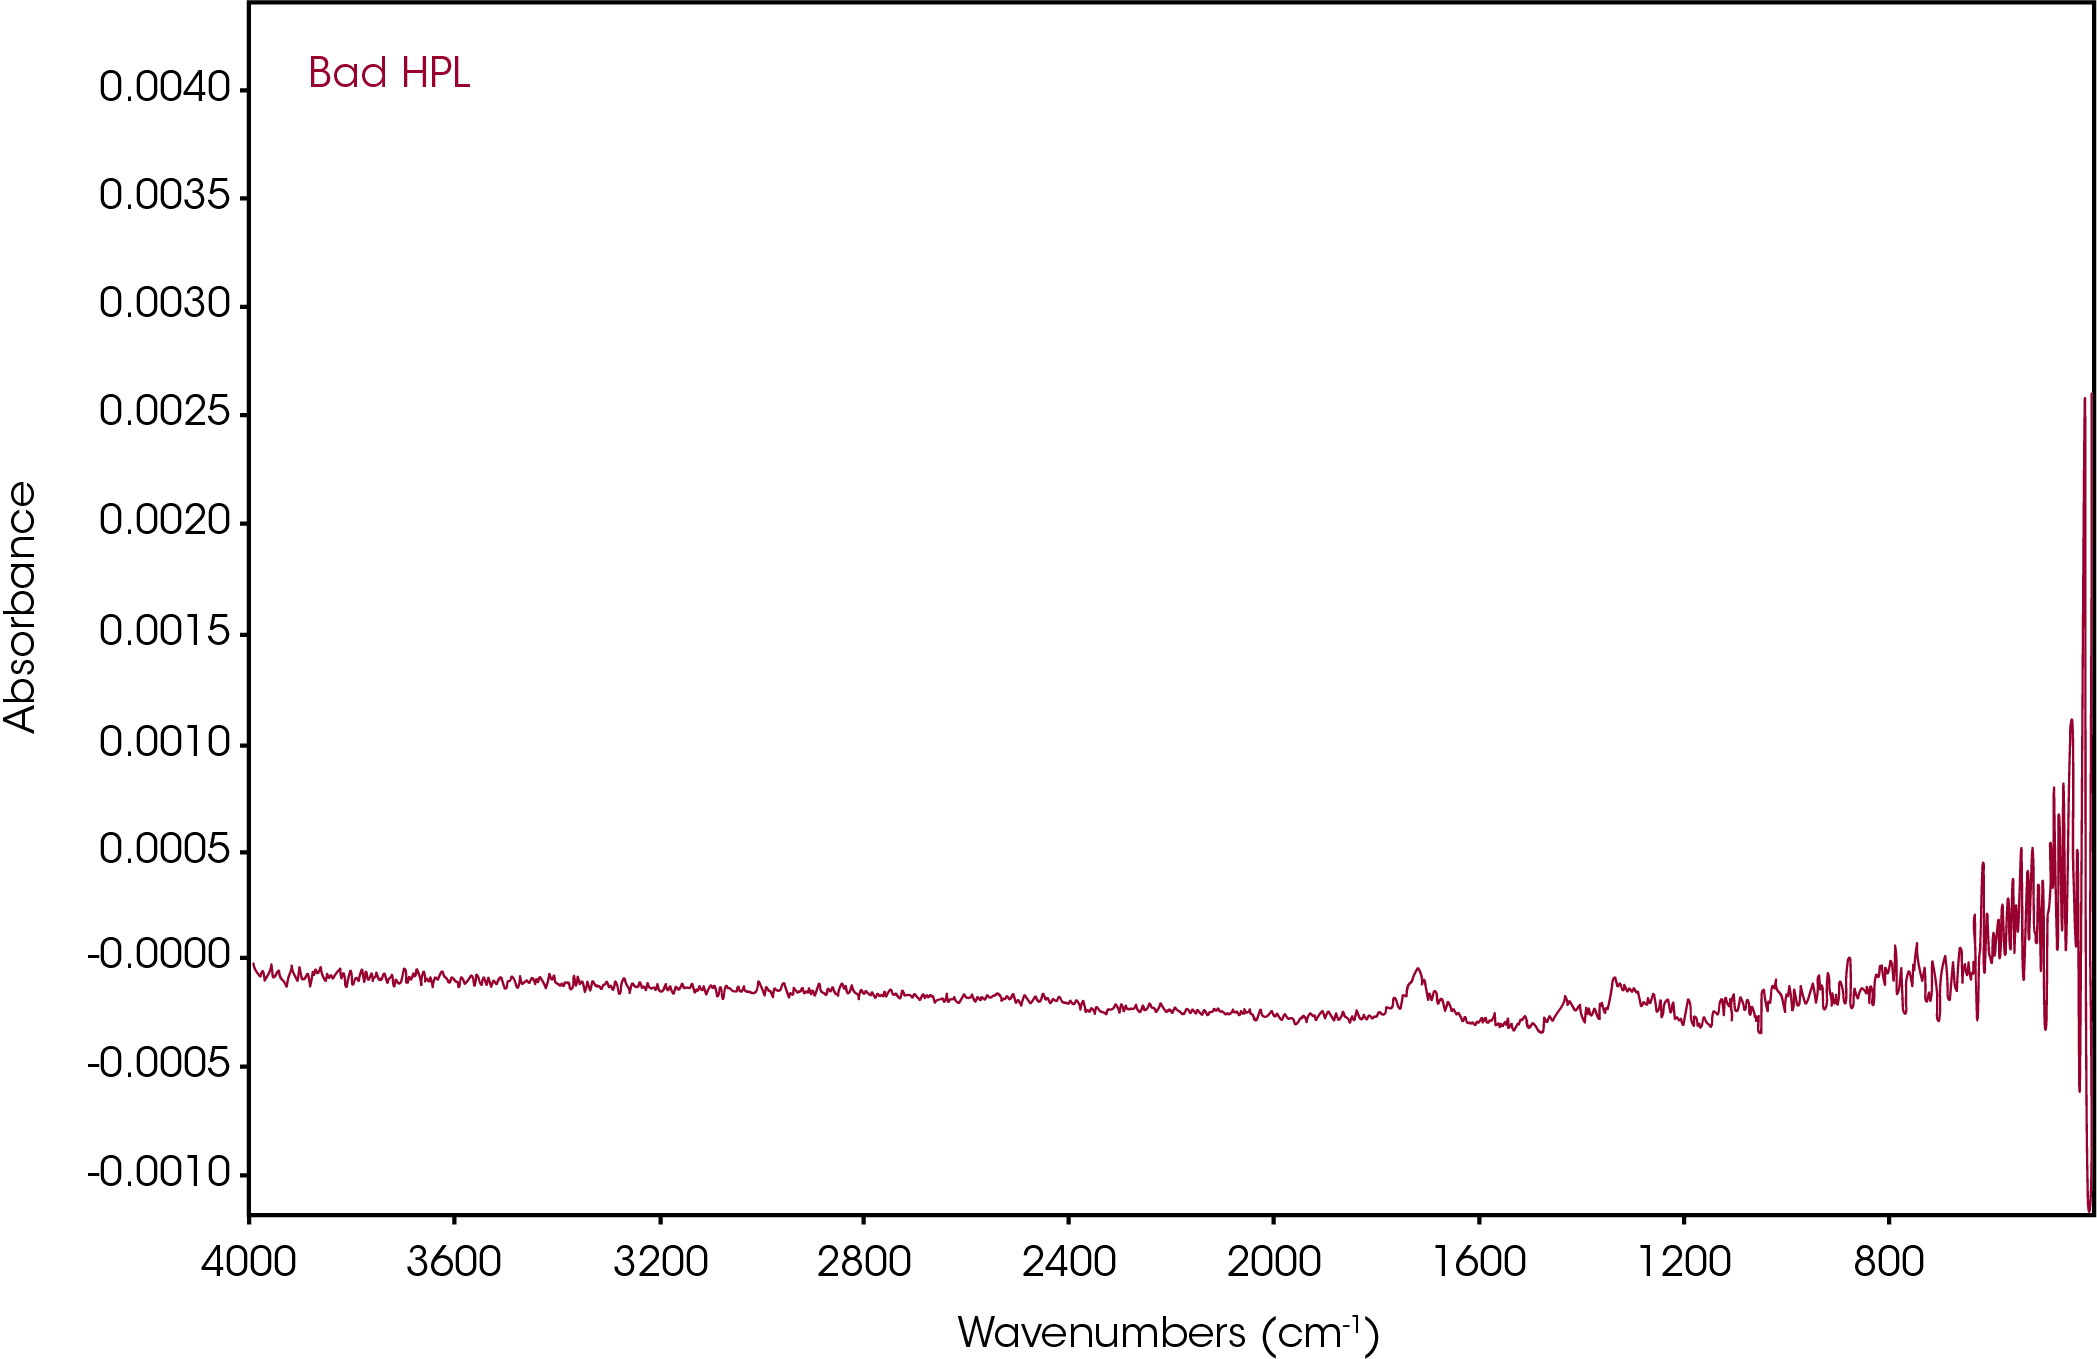
Figure 5 shows an example of a contaminated 100% line generated from a contaminated background single beam. The extra spectral features are not ratioing out and will interfere with or appear as artifacts in any new sample collected. At this point, the gas cell windows must be replaced or cleaned. Follow the instrument manufacturer’s directions for replacing the gas cell windows.
After replacing the windows, bring the gas cell up to temperature, allow some time purging with dry N2, and recheck the spectrometer by collecting a single beam spectrum and hundred percent line.
Conclusions
EGA analysis generates decomposition products which eventually may contaminate the gas cell windows. Between sample runs, it is recommended to regularly check a single beam and 100% line to ensure no artifacts are introduced in subsequent sample runs.
References
- B. C. Smith, Fundamentals of Fourier Transform Infrared Spectroscopy, Boca Raton: CRC, 2011.
Acknowledgement
This paper was written by James Browne, Senior Scientist at TA Instruments.
Click here to download the printable version of this application note.

