Keywords: battery, electrode, thermal analysis, thermal conductivity
TPP036
Abstract
Designing for temperature control of a lithium-ion battery cell requires understanding the thermal properties of its components. Properties such as heat capacity, thermal conductivity, and thermal diffusivity characterize the heat transfer across individual and composite materials within the cell. These parameters are critical for developing the battery thermal model and designing the thermal management system. Thermal conductivity of thin components, such as those used in the electrode, can be determined through thermal diffusivity and heat capacity measurements. This work explores the methodology of measuring thermal conductivity of a battery anode material coated onto a thin copper current collector. The results obtained in these measurements are important for development, optimization, and design of battery thermal management systems.
Introduction
Battery thermal management systems (BTMS) are used to maintain the temperature of lithium-ion batteries (LIB), making them critically important for the safety and operation of lithium-ion batteries. A well-designed BTMS can extend the longevity of the battery, improve performance in cold weather, and prevent serious safety hazards that stem from overheating and thermal runaway [1]. The BTMS design is influenced by how each cell component dissipates heat during battery operation. For example, in the electrode and current collector, when the battery charges and discharges, heating occurs as ions are exchanged between the electrode and current collector. The rate of heat transfer will directly impact the battery cell temperature fluctuations. Understanding the thermal properties of the electrode, such as thermal diffusivity, thermal conductivity, and specific heat capacity, are key to dissipating this heat effectively [2].
Thermal diffusivity, the rate at which heat spreads through a material, can provide insight regarding how electrode materials balance thermal and electrical performance [3] [4]. The thermal conductivity and heat capacity of the anode and current collector are also key properties in designing and modeling the BTMS [5]. Combined with heat capacity measurements from differential scanning calorimetry (DSC), flash measured diffusivity can be used to determine the thermal conductivity of anode materials.
Application Benefits
- Analyze battery material thermal properties to develop thermal models
- Measure complex, thin anode materials with light flash techniques such as TA Instruments™ Discovery™ Xenon Flash 200+ to quantify rapid heat transfer
- Identify materials specific heat capacity easily using TA Instruments Discovery Differential Scanning Calorimeter
- Determine the thermal conductivity of thin anode samples comprised of multiple components from thermal diffusivity and heat capacity measurements
Experimental
Thermal diffusivity (α), specific heat capacity (Cp), and thermal conductivity (λ) were determined for a sheet of anode material and an uncoated copper sample at 25 ºC. The anode material was composed primarily of graphite with carbon black, carboxymethyl cellulose (CMC), and styrene-butadiene rubber (SBR). The material was deposited onto a current collector made of thin copper foil. An uncoated copper foil of the same type and thickness was also analyzed as a control and will be referred to as uncoated copper. The uncoated copper had a thickness of 0.009 mm and the anode sample was 0.12 mm thick.
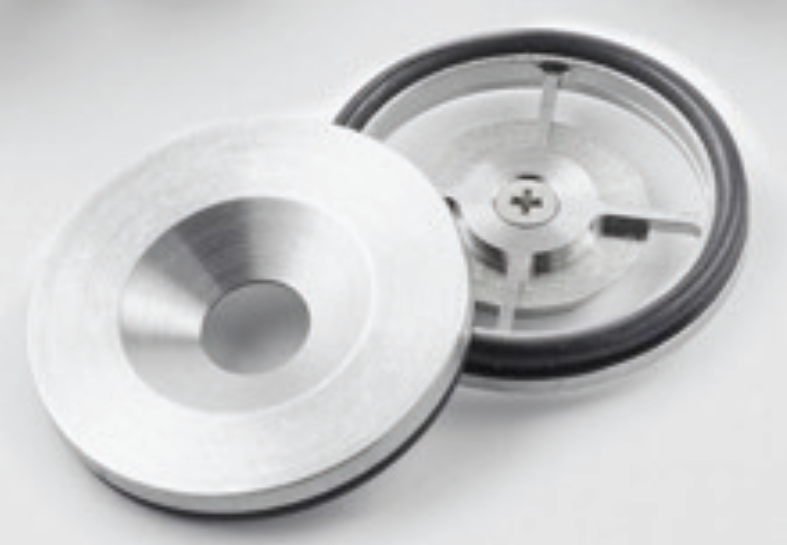
For samples with high thermal conductivity, flash measurements are used to measure thermal diffusivity. A Discovery Xenon Flash 200+ (DXF 200+) light flash analyzer from TA Instruments™ was used to measure the thermal diffusivity of both samples. In a typical flash method, the surface of a sample is exposed to a short pulse of energy. The dissipation of the energy across the sample over a software-specified length is recorded to determine its thermal diffusivity. When testing thin samples in a flash analyzer, diffusivity cannot be measured in the standard through-plane direction. Instead, thin samples are measured in the in-plane direction, which measures across the sample face horizontally. This is achieved with the use of a specialized in-plane fixture, shown in Figure 1, which sandwiches the film between two masks and allows for the flash energy to flow concentrically inward towards the sample center. The outer edge is heated from below the sample by a pulse and detected at the top of the sample. Both samples were die cut into circles with a 25.4 mm diameter to fit the in-plane fixture.

Highly reflective surfaces will scatter the light and can make it difficult for the sample to absorb sufficient energy from the pulse to produce a good signal, so reflective samples are coated in a thin layer of graphite spray for flash measurements. For this work, the bottom side of each sample was coated in a thin layer of graphite spray and the top side was coated with a thin layer of silver paint to promote good pin contact, minimize noise, and achieve accurate results. The anode material and uncoated copper samples were run in in-plane mode and the average thermal diffusivity was taken from three separate pulses.
In-plane testing requires separate heat capacity measurements in order to obtain thermal conductivity values. Thermal conductivity of a material can be calculated for a sample with a known density, thermal diffusivity, and specific heat capacity. Modulated differential scanning calorimetry (MDSC) [6] was used to determine the specific heat capacity of the uncoated copper and anode material samples. The experiments were performed on a Discovery DSC 2500 with samples of 22 mg (± 2 mg) in aluminum Tzero® pans with standard lids. The MDSC ramp was performed on both samples from below room temperature to slightly above to ensure that a steady heat flow at the temperature of interest, 25 °C, for this calculation. Samples were thermally ramped from 5 °C to 40 °C with a sinusoidal modulation of ± 1 °C over a period of 120 seconds with an average heating rate of 1 °C/min. A sapphire standard was used to calibrate and validate the heat capacity values of the instrument using this modulated method.
Results and Discussion
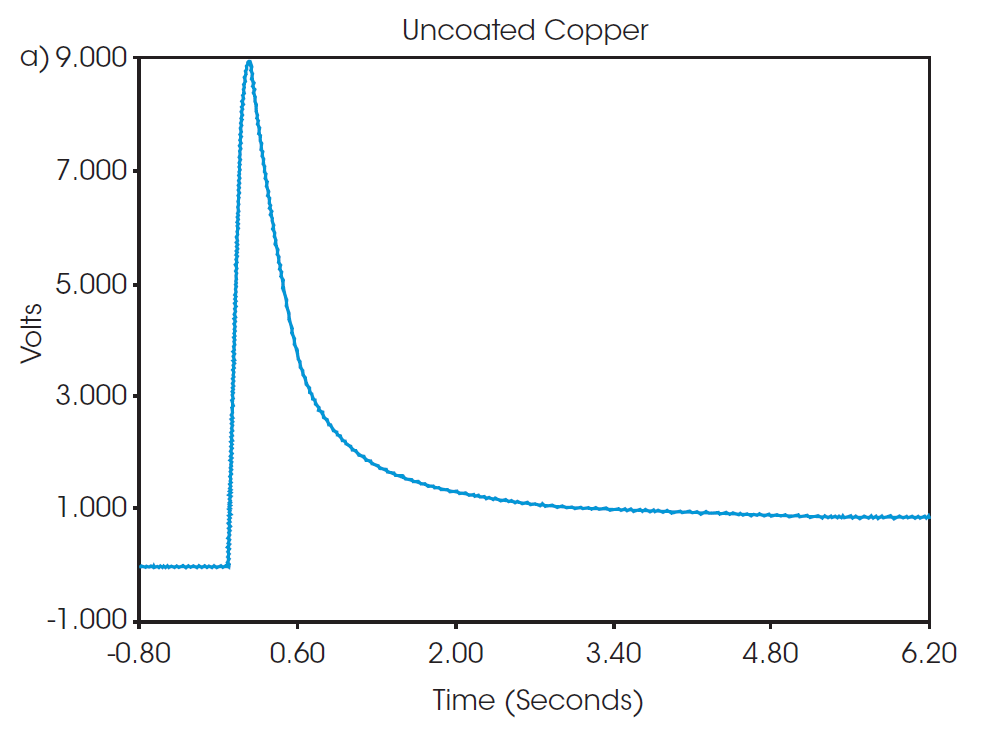
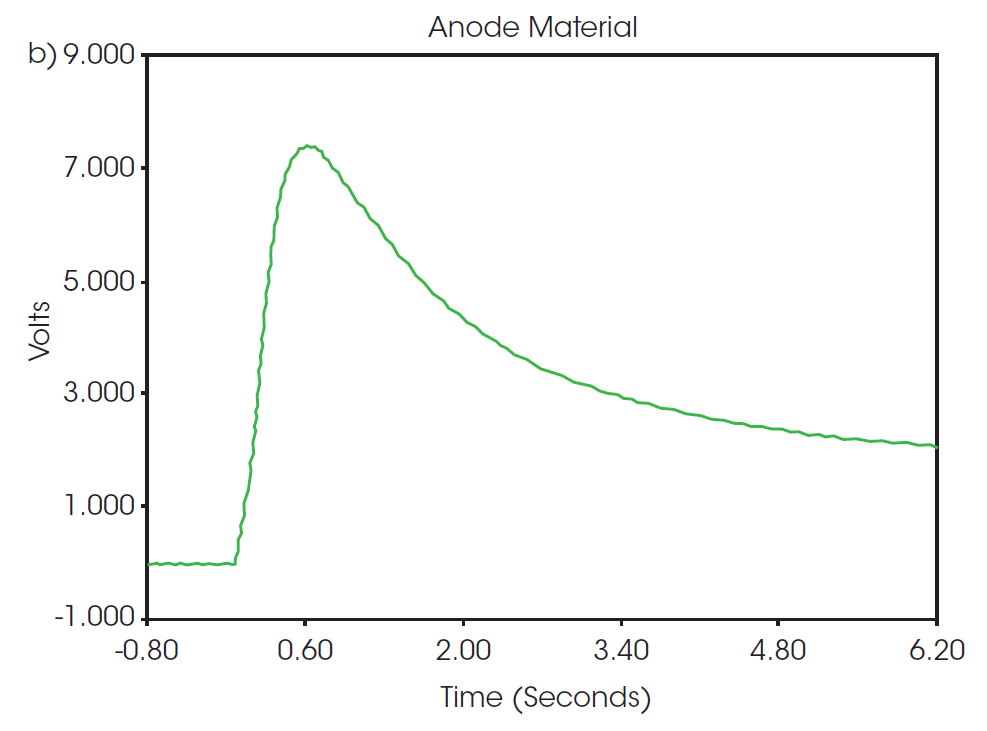
Representative thermograms from the flash pulses of both samples are shown in Figure 2. The observed shapes of the thermograms are typical of the response to a flash pulse and show very little noise, which give high confidence in the results. The intensity, duration, and dissipation of the response to the flash is used to calculate thermal diffusivity by fitting the data to a model based on a fin approximation, as described previously [7]. At 25 °C, the thermal diffusivity of the uncoated copper was 1.194 cm2/sec and the anode material was 0.371 cm2/sec, as determined from the three pulse measurement results in Table 1.
Table 1. Thermal diffusivity from each pulse of DXF 200+ experiment
| Pulse | Thermal Diffusivity (cm2/sec) | |
|---|---|---|
| Uncoated Copper | Anode Material | |
| 1 | 1.193 | 0.363 |
| 2 | 1.195 | 0.379 |
| 3 | 1.194 | 0.371 |


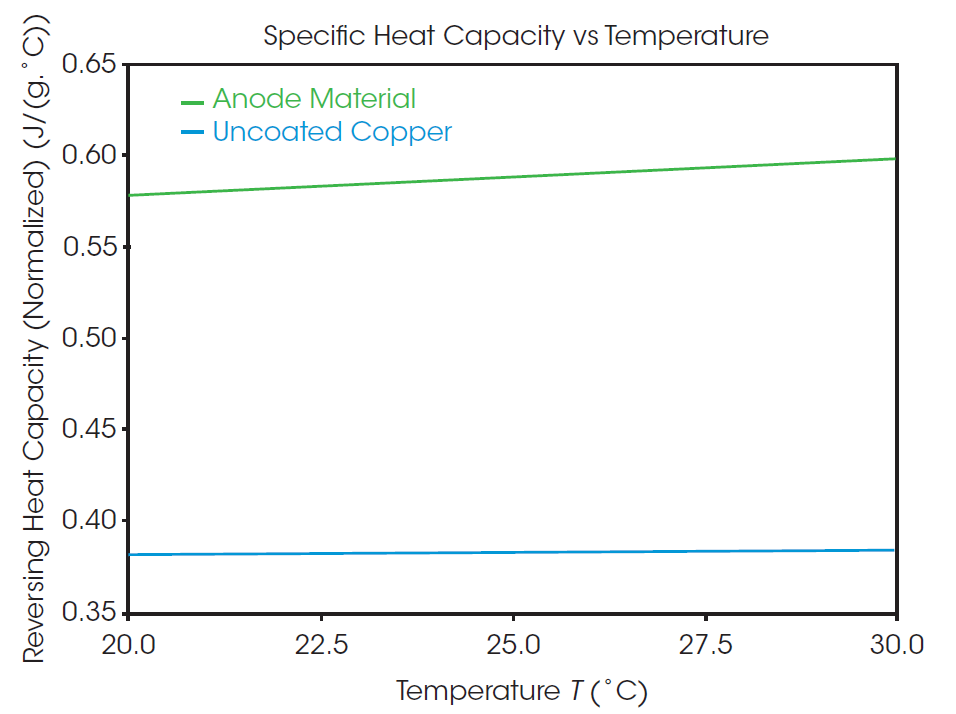
Specific heat capacity as a function of temperature as measured from the MDSC experiment is plotted in Figure 3. The specific heat capacity of the uncoated copper and anode samples are 0.3827 and 0.5868 J/g°C, respectively, at 25 °C. Compared to the uncoated copper sample, the anode material shows a higher overall heat capacity and greater change with temperature. The recorded value for the specific heat capacity of the anode material is of the entire assembly of graphite and other additives deposited onto the surface of a copper foil, as opposed to the property of a single material. Factors such as the quality of the coating application and blending of the composition can impact the thermal performance of the overall component. Directly measuring properties of the entire system provides a better picture of the overall thermal performance than prediction based on composition.
The thermal conductivity of each sample can be calculated using Equation 1.
λ = α * Cp * ρ (1)
Where:
- λ = thermal conductivity (W/m·K)
- α = thermal diffusivity (m2/sec)
- Cp = specific heat capacity (J/kg·K)
- ρ = density (kg/m3)
The density of the uncoated copper is 8.940 g/cm3 and the anode material has a calculated density of 1.959 g/cm3. The uncoated copper sample was found to have a thermal conductivity of 408.6 W/m·K., while the graphitic anode material had an overall thermal conductivity of 42.64 W/m·K.
Although graphite is the primary component, it is important to remember that the anode material is a multi-component sheet with different polymer additives and fillers deposited on a thin copper foil. This blend of materials, as well as the interlayer space between the anode sheet and copper foil, all contribute to the observed thermal diffusivity and calculated thermal conductivity for the anode material, summarized in Table 2. Different formulations of the anode will impact the resulting conductivity and researchers can utilize these measurements to optimize their compositions. Additionally, when using complex formulation, thermal conductivity should be determined experimentally to have the best input possible when predicting overall battery thermal performance and designing the BTMS.

Table 2. Summary of thermal properties of the anode and uncoated samples
| Uncoated Copper | Anode Material | |
|---|---|---|
| Thermal Diffusivity (m2/sec) | 1.194×10⁻⁴ | 0.371 x10⁻⁴ |
| Specific Heat Capacity (J/kg·K) | 382.7 | 586.8 |
| Density (kg/m3) | 8940 | 1959 |
| Thermal Conductivity (W/m·K) | 408.6 | 42.64 |
Conclusions
Accurate thermal property measurements are required for the BTMS. A DXF 200+ and Discovery 2500 DSC were used to determine the thermal conductivity of a graphite-based LIB anode coated onto a copper current collector and compared to an uncoated copper current collector. Thermal conductivity was calculated from the material density, thermal diffusivity measured by the DXF, and specific heat capacity measured by the DSC. Flash measurements in the in-plane direction were used to measure the thermal diffusivity of the samples. Specific heat capacity was measured by MDSC as a function of temperature. The addition of the anode coating on the copper current collector yielded a thermal conductivity that was nearly an order of magnitude lower than the uncoated copper. While predominantly graphite, the anode material also contained carbon black and polymeric additives that may impact thermal properties. The blending and application of the coating onto the collector can further impact thermal performance, making measurements on the overall component important for optimizing the anode composition, modeling, and understanding the impact on thermal management systems in batteries.
References
- Q. Zheng, M. Hao, R. Miao, J. Schaadt and C. Dames, “Advances in thermal conductivity for energy applications: a review,” Progress in Energy, 2021.
- M. Steinhardt, J. V. Barreras, H. Ruan, B. Wu, G. J. Offer and A. Jossen, “Meta-analysis of experimental results for heat capacity and thermal conductivity in lithium-ion batteries: A critical review,” Journal of Power Sources, vol. 522, 2022.
- Q. Ma, “TPP034: In-Plane Measurement of Thermal Diffusivity of Copper Thin FIlm,” TA Instruments, New Castle, DE, 2022.
- Q. Ma, “TPP035: In-Plane Measurement of Thermal Diffusivity of Graphite Thin Film,” TA Instruments, New Castle, DE, 2022.
- D. Werner, A. Loges, D. J. Becker and T. Wetzel, “Thermal conductivity of Li-ion batteries and their electrode configurations- A novel combination of modelling and experimental approach,” Journal of Power Sources, vol. 364, pp. 72-83, 2017.
- Y. Schuman, “Heat Capacity Measurements Using Modulated DSC (MDSC) – Both Ramping and Quasi-isothermal Methods,” TA Instruments, New Castle, DE.
- J. Gembarovic, H. Wang and D. Paganelli, “A New Fin Model on In-Plane Thermal Diffusivity Measurement of Thin Films by the Flash Method,” in International Heat Transfer Conference 16, Beijing, China, 2018.
Acknowledgement
This paper was written by Andrew Janisse, PhD, Justin Wynn, Applications Specialist, Jennifer Vail, PhD at TA Instruments.
Click here to download the printable version of this application note.

