Keywords: Thermogravimetry, Mass Spectrometry, TGA/MS, quantification, method of standard additions, evolved gas analysis, EGA, grease, lubricant, TeflonTM, materials characterization
TA407
Abstract
TGA/MS offers unique capabilities for analyzing samples that may otherwise be challenging with other analytical techniques such as GC/MS or HPLC/MS. In this work, a commercially available lubricant grease with added TeflonTM was analyzed to determine the concentration of the TeflonTM using TGA/MS by modifying the familiar method of standard additions.
Introduction
Combining thermogravimetric analysis (TGA) with FTIR (TGA/FTIR) and / or mass spectrometry (TGA/MS) referred to as evolved gas analysis (EGA) offer the analytical chemist powerful tools with unique advantages including
- Minimum sample preparation
- Minimal or no solvent
- Good Sensitivity
- Relatively fast analysis
- Good alternative for difficult samples (oils, greases, polymers, rubber, biomass, soil, etc.)
- Excellent scouting tool for other mass spectral techniques
TGA/MS allows quantification similar to spectroscopic methods by plotting the detector response as function of concentration of analyte, constructing a calibration curve, and comparing to the unknown. The sample in this work is a common lubricating grease with TeflonTM added. These greases have a variety of uses including household, sporting equipment, bicycles, etc.
Experimental
Instrumentation and Parameters
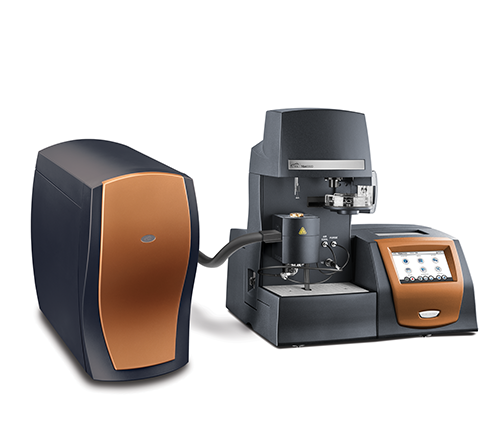
- TGA — TA Instruments TGA 5500
- Purge Helium
- Heating Rate: 20 oC/min
- Crucible: 100 μL Platinum Pan
- Heating Range: ambient to 800 oC
- Mass Spectrometer — TA Instruments Discovery Mass Spectrometer
- Experiments — Barchart for initial scan from m/z 1 to m/z 120; peak jump for sample quantification
- Electron Voltage: 70 eV
Sample and Reference
- Commercial Grease containing TeflonTM
- Polytetrafluorethylene Reference; Aldrich catalogue number 184278-5G, lot 01012HS, MW3183
Methodology
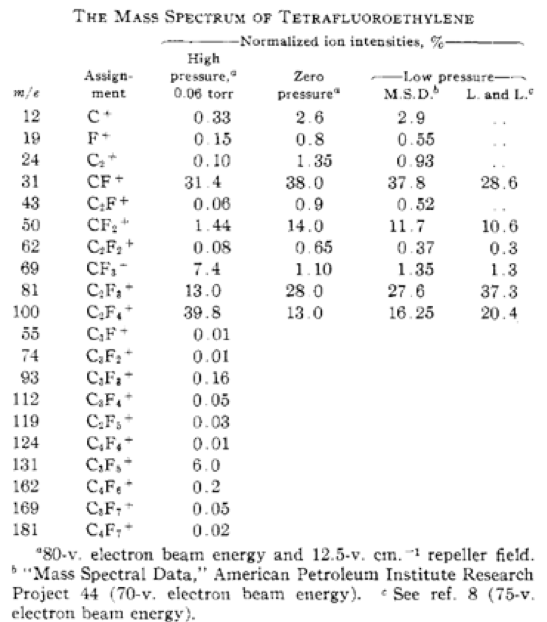
Derwish, et al. (1) published a mass spectral analysis of tetrafluoroethylene including assignments of the ion fragments (Figure 2). While a mass spectral analysis of the monomer does not always correspond to ion fragments obtained in a TGA/MS analysis of the polymer, it is often a useful reference for ions of interest. It is important to remember the products of the TGA analysis are usually decomposition products so there may not be a corresponding ‘parent ion’ and other ion fragments may be out of proportion to those observed in any reference mass spectrum. Obtaining TGA/MS data on known reference materials using the same experimental conditions as the unknown sample is recommended.
Initially a barchart1 experiment scanning from m/z 1 to m/z 120 was performed on the grease and the PTFE reference to determine possible ion currents for the quantitative analysis. After suitable ion currents are identified, a more sensitive, ion specific peak jump2 experiment is performed for the quantitative analysis.
Five samples of the grease with the reference PTFE added in varying masses were prepared for analysis. A summary of these samples is shown in Table 1.
Data reduction is carried out using TRIOS® software and Microsoft Excel®.
1 Barchart experiment is a scan across an ion current range. The Discovery Mass Spectrometer can scan from m/z 1 to m/z 300.
2 Peak jump experiment is an ion specific scan which allows for greater sensitivity.
From the NIST Webbook:

Modified Method of Standard Additions
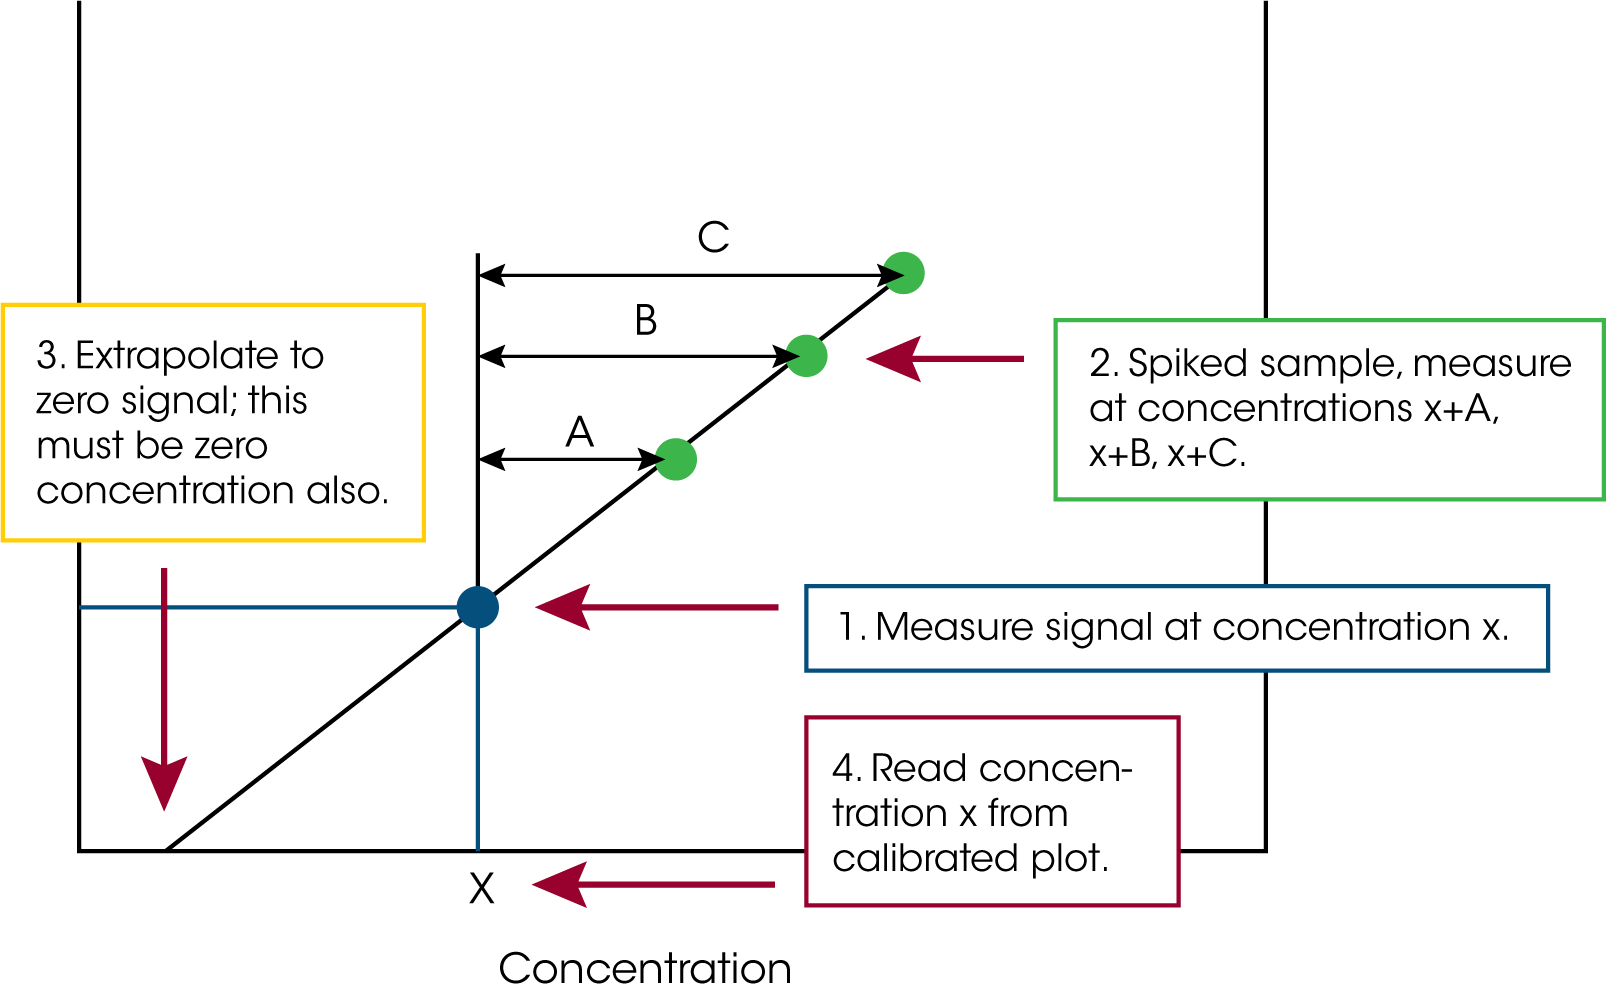
The method of standard additions (a schematic is shown in Figure 4) is frequently used in spectroscopic analytical methods (AA, UV-vis, chromatography etc.) in which equal volumes of a solution of an unknown have varying volumes of a concentration of the analyte of interest added to them or ‘spiked’. One of the sample solutions is not spiked. The sample solutions are diluted to volume and the detector response of each solution is recorded and plotted as a function of the volume of added analyte. The concentration of the analyte in the sample that receives no additional analyte is calculated from the x-intercept of a linear regression fit of the data.
For the grease sample, the standard additions approach is modified. The analyte in this sample is a polymer which is not soluble in the sample matrix. This means making a homogeneous mixture from which aliquots of known concentration can be added to our sample matrix impossible. A further complication is that TGA/MS samples are typically small, sometimes less than 2 mg. Large samples can potentially clog the capillary, a common problem with olefinic hydrocarbons. Our approach is to add known masses of the reference PTFE to known masses of the grease and plot the ion current response as a function of mass fraction of the PFTE added.
Define variables CX, CR, and A where:
CX = mass fraction of TeflonTM in the original grease sample
CR = mass fraction of the TeflonTM reference added to the original grease sample
A = normalized integrated area of ion current or response
The normalized area can be plotted as a function of added mass fraction of the reference TeflonTM and fit using Equation 1:

m and b are slope and intercept of a least squares fit:
At the x-intercept, A=0 and in the original sample CR = 0 so that the initial concentration of the TeflonTM in the grease sample can be calculated using Equation 2:

One obvious challenge is that matching exact total masses of the samples to cover a reasonable concentration range as well as obtain good signal to noise may be difficult. The variability of the masses makes it necessary to use a normalized value of the integrated area A. This can be done by either dividing the area of A to the total mass of the sample or alternatively dividing by the sum of areas of an internal band unique to the sample matrix and the analytical band. Determining both the analytical band as well as an internal reference band can be done with an initial barchart scan across a broad mass to charge range.
Table 1. Masses of Grease and Added PTFE
| Sample | Mass (mg) | Mass of Added PTFE (mg) |
|---|---|---|
| 1 | 6.537 | 0.000 |
| 2 | 7.396 | 0.190 |
| 3 | 4.392 | 0.526 |
| 4 | 7.396 | 0.102 |
| 5 | 8.840 | 0.389 |
Results and Discussion
Survey Barchart Scans
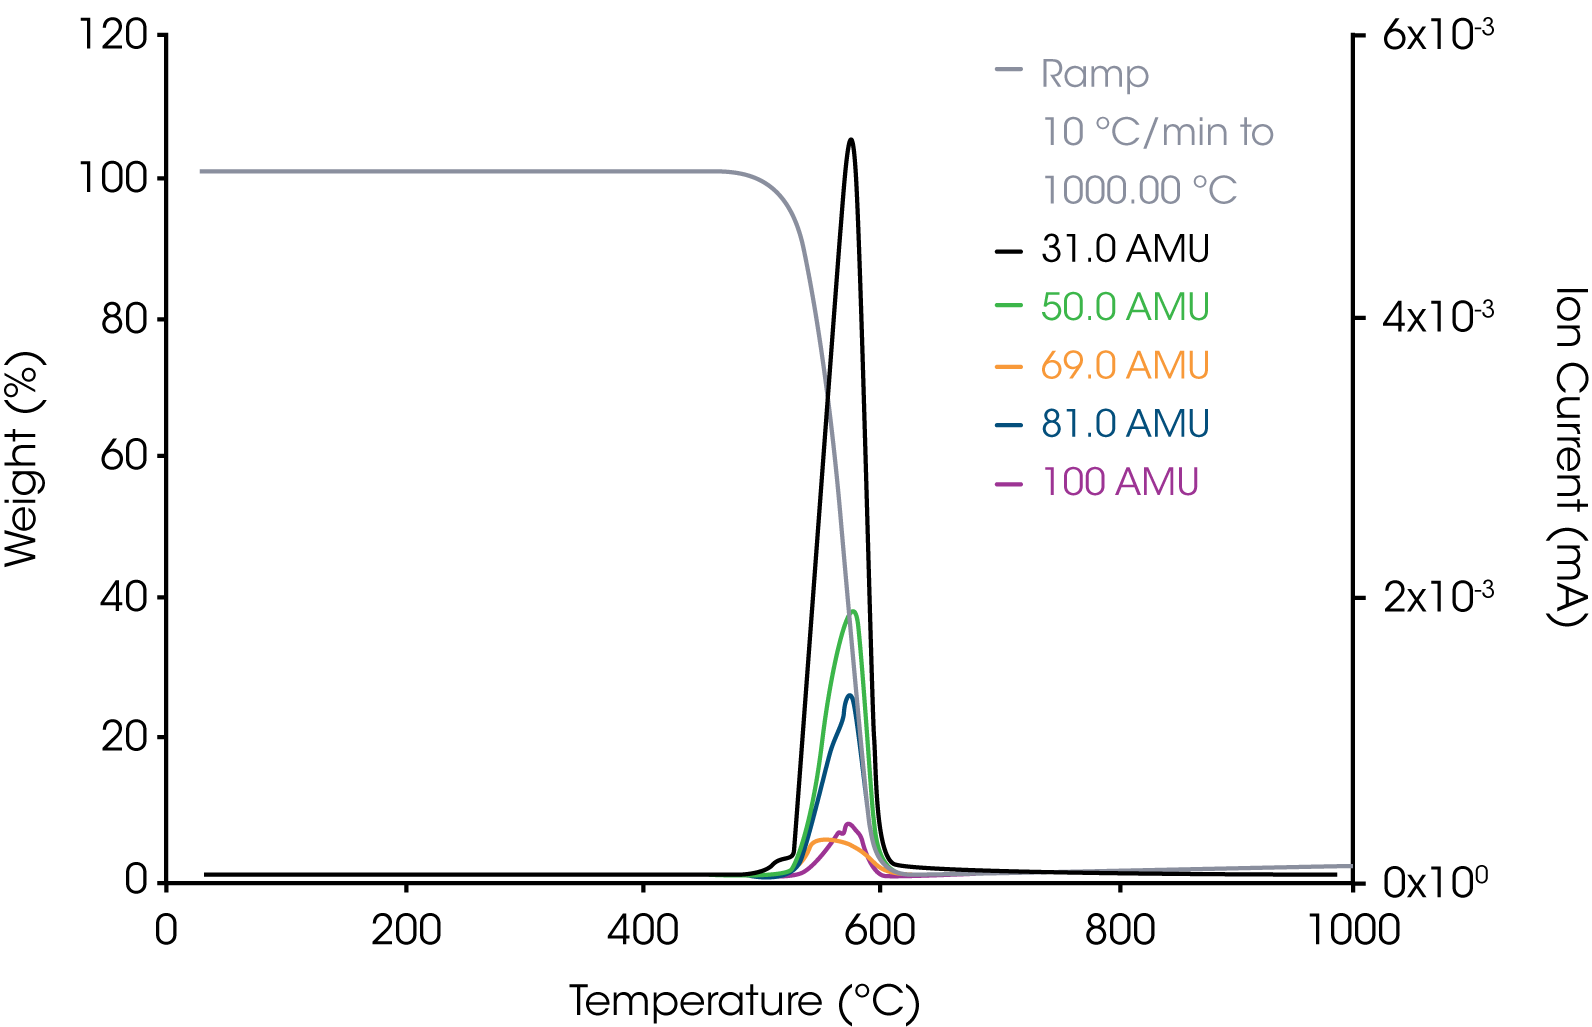
1. PTFE Reference – The results of the barchart survey scan showed that m/z 31 assigned to C-F+ ion fragment shows the strongest response. Scans of potential ions of interest are shown in Figure 5.
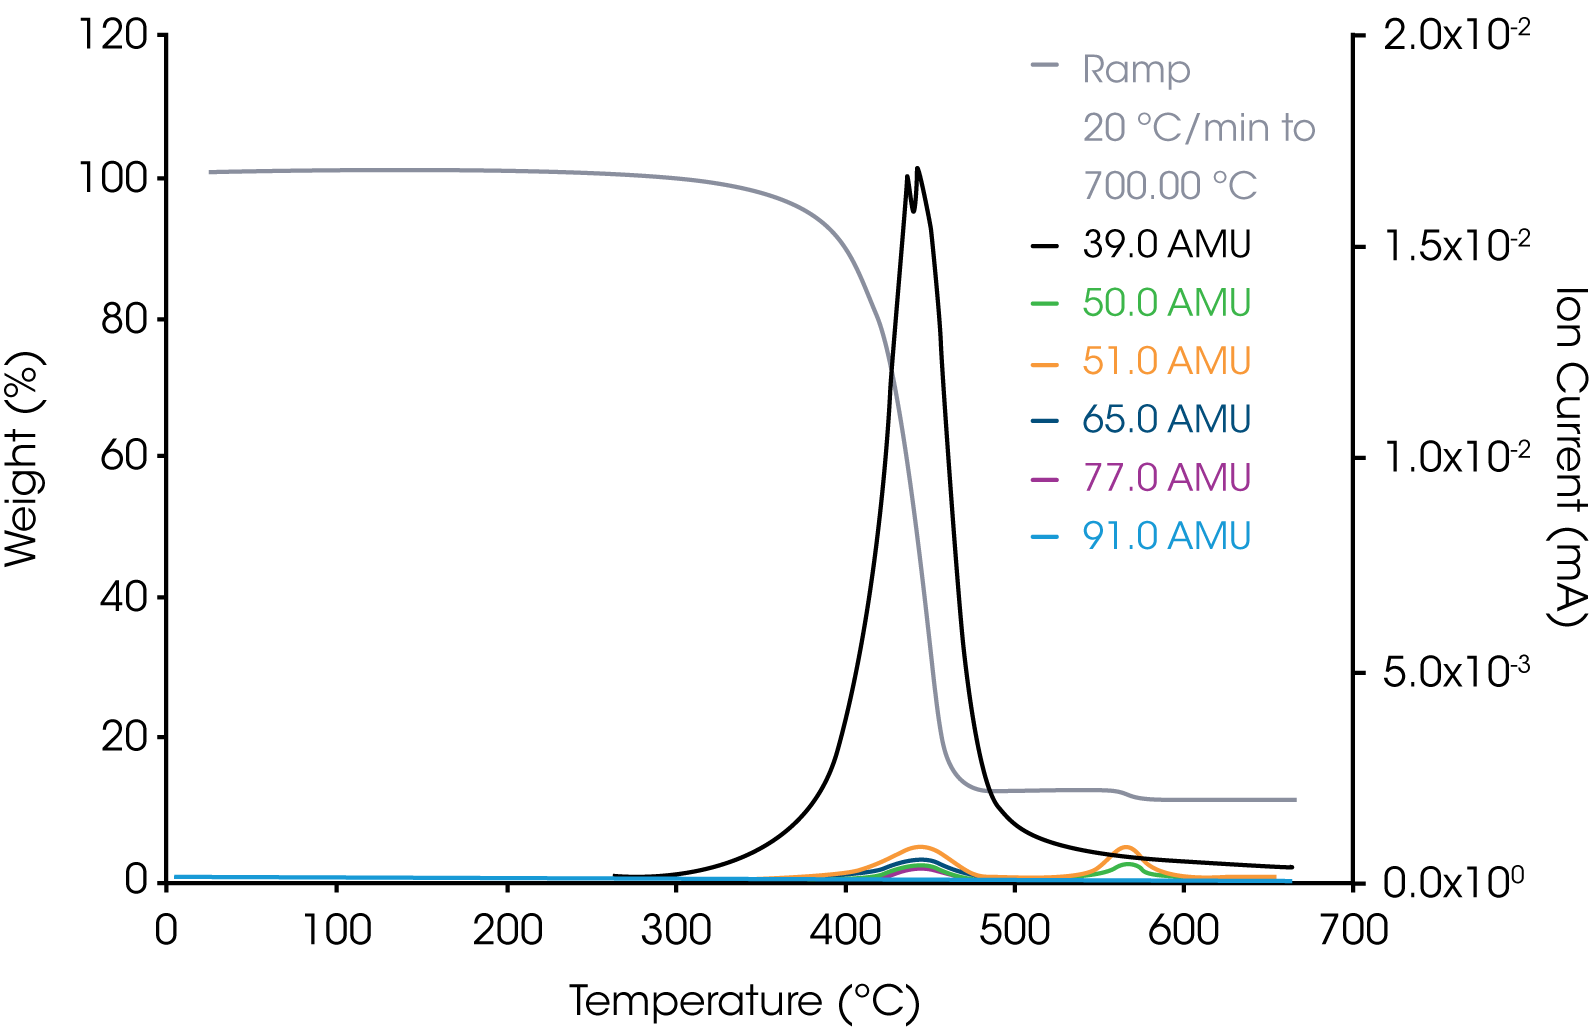
2. Grease Sample – Representative aliphatic and aromatic hydrocarbons are shown in Figures 6 and 7.
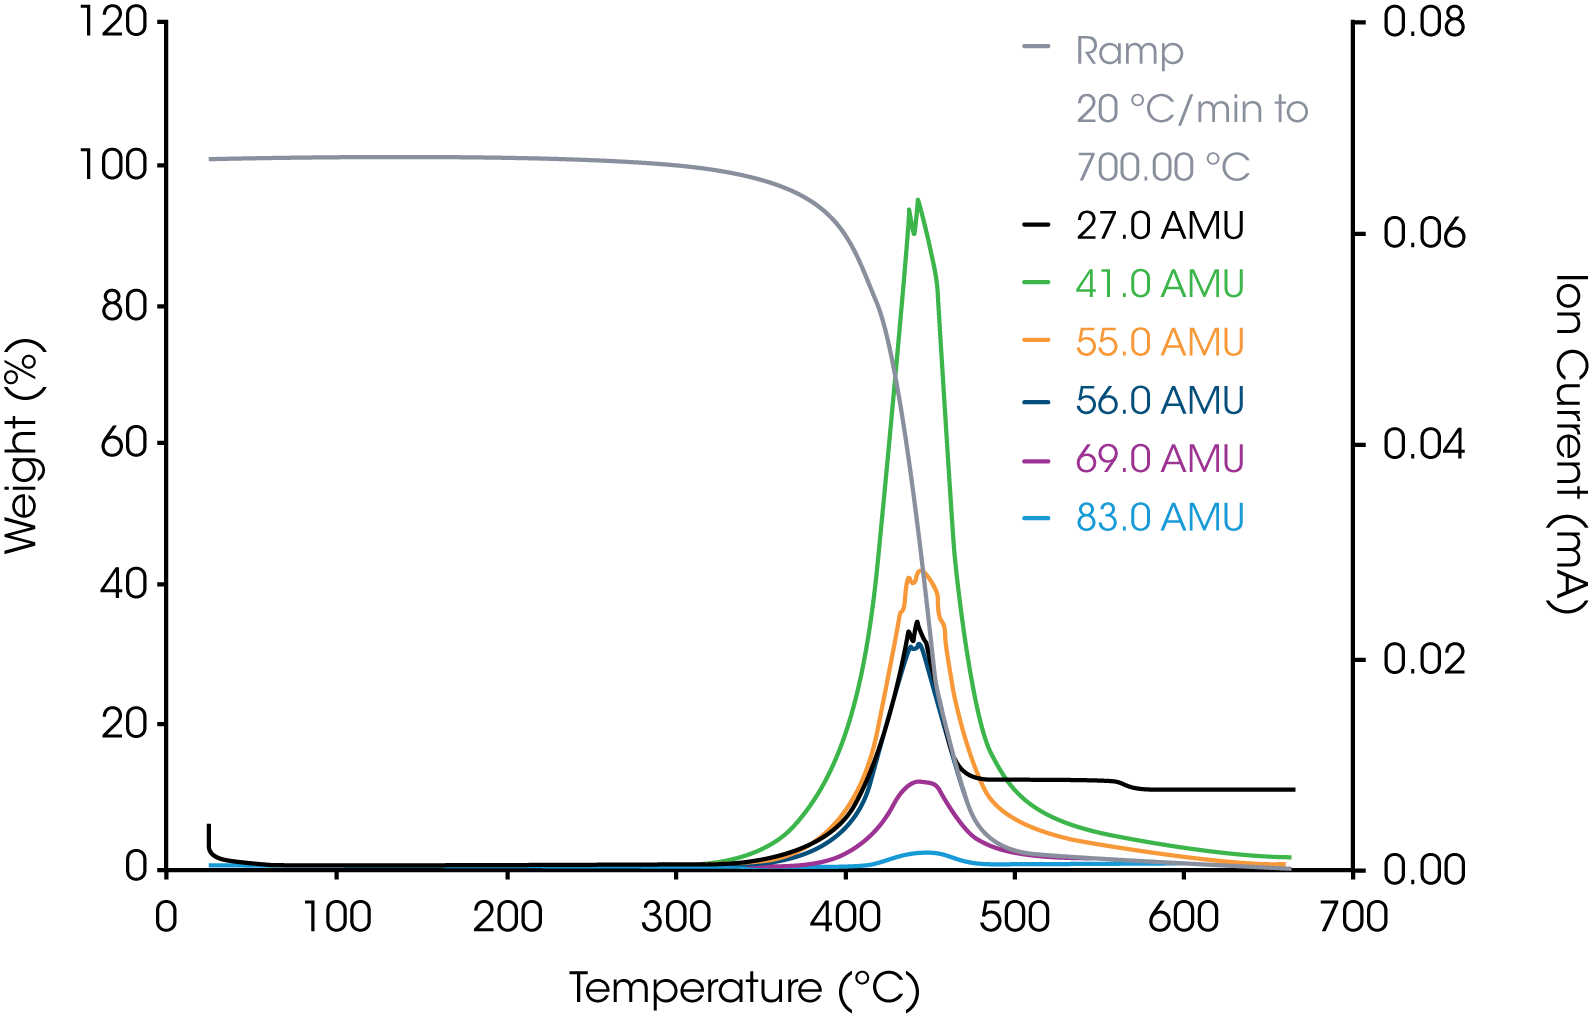
The coelution of m/z 50 and 69 eliminates both from consideration as the analytical ion fragments for the PTFE.
Based on the survey scan of the grease, it appears to be composed of a mixture of aliphatic and aromatic hydrocarbons in addition to the TeflonTM. For the internal reference band, we chose m/z 41 assignable to the allyl cation +C3H5.
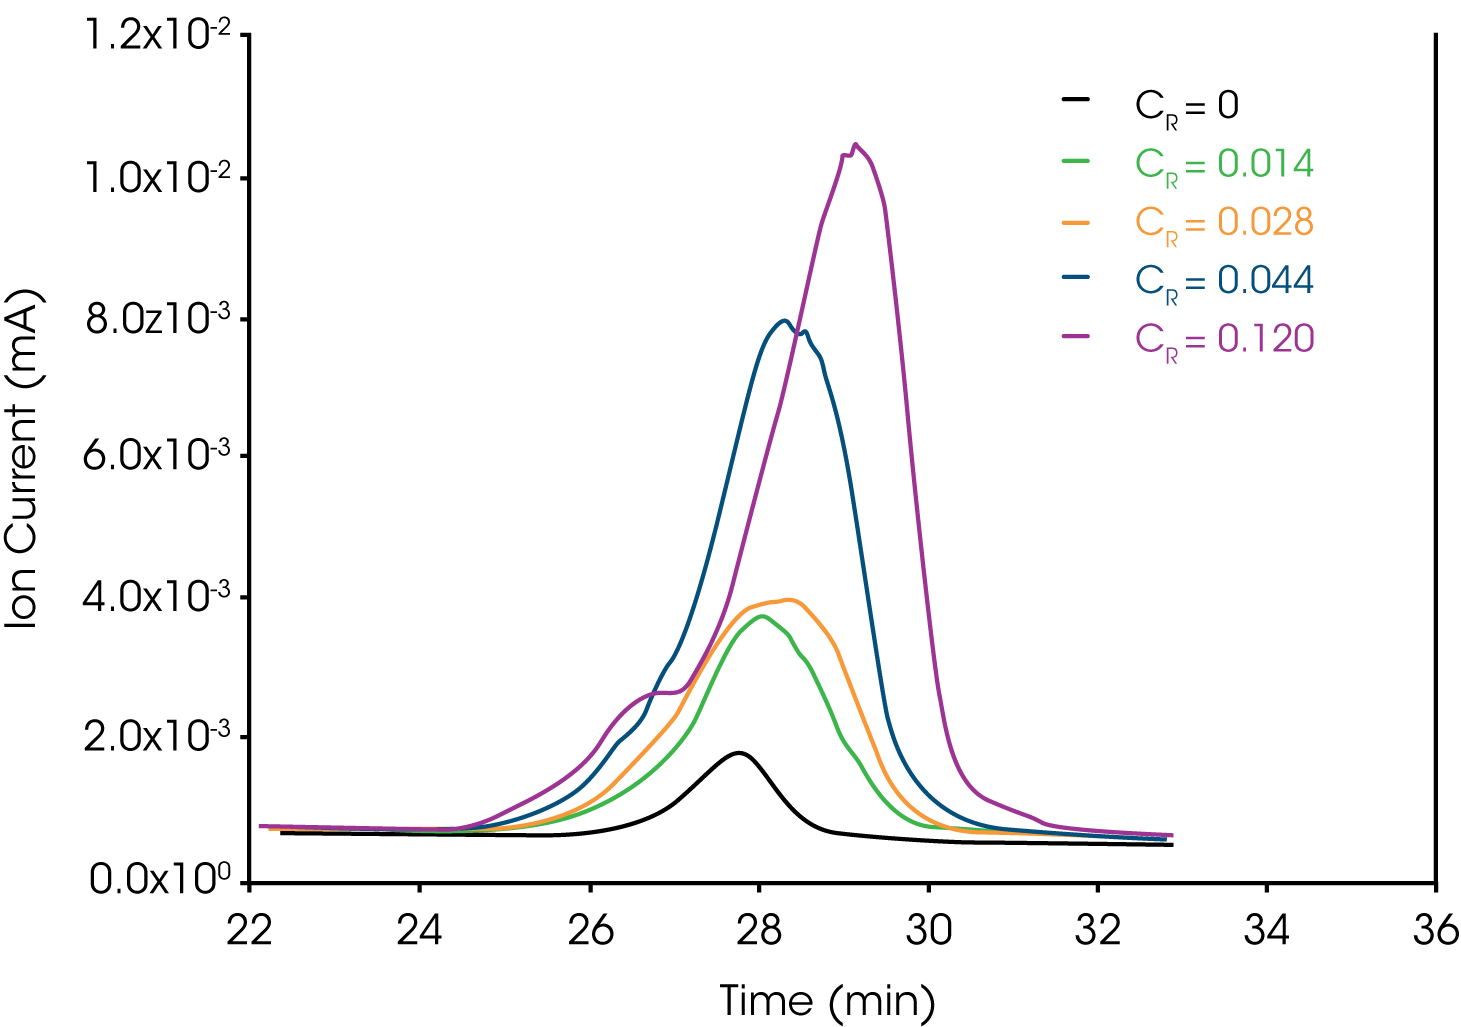
Figure 8 shows an overlay of m/z 31 of the neat sample of the grease and added mass fractions (Cs) of the PTFE reference.
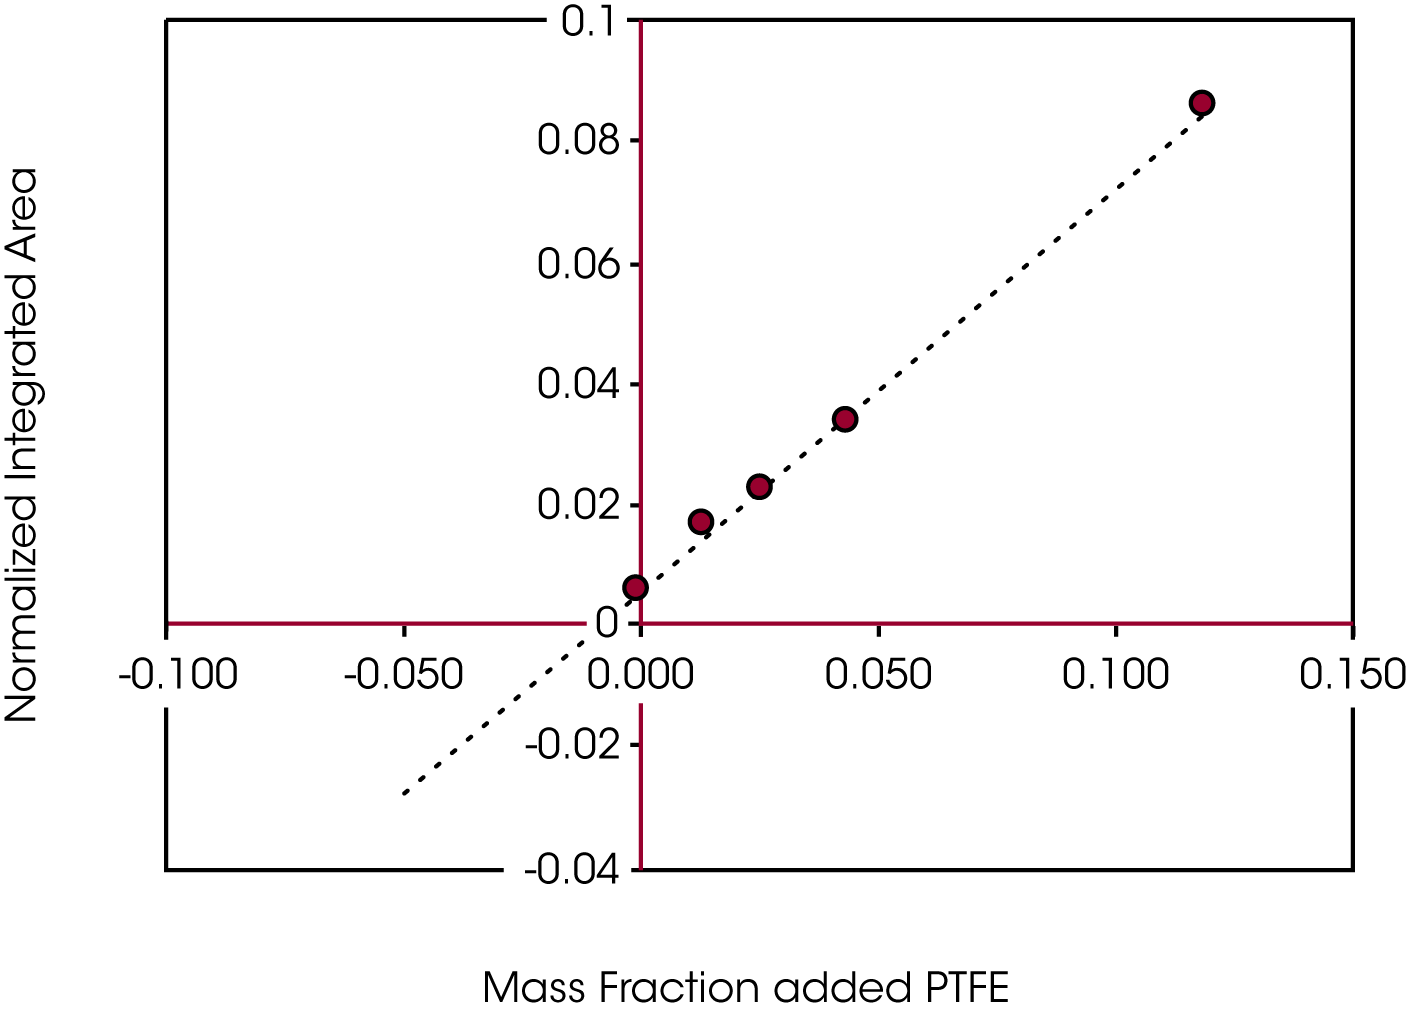
Figure 9 shows the results of the regression obtained when plotting the normalized integrated area of m/z 31 as a function of the mass fraction of added reference PTFE. Obtaining the x-intercept using Equation 2 yields the concentration of TeflonTM in the grease sample.
The concentration of the PTFE in the grease normalizing the integrated area (A) of m/z 31 with the total mass of the sample was calculated as 0.82% ± 0.01%. Normalizing integrated m/z 31 with integrated m/z 41 as an internal band, the concentration was found to be 0.77% ± 0.01%. The error function was calculated using the variances due to the slope, intercept, y-parameter (δyi) (2) (3) (4) and error associated with measuring the sample mass.
Conclusions
TGA/MS is an excellent option for samples that may be difficult to obtain both qualitative and quantitative analysis using other analytical techniques. Some examples include:
- Greases
- Polymer blends
- Soils
- Biomass
- Rubber
- Residual solvent
The methodology is relatively simple and involves sample preparation no more complicated than a TGA experiment.
References
- Mass Spectrometric Study of Ion Molecule Reactions in Tetrofluroethylene. Derwish, Gall, et. al. 1964, Laboratorio de Chimica Delle Radiazione e Chimica Nucleare del CNEN, Istituto de Chimica Generale ed Inorganica, Universita de Roma .
- ASTM E 1970 D6 – Standard Practice for Statistical Treatment of Thermoanalytical Data. s.l. : ASTM.org.
- Miller, JC and Miller, JN. Statistics for Analytical Chemistry. Chichester, West Sussex, England : Ellis Horwood Limited, 1988.
- Skoog, Douglas A. Princlples of Instrumental Analysis. Orlando : Saunders, 1985.
Acknowledgement
- TeflonTM is a registered trademark of The Chemours Company
- Mocrosoft Excel® is a registered trademark of Microsoft Corporation
Click here to download the printable version of this application note.

