Keywords: IVC Filters, Vena Cava Filters, Mechanical Testing, Medical Device Testing, Cardiovascular Medical Device
EF005
The Challenge
Determine the Relationship Between Force and Displacement for Two Types of Inferior Vena Cava Filters.
Background
The vena cava filter is a small medical device implanted in the vena cava to protect against pulmonary emboli. The shape of the filter is designed to catch an embolus in the bloodstream, allowing it to break down by means of clot lysis before it potentially blocks the flow through the pulmonary artery. When an embolus enters the filter, it is directed to the center where is it ensnared until the body’s natural mechanisms reduce it to a safe size.
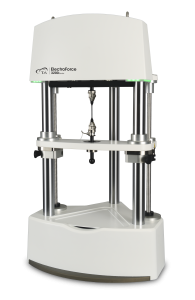
Any device intended for use in the human vascular system must demonstrate the ability to withstand repetitive compression with minimal loss of structural integrity. Mechanical testing techniques are commonly used to quantify the compression characteristics of such devices. The goal of these tests is to determine a relationship between the compressive displacement and the resulting force on the devices. A precise and accurate assessment of force against displacement can be performed by using the ElectroForce® 3200 Series III test instrument (Fig. 1).
Meeting the Challenge
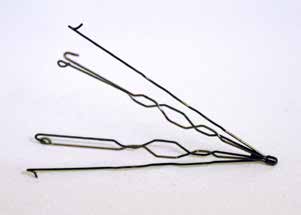
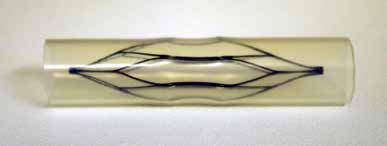
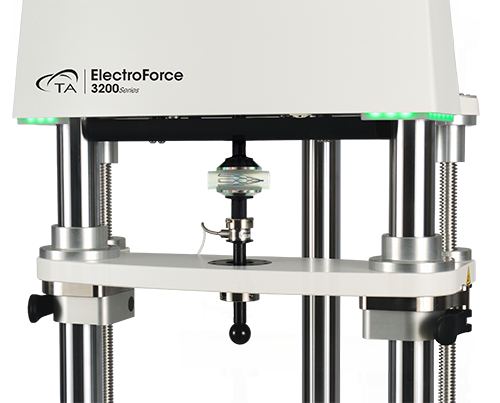
In this test example, two types of inferior vena cava (IVC) filters are tested to reveal their compressive properties. Both types, shown in Figure 2 and Figure 3, were placed inside silicone tubing, simulating the compressive motion of the filter within the vasculature of a filter inside a vein. Diameter measurements of the filter-tube systems were taken so that compression strain values could be calculated based on the approximately 17 mm diameter. As shown in Figure 4, each tube-filter system was placed between 50 mm diameter compression platens in an ElectroForce 3200 test instrument.
The ElectroForce 3200 Series III test instrument is a tabletop system capable of precisely and accurately measuring forces up to 450 N and displacements of up to 13 mm. It is available in two force capacities (225 N Model 3220 and 450 N Model 3230) and can accommodate tensile and compressive testing of many materials. It comes equipped with the WinTest® control software as well as the TRIOS® data plotting and analysis software package. The instrument accommodates optional lower-force sensors, with 5 N and 22 N capacities being the most popular choices. In this test series, a submersible 22 N force sensor was used inside of a saline bath accessory which was programmed for an isothermal temperature of 37 °C.
Both filters were tested using 10Hz sinusoidal loading with 300 cycles of 5% compression followed by 50 cycles of 20% compression. The Block waveform feature within the WinTest software allows many loading types to be programmed and executed sequentially, allowing for either force- or displacement-based modes of measurement. In this set of experiments a multi-step sequence was configured as follows:
- Ramp to an initial preload level of -0.1N (slight compression)
- 10Hz Sine of 5% compression, using relative displacement control to simulate typical loading levels
- Ramp to -0.1N again
- 10Hz Sine of 20% compression, using relative displacement control to simulate aggressive loading levels
- Ramp to -0.1N again to allow for reporting of any height changes
Results
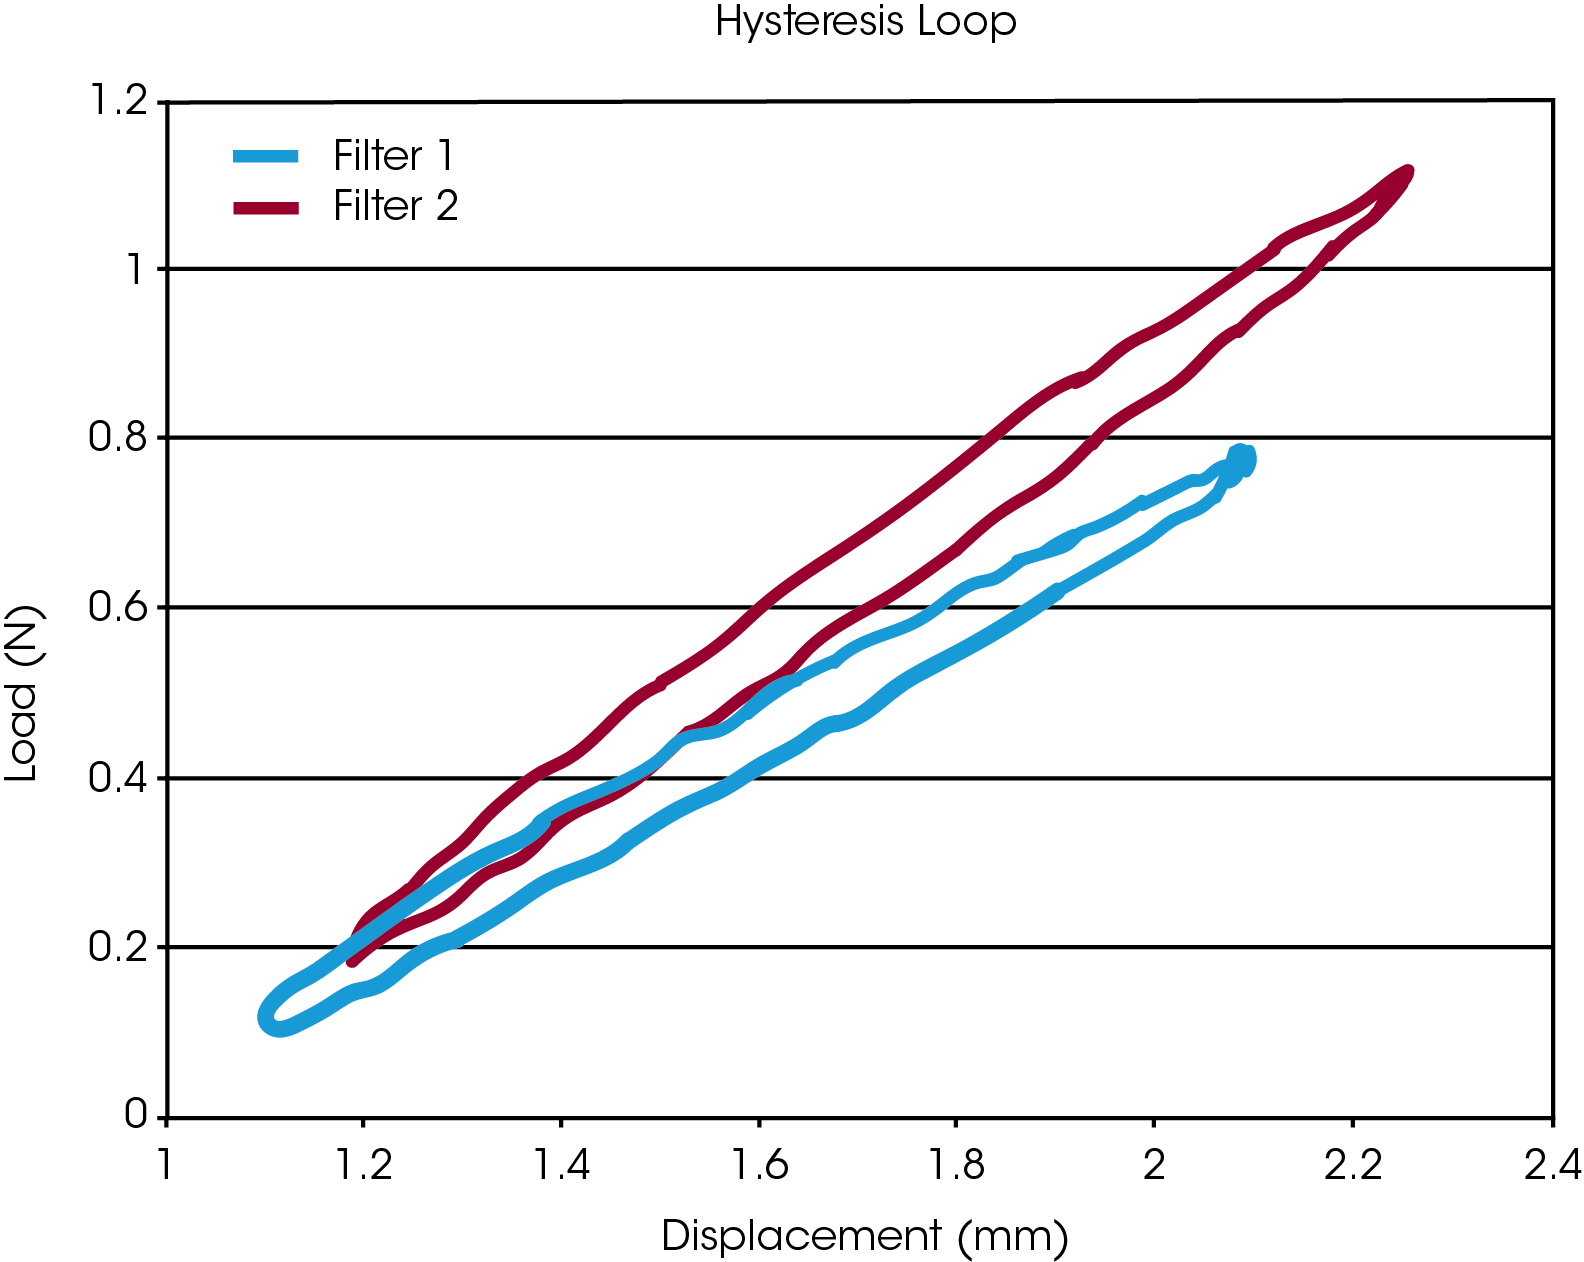
Compressive forces of approximately 1 Newton were measured during the 5% compressive strain test. Figure 5 shows an example comparison of the resultant forces of two filter types during the 5% strain test.
Two common methods of calculating the stiffness of the respective filter-tube specimens are:
- The amplitudes of the force divided by the amplitude of displacement yields one measure of stiffness. This technique is easy to monitor and plot many, or even all, cycles throughout the test. This is done simply with WinTest’s Peak Valley data acquisition where the specimen stiffness equals the difference in force peak and force valley divided by the difference in displacement peak and displacement valley. For long term tests, e.g. a 400 million 10-year life test, this quantity could be evaluated every 10,000 cycles to monitor the change of specimen stiffness over many cycles.
- The force and displacement measurements can be plotted against each other, as shown in Figure 4 for example, and a linear fit can be performed to calculate stiffness. This calculation would likely be done less frequently and requires more data points of acquisition through WinTest’s Timed Data Acquisition feature. It could then be analyzed with any analysis packages. While this does require more data points and more analysis, the higher data resolution of Timed Data provides the additional benefit of monitoring for non-linearities or comparing hysteresis results.
TRIOS, the powerful data plotting, analysis and reporting package from TA is provided with each ElectroForce instrument and could be used to perform either or both of these analysis methods.
For examples, using the data shown in Figure 5, the compressive test of the specimen IVC-1yielded forces ranging from 0.18 to 1.11 N during the displacements of 0.85 mm (5% of 17 mm), as seen in Figure 5. So, its stiffness calculated by method 1 is 1.0 N divided by 0.85 mm for 1.18 N/mm. Similarly, a stiffness of 0.81 N/mm was measured for specimen 2, calculated from forces of 0.1 to 0.79 N.
Although these forces are very small, the ElectroForce® Series III test instrument equipped with a 22 N force sensor and the High Accuracy Displacement Sensor (HADS) was able to create a precise hysteresis loop.
Summary
The 3200 test instrument was used to illustrate the relationship between displacement and the resulting force on vena cava filters. Using the block waveform feature of the WinTest software, these tests were run at 5% and 20% compression to determine the resulting force. Force-displacement graphs were created to compare the stiffness of the inferior vena cava filters. The obtained data demonstrates a clear way to accurately evaluate the relationship between displacement on the filter and the measured force.
Additional Testing Considerations
Other mechanical test techniques are often carried out on similar implantable cardiovascular devices and their materials:
- ISO 25539 and ASTM F2477 conducted on a DuraPulse SGT (Stent Graft Test) Instrument
- ASTM F3211 and ASTM F3374 on an MSF16 (Multi Specimen Fatigue 16) test instrument.
About the Instrument
The highly adaptable ElectroForce 3200 test instrument is well suited for characterization of forces on cardiac biological implants, such as this low-cycle characterization of vena cava filters. It also has unmatched durability for executing long-term tests such as 400-600 million cycle tests simulating 10- or 15-years of heartbeats. Beyond devices, it is also well-suited to characterize the healthy or diseased tissue that cardiovascular devices must interact with in the body. This versatile instrument is capable of testing at a wide range of test speeds and frequencies as high as 300 Hz for a variety of test situations. The instrument is capable of also quantifying the viscoelastic response of materials and tissue. It is an exceptional option for a variety of test applications from sub-Newton to 450N of force.
As this test and countless other applications examples demonstrate, the ElectroForce 3200’s superior accuracy, versatility and software allow researchers and device developers to create lifesaving, durable implantable devices that are proven to consistently perform for many years of human heartbeats.
Technology Highlight
HADS vs transitional analog sensors:
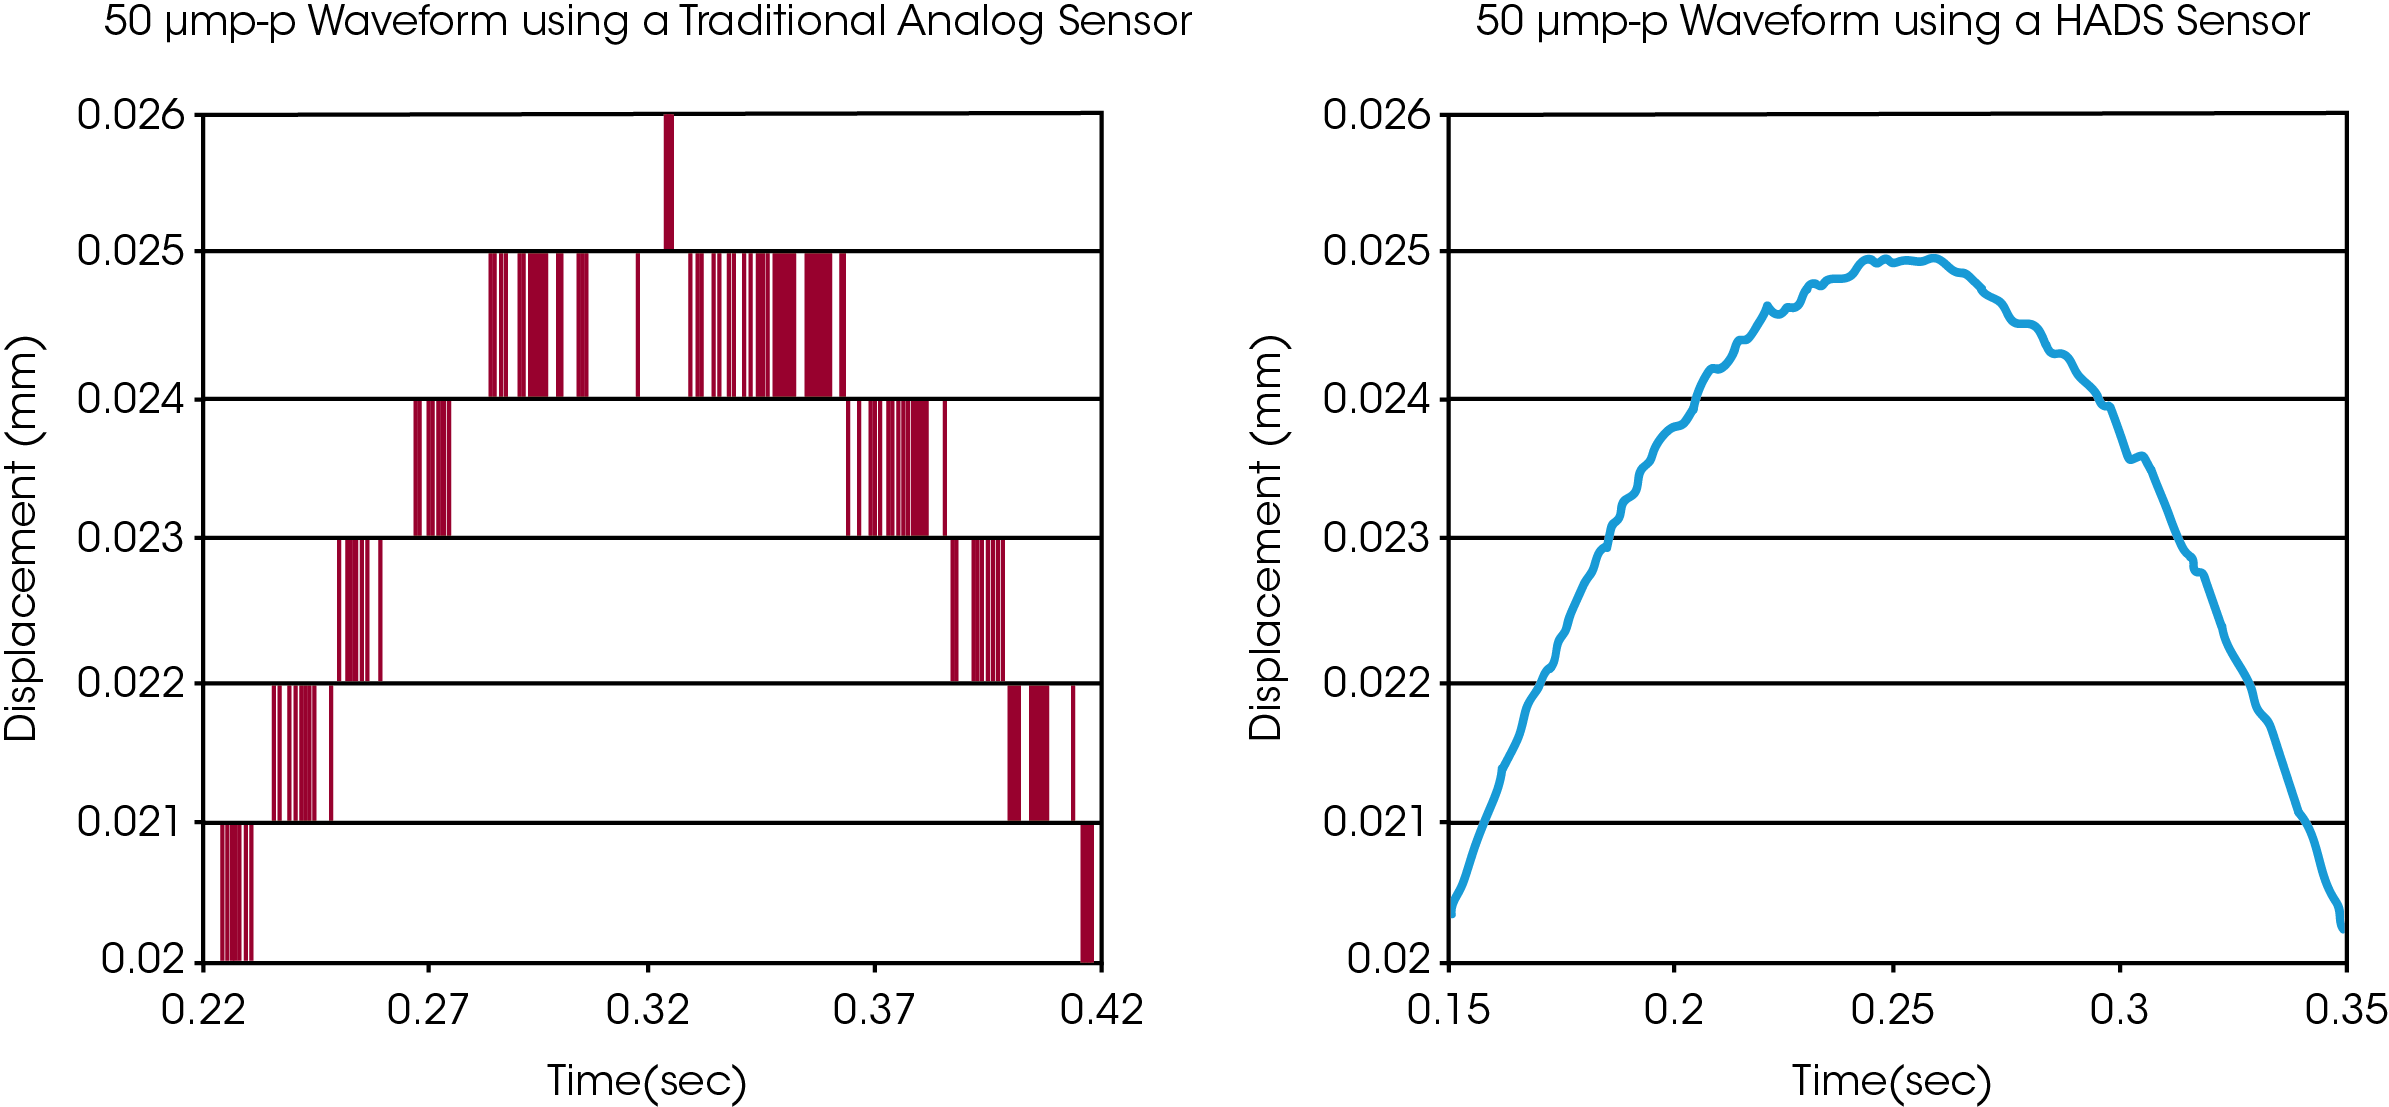
TA Instruments’ High Accuracy Displacement Sensor (HADS) is the most accurate and precise displacement sensor available today. With 1 nanometer resolution and 2 microns accuracy, HADS provides superior displacement measurements far exceeding even Class A of ASTM E2309 specifications. HADS measurements have extremely low noise, effectively eliminating the need to filter data, and HADS’ single displacement channel provides both absolute and high-resolution measurements. The sensor’s high responsiveness extends the dynamic performance and control capabilities of the instrument. Linear HADS measurement is standard on ElectroForce 3200, 3300 and 3510 instruments, and rotation HADS measurement is standard on 3200-AT and 3300-AT systems.
Acknowledgement
Click here to download the printable version of this application note.

