Keywords: Battery Performance, Cycling Batteries, Coulombic Efficiency, Battery Cycler Microcalorimeter Solution, Microcalorimetry, Electrochemistry, lithium-ion batteries, parasitic reactions, battery life
MC169
Abstract
Cycling batteries to failure is time prohibitive and delays the analysis of data that is key to the development of new battery chemistries. One continuing challenge is determining the activity of parasitic reactions, which can significantly impact the performance and longevity of lithium-ion batteries. In-situ electrochemical calorimetry is the leading technique for the study of these parasitic reactions. The Battery Cycler Microcalorimeter Solution combines sensitive isothermal microcalorimetry with electrochemical analysis. In this work, it is used to measure the parasitic power of a Panasonic NCR18650GA cell. The results can be utilized to judge cell quality, aid in active material formulation, investigate the impact of additives, study the formation and growth of the solid electrolyte interphase, and as an input for cycle and calendar life prediction models.
Introduction
The cycle life, efficiency, and overall quality of a lithium-ion battery (LIB) is largely determined by the reversibility of the electrochemical reactions that occur during charging and discharging [1]. Although the determination of cycle life is relatively straightforward from an analytical perspective, it remains a major bottleneck in the testing workflow [2]. Cycling a cell to failure is a process that can take many months, significantly slowing the pace of research and delaying information critical for quality control. Emerging research trends are focusing on the identification of diagnostic attributes that can be used to accurately predict long-term behavior [2,3]. A leading example is the study of parasitic reactions, which have been associated with increased capacity fade, diminished coulombic efficiency, and early cell failure [1,2,4,5]. A parasitic reaction is a blanket term for any side-reactions, chemical or electrochemical, that occur within a battery. This can include breakdown of the solvent, lithium plating, growth of the SEI (solid electrolyte interphase), breakdown of the SEI, and self-discharge [5].
Evaluating the Coulombic efficiency is the classical technique for measuring how much energy is lost in a battery cycle, with the losses assumed to be caused by parasitic reactions (Equation 1).

While the determination of Coulombic efficiency is useful, it only accounts for energy lost to electrochemical side reactions. Due to the complexity and variety of parasitic reactions within a lithium-ion battery, the full extent of the behavior of the chemical and electrochemical processes is not reflected in the Coulombic efficiency [2,6]. To fully capture the activity of parasitic reactions under cycling conditions, a secondary analytical technique must be combined with electrochemistry in-situ. The leading strategy towards this effort is the coupling of high resolution isothermal microcalorimetry with established electrochemical techniques [1,2,4,5,7].
Electrochemical calorimetry is a tool that examines the heat flow activity of a battery during active cycling. While it is a powerful technique, the complexity and labor-intensive data processing has inhibited its practical value. This process typically involves customizing the hardware to accommodate the experiments, synchronizing the parameters and experiment start-times on two instruments with distinct software interfaces, merging the data files, and performing the necessary calculations prior to seeing the first plot. The Battery Cycler Microcalorimeter Solution from TA Instruments is designed to streamline this process by integrating the calorimeter and the potentiostat at the hardware and software levels.
The Battery Cycler Microcalorimeter measures the real-time heat flow activity of a battery using standard cell formats such as coin, 18650, and pouch cells. Measurements can be made over a range of temperatures and cycling conditions. The data from the calorimeter and the potentiostat are time stamped to accurately correlate thermal events with electrochemical stimuli. The thermal contribution of parasitic reactions (parasitic power) is isolated from the total heat flow signal using a series of calculations performed automatically by TAM Assistant, the data acquisition and analysis software from TA Instruments. In this note, the TA Instruments Battery Cycler Microcalorimeter Solution is used to investigate battery efficiency and parasitic reactions of a Panasonic NCR18650GA cell.
Experimental
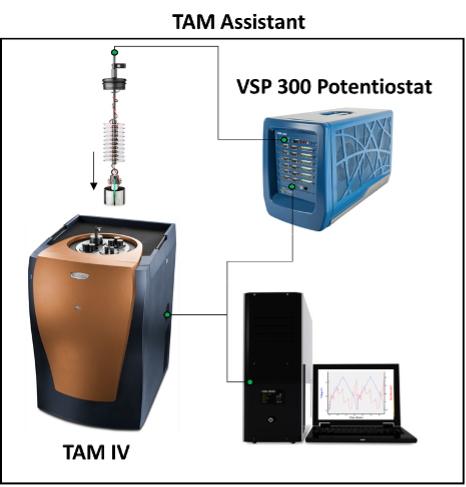
The Battery Cycler Microcalorimeter Solution integrates a high precision potentiotstat, the BioLogic VSP-300 Potentiostat, with the TA Instruments TAM IV isothermal microcalorimeter. TAM Assistant controls both the calorimeter and potentiostat to automatically correlate heat flow events with electrochemistry in the results files, as shown in Figure 1.
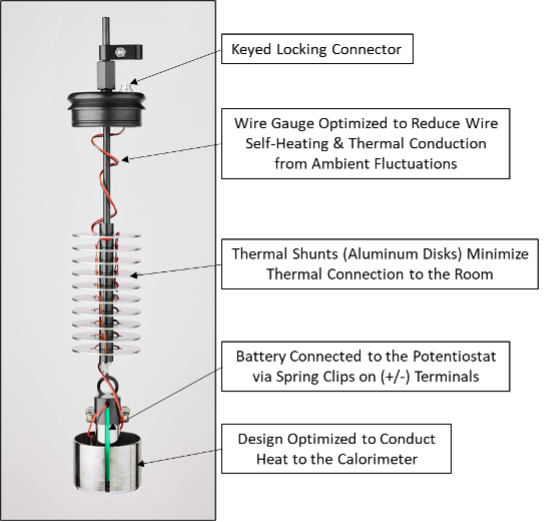
The pre-wired lifters for the TAM IV make electrical contact between the potentiostat and the battery while also minimizing noise from ambient thermal fluctuations in the room. There are spring clips at the top (+) and bottom (-) terminals that make firm contact between the battery and lifter, with no soldering or further electrical isolation required. The four-wire connection is made to the battery in a two-electrode configuration, with two wires for the current and two wires for the (+/-) voltage sense. The four wires lead to a keyed connector, where a cable (trimmed to length) will interface with the potentiostat leads. Figure 2 details the different design components in the Macrocalorimeter lifter for 18650 battery cells.
Calibration
The system is calibrated using the external battery-shaped calibration heater that is available for each lifter type. These calibration heaters mimic the physical dimensions of a real cell and contain a 1000 Ω high precision resistor to output a known amount of heat. TAM Assistant contains a variety of experiment wizards, including a calibration wizard to walk the user through the method.
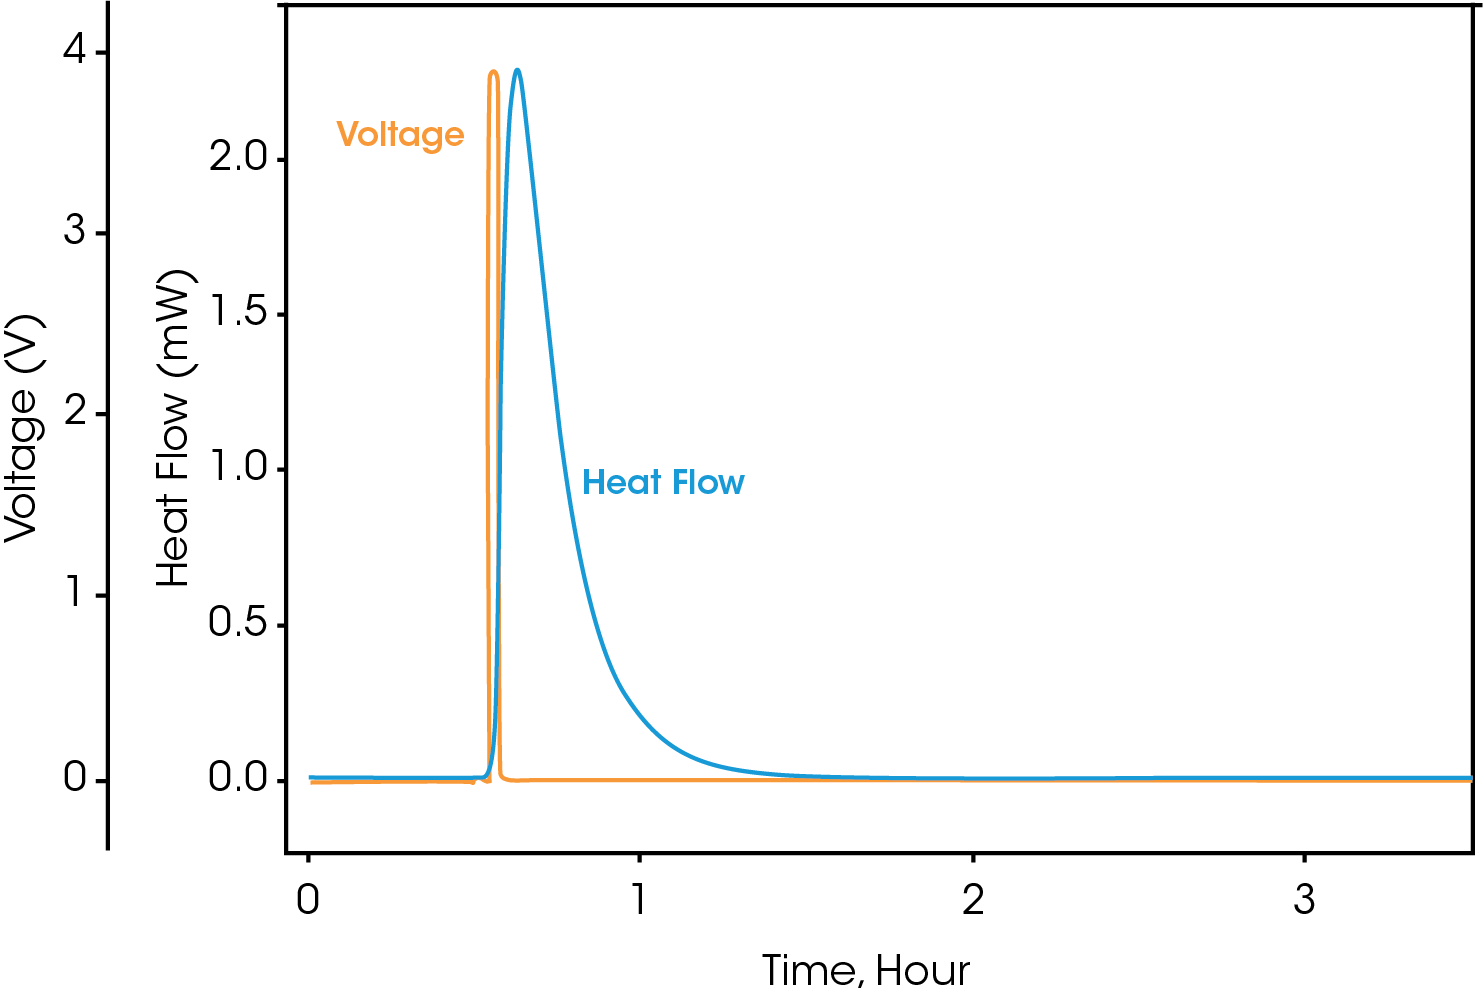
To begin calibration, install the calibration heater into the lifter and load into the calorimeter using the standard operating procedure found in the Battery Cycler Microcalorimeter Getting Started Guide. Allow the calibration heater to come to thermal equilibrium with the bath temperature and allow the baseline to stabilize. When prompted, the potentiostat will apply a pulse of current, causing the calibration battery to output a known amount of heat. Figure 3 shows the results file for a gain calibration, with the voltage and heat flow signals plotted vs. time.
This calibration method yields values for both the gain and offset. Temperature-dependent calibrations are performed on each empty calorimeter at a TA Instruments facility prior to shipping. Any change to the calorimeter configuration, including insertion of the lifter, results in a deviation from the calibrated value. The gain factor corrects for these differences, producing a gain constant unique to the user’s configuration. The offset is the deviation of the baseline signal from zero, which is automatically adjusted following the calibration.
Determination of Parasitic Heat on an 18650 LIB
The bath of the TAM IV was set to 40 oC and allowed to stabilize for 24 hours. A 3400 mAh Panasonic NCR18650GA LIB cell was loaded into the battery lifter and inserted into the calorimeter using the standard method. The battery was precycled between 3.0 and 4.2 V at 250 mA, for a total of 10 cycles to condition the battery at the testing temperature (10 to 20 cycles are recommended). Following this was a 24-hour rest period to reach thermal equilibrium and stabilize the battery chemistry. The measurement of parasitic heat should be performed at slow charge cycling rates (C-rates) for the best results. This cell was cycled at 172 mA (C/20), for 5 cycles between 3.0 and 4.2 V, with a 1-hour rest period between each charge and discharge step. The Battery Cycler Wizard in TAM Assistant was used to program and execute the experiment.
Theoretical Background
The heat flow signal during battery cycling is described by Equation 2 [1,5,7]

Where:
- QTotal is the total heat flow
- QPar is the parasitic power
- QImp is the impedance power
- QEnt is the entropic power
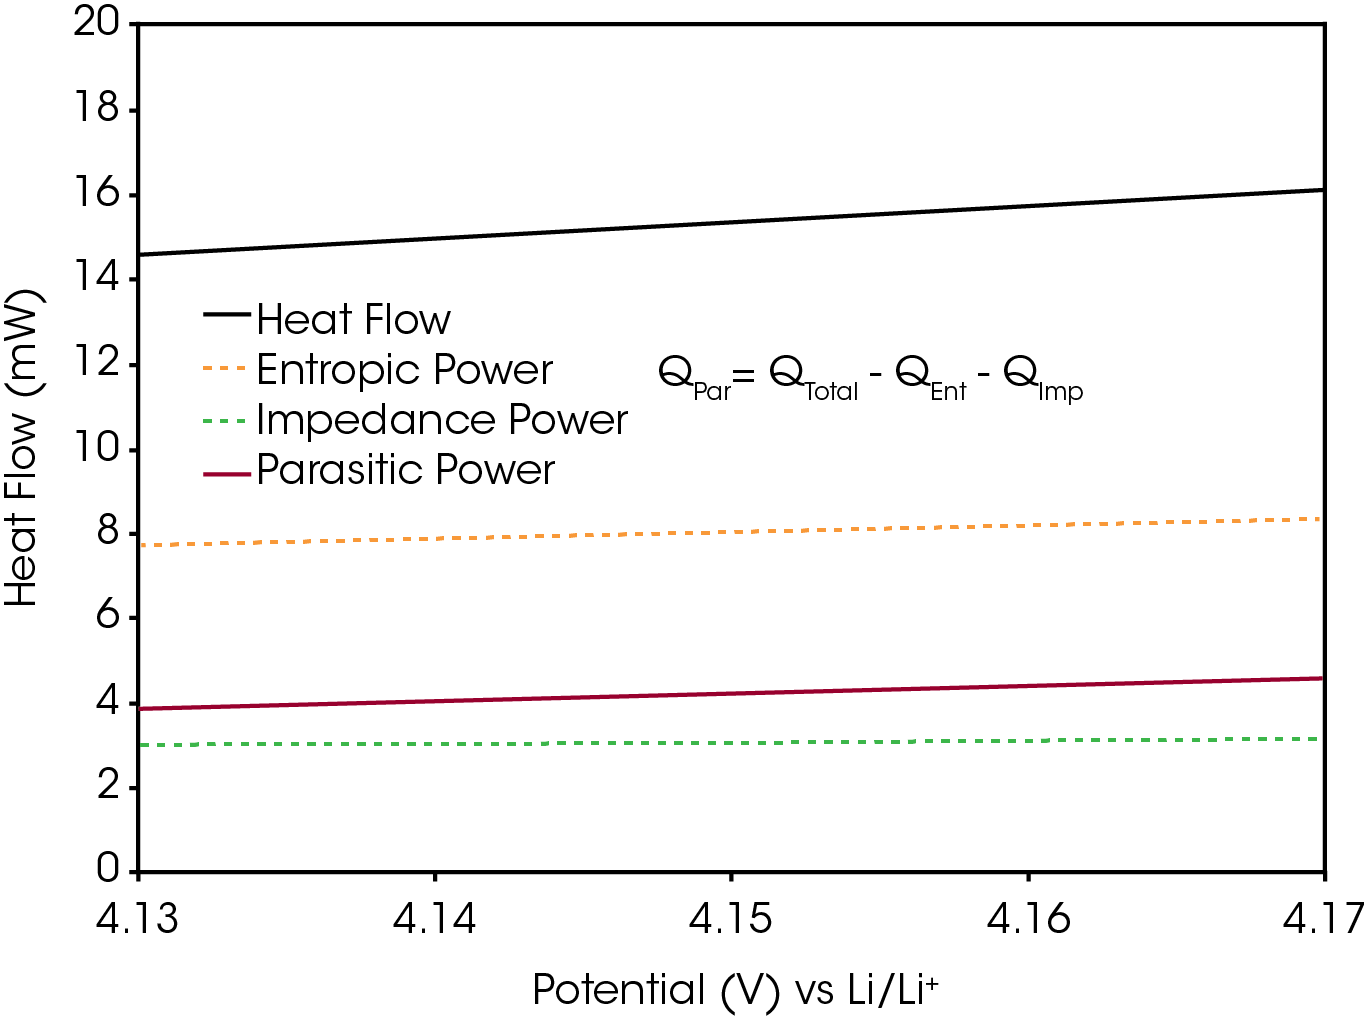
The primary signal of interest is QPar, the parasitic power. It is the summation of the thermal energy produced from the non-reversible side reactions in a battery. To isolate this signal from the total heat flow, the impedance power (QImp) and entropic power (QEnt) must be subtracted. The entropic power describes the heat flow associated with reversible changes in entropy. It is typically the largest contribution to the total heat flow during a charging or discharging operation, as seen Figure 4. The entropic power is primarily caused by lithium intercalation / deintercalation and the corresponding structural changes to the active materials, such as graphite layer expansion. These processes are reversible, so their associated heat flows are also reversible. As such, the entropic power during charging should be equal in magnitude, but opposite in sign, to the entropic power during discharging [5]. Equation 3 describes the summation of the integrated total heat flows over one full cycle to remove the contribution of QEnt from QTotal, leaving only QPar and QImp.

Where Q is the heat flow signal, t is the time, and the subscripts d or c denote a discharging and charging operation, respectively.
The impedance power is the waste heat generated by passing current through a resistive material, also known as Joule heating. It can be calculated from the electrochemical data and Equation 4.

Where I is the applied current and η is the overpotential.
The overpotential in this equation represents the difference between the open circuit voltage and the voltage when under load. The applied current will be constant, but the overpotential will vary depending on the state of charge. It can be measured directly by applying an open circuit pulse at periodic intervals, or by plotting the voltage vs capacity and measuring the hysteresis of the charge and discharge curves. Over a full cycle, the average impedance power can be calculated using Equation 5.

Where I is the applied current and V is the voltage during a charging or discharging operation.
This signal is always exothermic, but its contribution can be minimized by using slow C-rates. Once the average values for the impedance and entropic power are determined, Equation 6 can be used to determine the Average Parasitic Power per cycle.

Where, by definition, QEnt,cycle will be equal to zero.
Results and Discussions
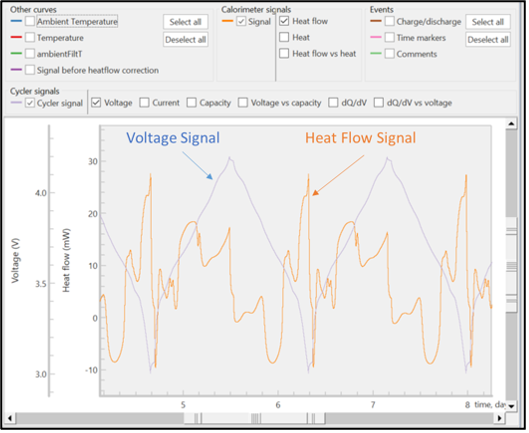
The unprocessed signals of heat flow and voltage are displayed in Figure 5. All raw signals are time stamped so the electrochemical and calorimeter data can be accurately correlated. The raw signals of voltage, current, and heat flow can be observed during an active experiment, but the calculated values can only be obtained after the experiment has ended.
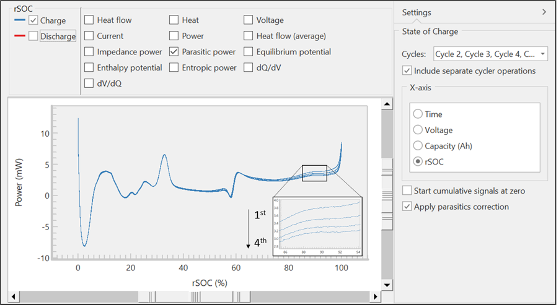
From these raw signals, TAM Assistant will automatically calculate key values and present them in a table or as a plot. Figure 6 shows a view of the plotting window, with several options for the x-axis on the right, and many options for the y-axis near the top of the window. The software includes the ability to overlay different calculated and raw signals, overlay different cycles, and separate charge from discharge. These tools were designed to maximize flexibility, speed, and ease of use, so the operators could more effectively find key trends or features within the data.
The data in Figure 6 shows the parasitic power of the charging branch over four cycles vs. relative state of charge (rSOC). The spikes at the upper and lower rSOC bounds are artifacts, resulting from the inherent asymmetry near the edges of the voltage and heat flow curves. These are referred to as edge effects [5]. Closer inspection of the overlayed curves will show the parasitic power decreasing with each cycle, matching classical behavior for the formation of a passivation layer, like the SEI [8].
Across multiple cycles, we can also observe trends in the data. Figure 7 shows the average parasitic power and the Coulombic efficiency across four cycles. As the parasitic power decreases, the Coulombic efficiency increases, in agreement with previous studies [5]. This matches theoretical expectations since they are measuring the same event from opposing sides. The Coulombic efficiency is a measure of the electrochemical efficiency; conversely, the parasitic power is a measure of the inefficiency, including both chemical and electrochemical side reactions. It is good practice to track the Coulombic efficiency, as it can be used to validate the thermal data, as done in Figure 7.

Conclusions
Quantifying parasitic activity is critical to judging the efficiency, the quality, and to understanding the underlying chemistry of lithium-ion batteries. A TA Instruments Battery Cycler Microcalorimeter Solution was used to investigate parasitic power in a Panasonic NCR18650GA cell. TAM Assistant facilitates the integration and control of the thermostat, calorimeters, and potentiostat, improving the practical utility and usability of battery calorimetry. Over multiple cycles, trends such as increasing Coulombic efficiency with decreasing parasitic power, are measured. This data can aid researchers with new active material formulations, showing the impact of additives on reducing parasitic activity, studying the SEI, and for screening out cells that have higher than normal parasitic activity in quality control.
References
-
- L.J. Krouse, L.D. Jensen, J.R. Dahn. Measurement of Parasitic Reactions in Li Ion Cells by Electrochemical Calorimetry. J. Electrochem. Soc. 2012, 159 (7), A937-A943.
pdf (iop.org) - J.C. Burns, Adil Kassam, N.N. Sinha, L.E. Downie, Lucie Solnickova, B.M. Way, J.R. Dahn. Predicting and Extending the Lifetime of Li-Ion Batteries. J. Electrochem. Soc. 2013, 160, A1451.
Predicting and Extending the Lifetime of Li-Ion Batteries – IOPscience - Wei Xiong, Gang Xu, Yumei Li, Feng Zhang, Pang Ye, Ben Li. Early prediction of lithium-ion battery cycle life based on voltage-capacity discharge curves. Journal of Energy Storage, 2023, 62, 106790. Early prediction of lithium-ion battery cycle life based on voltage-capacity discharge curves – ScienceDirect
- L.E. Downie, S.R. Hyatt, J.R. Dahn. The Impact of Electrolyte Composition on Parasitic Reactions in Lithium Ion Cells Charged to 4.7 V Determined Using Isothermal Microcalorimetry. J. Electrochem. Soc. 2016, 163 (2), A35-A42.pdf (iop.org)
- L.J. Krouse, L.D. Jensen, V.L. Chevrier. Measurement of Li-Ion Battery Electrolyte Stability by Electrochemical Calorimetry. J. Electrochem. Soc. 2017, 164 (4), A889-A896.Measurement of Li-Ion Battery Electrolyte Stability by Electrochemical Calorimetry – IOPscience
- Seong Jin An, Jianlin Li, Claus Daniel, Debasish Mohanty, Shrikant Nagpure, David L. Wood. The state of understanding of the lithium-ion-battery graphite solid electrolyte interphase (SEI) and its relationship to formation cycling. Carbon, 2016, 105, 52-76.
- Alexander Kunz, Clara Berg, Franzika Friedrich, Hubert A. Gasteiger, Andreas Jossen. Time-Resolved Electrochemical Heat Flow Calorimetry for the Analysis of Highly Dynamic Processes in Lithium-Ion Batteries. J. Electrochem. Soc. 2022, 169, 080513.Time-Resolved Electrochemical Heat Flow Calorimetry for the Analysis of Highly Dynamic Processes in Lithium-Ion Batteries – IOPscience
- Luchkin, S.Y., Lipovskikh, S.A., Katorova, N.S., Savina, A.A., Abakumov, A.M, Stevenson, K.J. Solid-electrolyte interphase nucleation and growth on carbonaceous negative electrodes for Li-ion batteries visualized with in situatomic force microscopy. Sci Rep,2020, 10, 8550. https://doi.org/10.1038/s41598-020-65552-6
- L.J. Krouse, L.D. Jensen, J.R. Dahn. Measurement of Parasitic Reactions in Li Ion Cells by Electrochemical Calorimetry. J. Electrochem. Soc. 2012, 159 (7), A937-A943.
Acknowledgement
This paper was written by Jeremy May, PhD at TA Instruments
Click here to download the printable version of this application note.

