The most innovative tool for production and R&D laboratories for the optimization of all industrial processes involving thermal cycles.
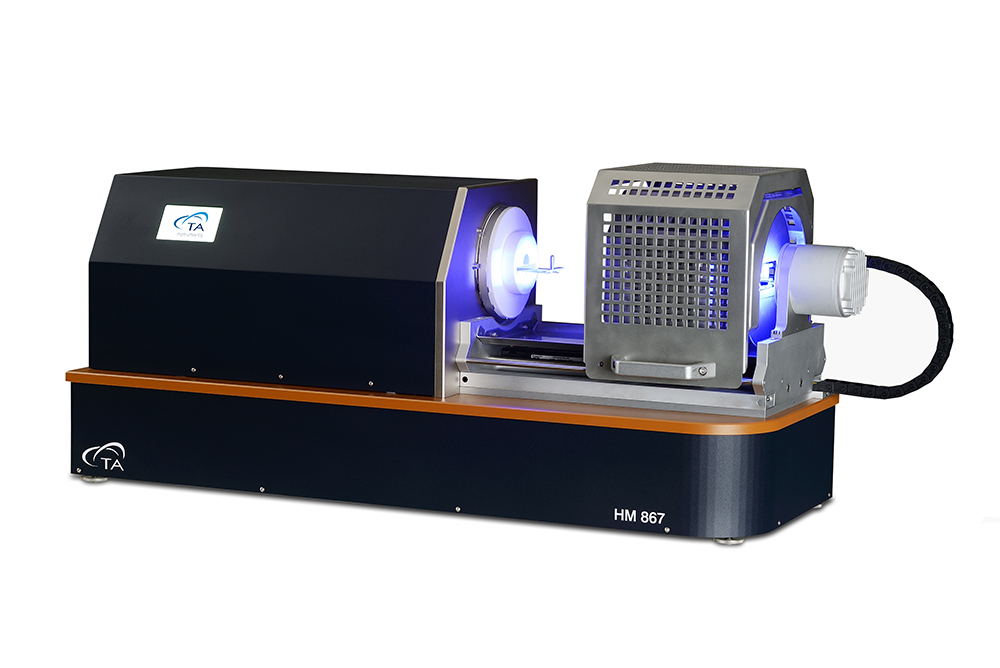
The Optical Dilatometry Platform HM 867 is a stand-alone Heating Microscope that is a standard instrument for process optimization in the ceramics industry. A single camera on the optical bench frames the entire sample and records the sequence of the characteristic shape changes and the temperature throughout the experiment. This is ideal for identifying all key material change events including sintering, softening, full sphere, half-sphere, and melting. Dimension changes up to 100% can be measured. With a maximum temperature scanning rate of 80°C/min, it has a built-in purge gas system that enables the user to test specimens in air, oxidative, reductive and protective atmospheres. The heating microscope is available as a standalone instrument, HM 867, or as an option on the Optical Dilatometry Platform, ODP 868.
|
HM 867 |
|
| Optical measuring system | Optical measuring system equipped with a 5 MPix HiRes videocamera |
| Operating modes | Heating microscope |
| International Standards | ASTM D1857, CEN/TR 15404:2010, BS 1016:Part 15:1960, CEN/TS 15370-1:2006, DIN 51730,DM 05-02-1998, IS 12891:1990, ISO 540:1995, NF M03-048 |
| Sample displacement | Bidimensional |
| Sample number | From 1 up to 8, depending upon samples sizes |
| Temperature range on specimen | RT – 1600 °C |
| Temperature resolution | 0,2 °C |
| Heating rate | 0,1 – 100 °C/min |
| Resolution | 5ppm with ISO standard sample |
| Sample dimensions: | ASTM and ISO standards |
| Reference materials | Gold wire – Palladium wire |
| Morphometrics | Height, Width, Contact angle, Height/Width Ratio, Perimeter, Area, Roundness, Eccentricity, Center of mass More and freely user-selectable also possible |
| Atmosphere | Air |
| Light source | LED |
Misura® thermal analysis software has been designed and developed by Expert System Solutions for the management of the instruments and data acquired. Misura® represents also the name and trademark of the whole range of our instruments.
The user-friendly features and the ease of usage make Misura® thermal analysis software a perfect tool for laboratory and R&D.
Since our company was originally born as a software house, our qualified staff can offer continuous updates on operative systems and on software features, also according to customer needs.
The customer who uses our equipment can manage the data of each instrument by using the same database and software. This allows a complete characterization of the analysed materials and a comparison between the different measurements acquired through heating microscopes, optical dilatometers, optical fleximeters and DTA.
Furthermore, we offer an after sales service based on the Internet, which is the perfect way to solve the majority of the problems. It is very useful and quick and only an internet connection is required.
Acquisition
Acquisition
It allows to carry out an automatic test on a sample during the firing cycle, which is characterised by the requested temperature gradient. It is also possible to set several parameters for the real time acquisition (according to the kind of materials) of the images and data during the firing cycles.
Furthermore, it can analyse automatically the coefficient of expansion, the glass transition temperature and the dilatometric softening temperature and the sintering process of the materials. During the acquisition it is possible to check the expansion and contraction of the material by a real time graph.
Archive
Archive
It is possible to manage the stored tests, recall them to control, modify and print the data and/ or images of the tests. The user has the complete management of the database for the compression and discharge of the data and/or acquired images to peripheral units. Furthermore, it allows to open directly and automatically the pertinent graph for each analysis.
Graphs
Graphs
The data obtained from the memorized data are immediately available in graphs. All curves can be viewed or printed singularly or overlapped with other curves relevant to other tests and it is possible to view or print different curves of the same test: expansion, its first derivative, the second derivative, coefficient of thermal expansion vs. temperature or time profile. Furthermore, it automatically calculates Alpha (α), cubical Alpha value and Delta (Δ) L/L0, the Glass Transition temperature (Tg) and the Dilatometric Softening temperature (Ts) of the thermal expansion curve acquired.
Parameters
Parameters
This function allows to store the parameters for the analysis of the materials, such as the firing cycle and the acquisition interval of the data and/ or images.
Classes
Classes
This function allows to define a file of classes, whose tests can be put together to better classify them (i.e. frits, glazes, enamels, steel…, etc). Inside the card of each test there is a class field, which can be used to separate, for example, the tests carried out in the specific research of a product.
Settings
Settings
Different parameters of Misura® can be customized according to the user needs. It is possible to:
- Create or choose a Misura® database
- Set the language you want to use
- Choose the font and the size of character to use in the program
- Insert the client logo which will be used on every printout heading
- Define the user password for the access to the software.
Measurements of Glass
Transition and Softening Temperature
Measurements of Glass Transition and Softening Temperature
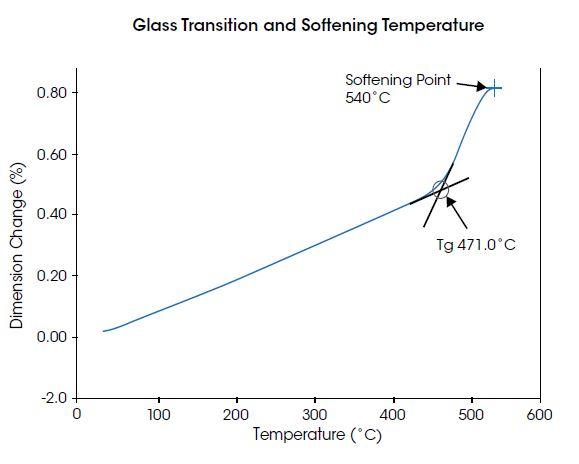
Two important measurements commonly made on a dilatometer are the determinations of the glass transition temperature, Tg, and the softening point. The figure to the top right shows results of thermal expansion for glass material as measured on TA Instruments True Differential™ Dilatometer. It can be seen here that the sample was heated through the Tg, observed at 471°C, to the softening point, observed at a temperature of 540°C.
The instrument control software includes a unique “automatic softening point detection” function to terminate the test. This feature allows these properties to be measured for unknown materials without concern of damage to the instrument that could result if the sample is melted and flows onto components.
Simulating a Fast Firing
Cycle in the Lab with Optical Dilatometry
Simulating a Fast Firing Cycle in the Lab with Optical Dilatometry
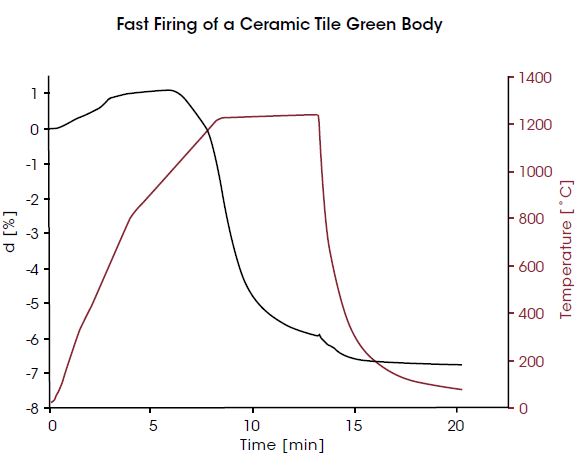
Fast firing of traditional ceramics has quickly become the preferred processing technology because of the reduction in cost and increased productivity it provides. Because fast firing requires all materials within the ceramic body to obtain optimal stabilization within a few minutes, some raw materials used in slower firing process may not be suitable. Therefore, it is important to understand the suitability of all raw materials in the laboratory before scaling a batch up for production. TA Instruments’ optical dilatometer, ODP 868, includes a furnace capable of rapid heating and cooling, allowing the simulation of thermal profiles of fast firing kilns and eliminating the need for expensive and time-consuming pilot-scale tests. An example is shown in the figure at the top right. Here a green body was heated to 800°C in 4 minutes, then to 1220°C in 4.2 minutes, and held isothermally for five minutes to allow the body to fully sinter. Subsequently, the furnace was fast cooled to 680°C in 30 seconds and then to 100°C in 5.3 minutes. It can be seen in the figure that, at the end of the process, the sample was properly sintered and dimensionally stable.
Pyroplasticity Study of Sintered
Bodies with Absolute Fleximeter
Pyroplasticity Study of Sintered Bodies with Absolute Fleximeter
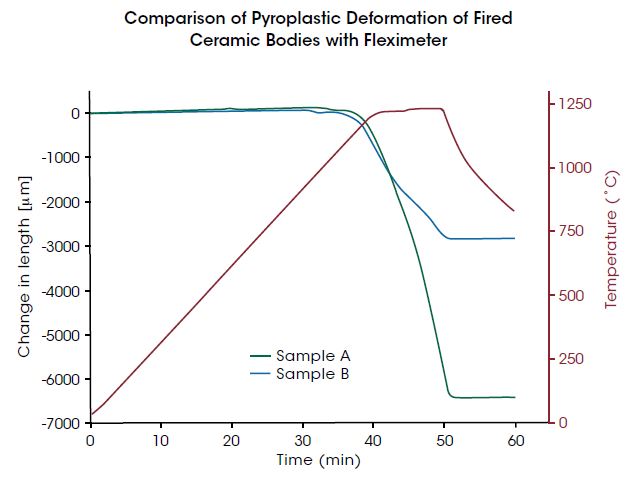
The ceramic tile market is trending towards larger formats and faces the challenge of reducing the tile thickness while maintaining planarity. Flatness defects can be induced during pressing, firing, or cooling. During firing, the amount of deformation is dependent on the viscosity of the glassy phases. The viscosity follows an Arrhenius relationship. However, some materials will exhibit a change in the composition of the glassy phase during the firing process which results in an increase of viscosity as the temperature increases. The figure to the right shows results of two different sintered bodies that were tested using the Absolute Fleximetry mode of the ODP 868. It can be seen here that “Sample A” starts bending, and as the temperature continues to increase, the sample can no longer support its own weight and ultimately flexes over 6 mm (i.e. 7.5%). “Sample B” shows dramatically different flexing behavior. For this sample, the softening vitreous phases dissolve other mineral components present in the body. As a result, the viscosity increases with the temperature, and the body tends to flex less. The latter result will produce a tile in a larger format that is easier to process and with better planarity.
Identification of Characteristic
Shapes and Temperatures with Heating Microscopy
Identification of Characteristic Shapes and Temperatures with
Heating Microscopy
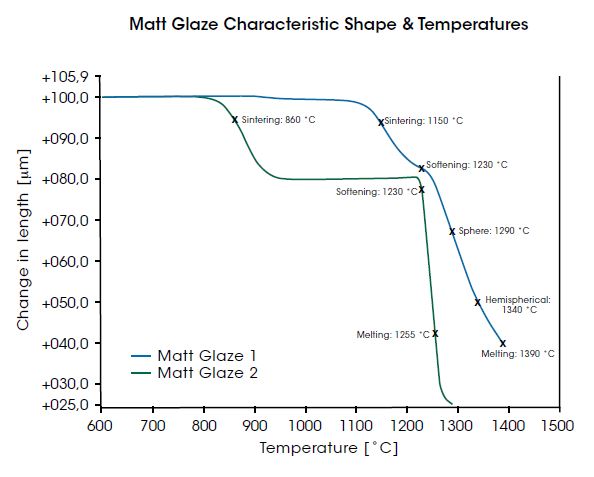
Heating microscopy identifies a material’s characteristic shapes and corresponding temperatures, and is a must-have tool for optimizing manufacturing processes in ceramics, metals and alloys. The top right graph shows a comparison of two matt glazes. For Matt Glaze 1 all the five basic characteristic shapes were identified, and the data reveals the sample has a strong surface tension and a poor compatibility with the substrate of the sample holder. In contrast, Matt Glaze 2 not only melts at lower temperature but has a great degree of compatibility with the substrate. After Matt Glaze 2 melts, it spreads evenly over the surface of the substrates making it an ideal candidate for bodies of the same or similar composition of the substrate. The characteristic temperatures were automatically identified by MorphometriXTM, TA Instruments’ image analysis software engine equipped with pattern-matching models for recognition of transformations in materials in real-time with precision superseding the eye of a human operator.
Characterization of Mold
Powders for Continuous Casting
Characterization of Mold Powders for Continuous Casting
Mold powders are added to the top of molten steel in a continuous casting mold.
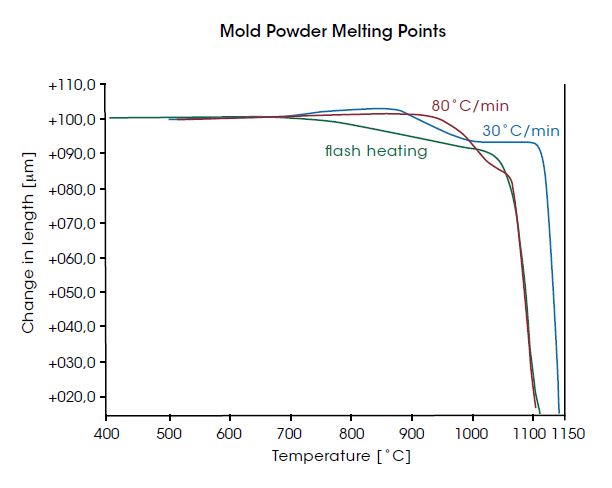
The powder partially melts, forming a liquid layer next to the molten steel protecting it from reoxidation, absorbing the non-metallic inclusions, lubricating the steel shell as it passes through the mold, and controlling the heat transfer from the solidifying steel shell to the mold. If the mold powder does not readily flow, and completely covers the exposed surface of the molten steel, the thermal insulation it is meant to provide is not sufficient leading to unwanted reoxidation and inefficient removal of non-metallic inclusions. Because the melting behavior of mold powders is dependent on heating rate, it is very important to accurately measure this behavior at actual ballistic heating rates of the process to understand performance during the casting process. TA’s Optical Dilatometer Platform, ODP 868, with flash and rapid heating capabilities is the perfect tool to characterize and understand this behavior. Because the approach is optical, there is no complicated sample preparation as would be the case with traditional push-rod instruments. The figure to the right shows melting points for a mold powder determined at 30°C/min, 80°C/min, and under the most rapid flash conditions. It can be seen that the melting point of the powder decreases with increasing heating rate.
Solid Oxide Fuel Cell
Stack Compatibility Study
Solid Oxide Fuel Cell Stack Compatibility Study
Solid Oxide Fuel Cells (SOFC) are devices that convert chemical energy into electrical and thermal energy by combining oxygen and hydrogen. The base of a SOFC cell consists of two porous electrode layers separated by a high-density oxygen-conducting electrolyte layer. The thickness of the entire structure is less than 1 mm. The fabrication process consists of forming the anode and cathode layers, deposition of the electrolyte, and co-sintering of the stack. It is important to understand the behavior of the layers during co-sintering to successfully process SOFCs because a mismatch in shrinkage leads to distortion of the final piece. It is virtually impossible to make these measurements on a traditional pushrod dilatometer because the layers are so thin and not mechanically self-supporting.
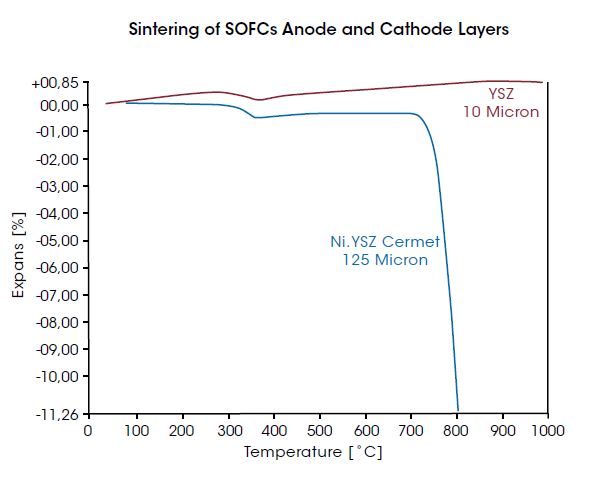
However, such measurements are possible using TA’s unique optical dilatometer and film sample holder. The graph to the right shows a sintering study of two materials proposed for an SOFC consisting of a 125 μm thick Nickel/Yttria-stabilized Zirconia ceramic metal (Ni- YSZ cermet) anode and 10 μm thick YSZ electrolyte performed by TA Instruments’ optical dilatometer with Thin Film Holder. It can be seen in the graph that the results measured by the optical dilatometer show significant mismatch of the shrinkage during sintering, demonstrating the two materials are incompatible for the co-sintering process.
Ash Flow Temperature of Solid Fuels
Ash Flow Temperature of Solid Fuels
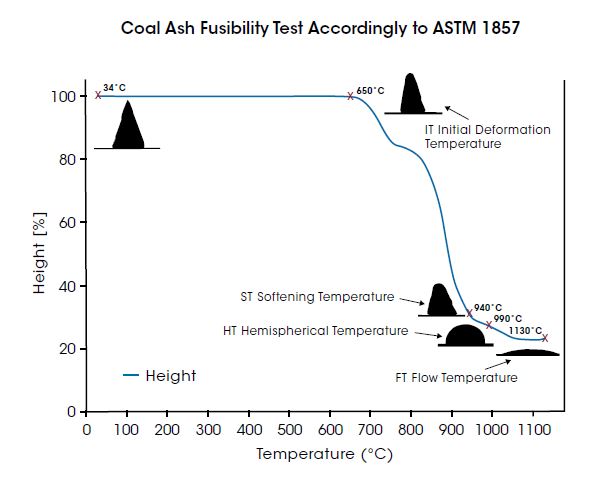
Coal, solid recovered fuel, wood and other biomasses are commonly burned to generate heat. During the combustion process, alkaline metals present in these fuels can generate complex eutectic salts and lower the melting point of the ashes. This causes fouling and slagging problems in heat exchangers and superheater tubes, leading to equipment damage and expensive downtime of the power plant. The ash flow temperature (AFT) of a solid fuel gives an indication to what extent ash agglomeration and ash clinkering is likely to occur during gasification. The results of an AFT analysis consist of four temperatures, namely the initial deformation temperature (IDT), softening temperature (ST), hemispherical temperature (HT) and flow temperature (FT). These temperatures can be measured under either oxidizing or reducing conditions (or both), with the difference between the oxidizing and reducing results often correlating strongly with fluxing agents such as iron. Several standard methods, of which the most common are ASTM 1857, ISO 540 and DIN 51730, define how to prepare and test specimens. All methods require the use of a heating microscope like TA Instruments HM 867. The graph on the right shows a fusibility test performed on a 19 mm tall pyramidal coal sample according to ASTM standard 1857. The temperatures of the characteristic shapes were automatically determined with MorphometriXTM Software.
Optical Contact-less Measurement
Optical Contact-less Measurement
The sample is allowed to freely expand/shrink without any interference due to mechanical contact. This results in a more precise determination of specimen’s behaviour when heated/cooled, as well as of the temperature at which the events are detected. Also, the lack of any load on the sample due to the contact with a measuring system enables to extend the analysis well beyond softening point into the melt, and also analyze soft samples that would otherwise be impossible to test.he HiRes CCD videocamera frames the sample up to 14 times a second, enabling an extremely refined image analysis software to automatically determine the characteristic shapes and temperatures necessary to optimize processing parameters for the production of ceramics as well as the processing of metals or the combustion parameters in power plants.
Morphometrix software
Morphometrix software
The evolution of Misura 3 Image Analysis application, Morphometrics can capture up to 14 frames per second making it possible to automatically determine and visualize, in real-time during the analysis, sample’s characteristic shape’s temperatures. The recognition of shapes can be performed accordingly to a wide range of international standards or also by user-defined parameters and concepts.
All the results, the complete series of original frames and the sample shapes are stored in a database together with analytical parameters in a non-proprietary format file.
Temperature Stabilized Optical Bench
Temperature Stabilized Optical Bench
TTo ensure the ultimate reproducibility and prevent any short-to-mid term drift, regardless of possible temperature fluctuations due to changed environmental conditions, the housing of the optical bench is temperature stabilized by an water cooling.
As a further measure, the support of the optical bench is made of thermally stable materials.
High-performance LED source
High-performance LED source
The LED illumination system operates in the blue range. This significatively improves the resolution as it lowers the limit posed by scattering. As a result it is possible to appreciate smaller changes in shape hence determine with a higher level of accuracy the temperatures of characteristic shapes
Fully Motorized Kiln Operation
Fully Motorized Kiln Operation
For completely automated, error-free operations ODP 868’s furnace rests on a motorized stage ensuring the maximum safety for the user
Flash Mode
Flash Mode
Designed to reproduce the industrial processing conditions, it allows to increase the furnace temperature to a set temperature and then to automatically introduce the specimen in the kiln.
So to heat the sample in a few seconds with heating rates of up to 200°C/sec like in standard manufacturing processes
100 ° C / min Temperature Heating Rates
100 ° C / min Temperature Heating Rates
Up to the temperature range, ODP 868 allows to program heating rates of up to 100°C, enabling users to study the behavior of materials in conditions virtually identical to those used in today’s most demanding manufacturing processes
The New ODP860 Series – Optical Dilatometry Platform
DIL 830 Series High Resolution Horizontal Dilatometers
DIL 820 Series Vertical Dilatometers
- Description
-
The Optical Dilatometry Platform HM 867 is a stand-alone Heating Microscope that is a standard instrument for process optimization in the ceramics industry. A single camera on the optical bench frames the entire sample and records the sequence of the characteristic shape changes and the temperature throughout the experiment. This is ideal for identifying all key material change events including sintering, softening, full sphere, half-sphere, and melting. Dimension changes up to 100% can be measured. With a maximum temperature scanning rate of 80°C/min, it has a built-in purge gas system that enables the user to test specimens in air, oxidative, reductive and protective atmospheres. The heating microscope is available as a standalone instrument, HM 867, or as an option on the Optical Dilatometry Platform, ODP 868.
- Specifications
-
HM 867
Optical measuring system Optical measuring system equipped with a 5 MPix HiRes videocamera Operating modes Heating microscope International Standards ASTM D1857, CEN/TR 15404:2010, BS 1016:Part 15:1960, CEN/TS 15370-1:2006, DIN 51730,DM 05-02-1998, IS 12891:1990, ISO 540:1995, NF M03-048 Sample displacement Bidimensional Sample number From 1 up to 8, depending upon samples sizes Temperature range on specimen RT – 1600 °C Temperature resolution 0,2 °C Heating rate 0,1 – 100 °C/min Resolution 5ppm with ISO standard sample Sample dimensions: ASTM and ISO standards Reference materials Gold wire – Palladium wire Morphometrics Height, Width, Contact angle, Height/Width Ratio, Perimeter, Area, Roundness, Eccentricity, Center of mass
More and freely user-selectable also possibleAtmosphere Air Light source LED - Software
-
Misura® thermal analysis software has been designed and developed by Expert System Solutions for the management of the instruments and data acquired. Misura® represents also the name and trademark of the whole range of our instruments.
The user-friendly features and the ease of usage make Misura® thermal analysis software a perfect tool for laboratory and R&D.
Since our company was originally born as a software house, our qualified staff can offer continuous updates on operative systems and on software features, also according to customer needs.
The customer who uses our equipment can manage the data of each instrument by using the same database and software. This allows a complete characterization of the analysed materials and a comparison between the different measurements acquired through heating microscopes, optical dilatometers, optical fleximeters and DTA.
Furthermore, we offer an after sales service based on the Internet, which is the perfect way to solve the majority of the problems. It is very useful and quick and only an internet connection is required.
Acquisition
Acquisition
It allows to carry out an automatic test on a sample during the firing cycle, which is characterised by the requested temperature gradient. It is also possible to set several parameters for the real time acquisition (according to the kind of materials) of the images and data during the firing cycles.
Furthermore, it can analyse automatically the coefficient of expansion, the glass transition temperature and the dilatometric softening temperature and the sintering process of the materials. During the acquisition it is possible to check the expansion and contraction of the material by a real time graph.
Archive
Archive
It is possible to manage the stored tests, recall them to control, modify and print the data and/ or images of the tests. The user has the complete management of the database for the compression and discharge of the data and/or acquired images to peripheral units. Furthermore, it allows to open directly and automatically the pertinent graph for each analysis.
Graphs
Graphs
The data obtained from the memorized data are immediately available in graphs. All curves can be viewed or printed singularly or overlapped with other curves relevant to other tests and it is possible to view or print different curves of the same test: expansion, its first derivative, the second derivative, coefficient of thermal expansion vs. temperature or time profile. Furthermore, it automatically calculates Alpha (α), cubical Alpha value and Delta (Δ) L/L0, the Glass Transition temperature (Tg) and the Dilatometric Softening temperature (Ts) of the thermal expansion curve acquired.
Parameters
Parameters
This function allows to store the parameters for the analysis of the materials, such as the firing cycle and the acquisition interval of the data and/ or images.
Classes
Classes
This function allows to define a file of classes, whose tests can be put together to better classify them (i.e. frits, glazes, enamels, steel…, etc). Inside the card of each test there is a class field, which can be used to separate, for example, the tests carried out in the specific research of a product.
Settings
Settings
Different parameters of Misura® can be customized according to the user needs. It is possible to:
- Create or choose a Misura® database
- Set the language you want to use
- Choose the font and the size of character to use in the program
- Insert the client logo which will be used on every printout heading
- Define the user password for the access to the software.
- Applications
-
Measurements of Glass
Transition and Softening Temperature
Measurements of Glass Transition and Softening Temperature
Two important measurements commonly made on a dilatometer are the determinations of the glass transition temperature, Tg, and the softening point. The figure to the top right shows results of thermal expansion for glass material as measured on TA Instruments True Differential™ Dilatometer. It can be seen here that the sample was heated through the Tg, observed at 471°C, to the softening point, observed at a temperature of 540°C.
The instrument control software includes a unique “automatic softening point detection” function to terminate the test. This feature allows these properties to be measured for unknown materials without concern of damage to the instrument that could result if the sample is melted and flows onto components.Simulating a Fast Firing
Cycle in the Lab with Optical Dilatometry
Simulating a Fast Firing Cycle in the Lab with Optical Dilatometry
Fast firing of traditional ceramics has quickly become the preferred processing technology because of the reduction in cost and increased productivity it provides. Because fast firing requires all materials within the ceramic body to obtain optimal stabilization within a few minutes, some raw materials used in slower firing process may not be suitable. Therefore, it is important to understand the suitability of all raw materials in the laboratory before scaling a batch up for production. TA Instruments’ optical dilatometer, ODP 868, includes a furnace capable of rapid heating and cooling, allowing the simulation of thermal profiles of fast firing kilns and eliminating the need for expensive and time-consuming pilot-scale tests. An example is shown in the figure at the top right. Here a green body was heated to 800°C in 4 minutes, then to 1220°C in 4.2 minutes, and held isothermally for five minutes to allow the body to fully sinter. Subsequently, the furnace was fast cooled to 680°C in 30 seconds and then to 100°C in 5.3 minutes. It can be seen in the figure that, at the end of the process, the sample was properly sintered and dimensionally stable.
Pyroplasticity Study of Sintered
Bodies with Absolute Fleximeter
Pyroplasticity Study of Sintered Bodies with Absolute Fleximeter
The ceramic tile market is trending towards larger formats and faces the challenge of reducing the tile thickness while maintaining planarity. Flatness defects can be induced during pressing, firing, or cooling. During firing, the amount of deformation is dependent on the viscosity of the glassy phases. The viscosity follows an Arrhenius relationship. However, some materials will exhibit a change in the composition of the glassy phase during the firing process which results in an increase of viscosity as the temperature increases. The figure to the right shows results of two different sintered bodies that were tested using the Absolute Fleximetry mode of the ODP 868. It can be seen here that “Sample A” starts bending, and as the temperature continues to increase, the sample can no longer support its own weight and ultimately flexes over 6 mm (i.e. 7.5%). “Sample B” shows dramatically different flexing behavior. For this sample, the softening vitreous phases dissolve other mineral components present in the body. As a result, the viscosity increases with the temperature, and the body tends to flex less. The latter result will produce a tile in a larger format that is easier to process and with better planarity.
Identification of Characteristic
Shapes and Temperatures with Heating Microscopy
Identification of Characteristic Shapes and Temperatures with
Heating MicroscopyHeating microscopy identifies a material’s characteristic shapes and corresponding temperatures, and is a must-have tool for optimizing manufacturing processes in ceramics, metals and alloys. The top right graph shows a comparison of two matt glazes. For Matt Glaze 1 all the five basic characteristic shapes were identified, and the data reveals the sample has a strong surface tension and a poor compatibility with the substrate of the sample holder. In contrast, Matt Glaze 2 not only melts at lower temperature but has a great degree of compatibility with the substrate. After Matt Glaze 2 melts, it spreads evenly over the surface of the substrates making it an ideal candidate for bodies of the same or similar composition of the substrate. The characteristic temperatures were automatically identified by MorphometriXTM, TA Instruments’ image analysis software engine equipped with pattern-matching models for recognition of transformations in materials in real-time with precision superseding the eye of a human operator.
Characterization of Mold
Powders for Continuous Casting
Characterization of Mold Powders for Continuous Casting
Mold powders are added to the top of molten steel in a continuous casting mold.
The powder partially melts, forming a liquid layer next to the molten steel protecting it from reoxidation, absorbing the non-metallic inclusions, lubricating the steel shell as it passes through the mold, and controlling the heat transfer from the solidifying steel shell to the mold. If the mold powder does not readily flow, and completely covers the exposed surface of the molten steel, the thermal insulation it is meant to provide is not sufficient leading to unwanted reoxidation and inefficient removal of non-metallic inclusions. Because the melting behavior of mold powders is dependent on heating rate, it is very important to accurately measure this behavior at actual ballistic heating rates of the process to understand performance during the casting process. TA’s Optical Dilatometer Platform, ODP 868, with flash and rapid heating capabilities is the perfect tool to characterize and understand this behavior. Because the approach is optical, there is no complicated sample preparation as would be the case with traditional push-rod instruments. The figure to the right shows melting points for a mold powder determined at 30°C/min, 80°C/min, and under the most rapid flash conditions. It can be seen that the melting point of the powder decreases with increasing heating rate.Solid Oxide Fuel Cell
Stack Compatibility Study
Solid Oxide Fuel Cell Stack Compatibility Study
Solid Oxide Fuel Cells (SOFC) are devices that convert chemical energy into electrical and thermal energy by combining oxygen and hydrogen. The base of a SOFC cell consists of two porous electrode layers separated by a high-density oxygen-conducting electrolyte layer. The thickness of the entire structure is less than 1 mm. The fabrication process consists of forming the anode and cathode layers, deposition of the electrolyte, and co-sintering of the stack. It is important to understand the behavior of the layers during co-sintering to successfully process SOFCs because a mismatch in shrinkage leads to distortion of the final piece. It is virtually impossible to make these measurements on a traditional pushrod dilatometer because the layers are so thin and not mechanically self-supporting.
However, such measurements are possible using TA’s unique optical dilatometer and film sample holder. The graph to the right shows a sintering study of two materials proposed for an SOFC consisting of a 125 μm thick Nickel/Yttria-stabilized Zirconia ceramic metal (Ni- YSZ cermet) anode and 10 μm thick YSZ electrolyte performed by TA Instruments’ optical dilatometer with Thin Film Holder. It can be seen in the graph that the results measured by the optical dilatometer show significant mismatch of the shrinkage during sintering, demonstrating the two materials are incompatible for the co-sintering process.
Ash Flow Temperature of Solid Fuels

Ash Flow Temperature of Solid Fuels
Coal, solid recovered fuel, wood and other biomasses are commonly burned to generate heat. During the combustion process, alkaline metals present in these fuels can generate complex eutectic salts and lower the melting point of the ashes. This causes fouling and slagging problems in heat exchangers and superheater tubes, leading to equipment damage and expensive downtime of the power plant. The ash flow temperature (AFT) of a solid fuel gives an indication to what extent ash agglomeration and ash clinkering is likely to occur during gasification. The results of an AFT analysis consist of four temperatures, namely the initial deformation temperature (IDT), softening temperature (ST), hemispherical temperature (HT) and flow temperature (FT). These temperatures can be measured under either oxidizing or reducing conditions (or both), with the difference between the oxidizing and reducing results often correlating strongly with fluxing agents such as iron. Several standard methods, of which the most common are ASTM 1857, ISO 540 and DIN 51730, define how to prepare and test specimens. All methods require the use of a heating microscope like TA Instruments HM 867. The graph on the right shows a fusibility test performed on a 19 mm tall pyramidal coal sample according to ASTM standard 1857. The temperatures of the characteristic shapes were automatically determined with MorphometriXTM Software.
- Technology
-
Optical Contact-less Measurement
Optical Contact-less Measurement
The sample is allowed to freely expand/shrink without any interference due to mechanical contact. This results in a more precise determination of specimen’s behaviour when heated/cooled, as well as of the temperature at which the events are detected. Also, the lack of any load on the sample due to the contact with a measuring system enables to extend the analysis well beyond softening point into the melt, and also analyze soft samples that would otherwise be impossible to test.he HiRes CCD videocamera frames the sample up to 14 times a second, enabling an extremely refined image analysis software to automatically determine the characteristic shapes and temperatures necessary to optimize processing parameters for the production of ceramics as well as the processing of metals or the combustion parameters in power plants.
Morphometrix software
Morphometrix software
The evolution of Misura 3 Image Analysis application, Morphometrics can capture up to 14 frames per second making it possible to automatically determine and visualize, in real-time during the analysis, sample’s characteristic shape’s temperatures. The recognition of shapes can be performed accordingly to a wide range of international standards or also by user-defined parameters and concepts.
All the results, the complete series of original frames and the sample shapes are stored in a database together with analytical parameters in a non-proprietary format file.
Temperature Stabilized Optical Bench
Temperature Stabilized Optical Bench
TTo ensure the ultimate reproducibility and prevent any short-to-mid term drift, regardless of possible temperature fluctuations due to changed environmental conditions, the housing of the optical bench is temperature stabilized by an water cooling.
As a further measure, the support of the optical bench is made of thermally stable materials.
High-performance LED source
High-performance LED source
The LED illumination system operates in the blue range. This significatively improves the resolution as it lowers the limit posed by scattering. As a result it is possible to appreciate smaller changes in shape hence determine with a higher level of accuracy the temperatures of characteristic shapes
Fully Motorized Kiln Operation
Fully Motorized Kiln Operation
For completely automated, error-free operations ODP 868’s furnace rests on a motorized stage ensuring the maximum safety for the user
Flash Mode
Flash Mode
Designed to reproduce the industrial processing conditions, it allows to increase the furnace temperature to a set temperature and then to automatically introduce the specimen in the kiln.
So to heat the sample in a few seconds with heating rates of up to 200°C/sec like in standard manufacturing processes
100 ° C / min Temperature Heating Rates
100 ° C / min Temperature Heating Rates
Up to the temperature range, ODP 868 allows to program heating rates of up to 100°C, enabling users to study the behavior of materials in conditions virtually identical to those used in today’s most demanding manufacturing processes
- Videos
-
The New ODP860 Series – Optical Dilatometry Platform
DIL 830 Series High Resolution Horizontal Dilatometers
DIL 820 Series Vertical Dilatometers


