Process-Relevant Battery Slurry Testing
How to study changes in slurry microstructure during coating and storage
Morgan Ulrich | Hang Lau
December 11, 2024
Electrode slurries are paste-like mixtures made up of active materials, conductive additives, and a binder. The conductive additives must be electrically conducted to the current collector. However, binder is necessary for getting the active materials to stick together and adhere to the current collector.

Battery researchers have used rheology to study their slurries’ structure and stability for process optimization and quality control.1, 2 Rheology measures the relationship between stress and deformation, answering questions such as: What are the optimal mixing and coating conditions? How do you prevent agglomeration for homogenous coatings? Rheology is thus a useful tool for measuring physical networks.
However, rheology alone leaves a crucial gap in slurry development. Battery developers relying solely on rheology or viscosity may know how their slurry flows but have blind spots to the slurry’s conductive additive distribution and resulting conductivity. Problems with the slurry’s conductivity can come up later when testing the overall battery’s electrochemical performance, causing costly setbacks.
Impedance spectroscopy has been adopted to characterize the conductive network within the slurry.3 Impedance measurements can be conducted on mixed slurries to predict electrode performance. But slurries’ microstructure and conductive network change under shear. Therefore, impedance spectroscopy measurements must be performed under process-relevant shear deformations for accurate electrical network assessment.
Rheo-Impedance Spectroscopy Under Process-Relevant Conditions
Rheo-Impedance Spectroscopy offers powerful insights into how slurry impedance changes at different shear rates. The following plots are tests of two slurry samples, one prepared by first mixing carbon black and PVDF in NMP (Sample A), then adding NMC (Sample B).
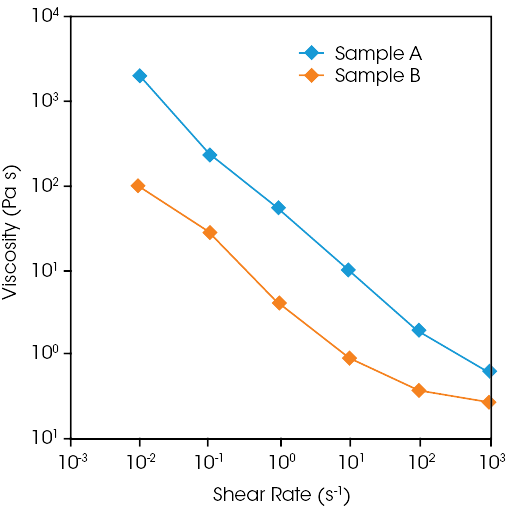
Impedance measurements were made on the material at both steps, over a range of increasing shear rates, shown below:

Sample A’s viscosity is significantly higher, despite its low solids content (8%), compared to Sample B with added NMC (solid content: 72%). NMC particles aid in dispersing carbon black agglomerates into a more uniform network, resulting in a reduced viscosity preferable for coating.

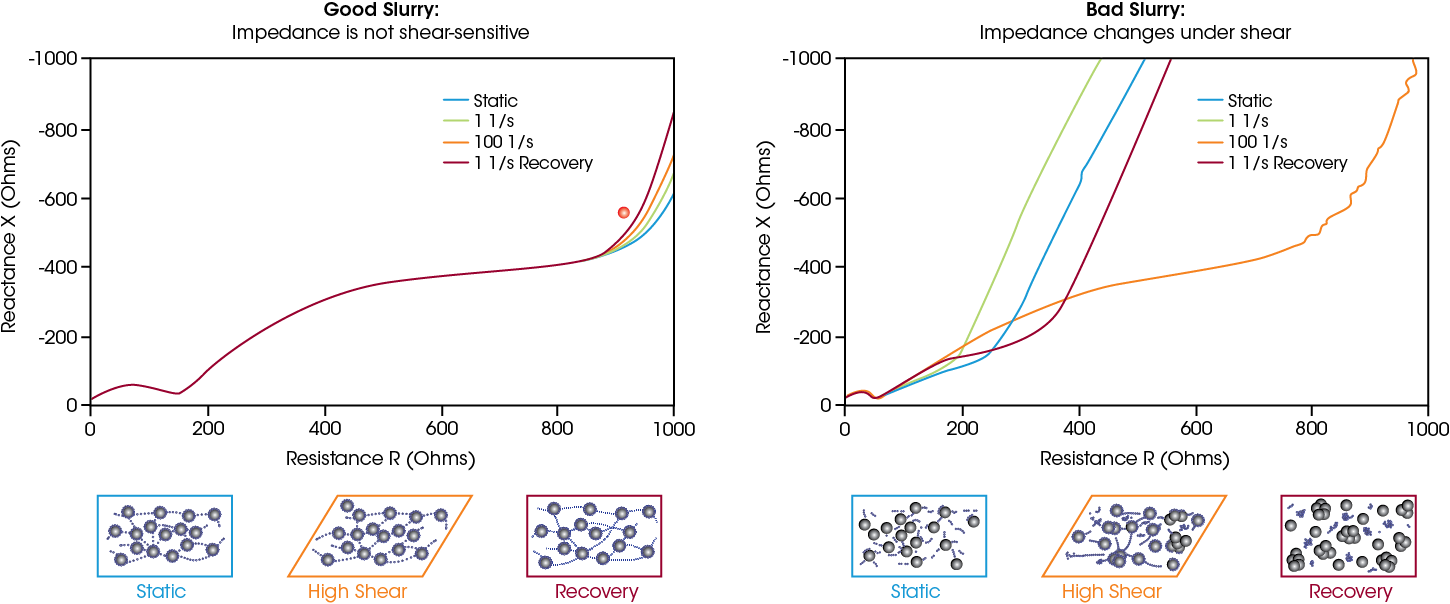
The simultaneous impedance measurements verify that NMC particles create a more uniform network. The Nyquist plot of Sample A shows that its impedance changes significantly under varying shear rates, indicative of a changing network of carbon black agglomerates. In contrast, Sample B shows consistent impedance across all shear rates.
The incorporation of NMC aids in the distribution of carbon black, resulting in a more stable electrically conductive network. This shear-stable microstructure is favorable for production, ensuring the conductive network is maintained in the finished cathode.
Does my slurry recover after coating?
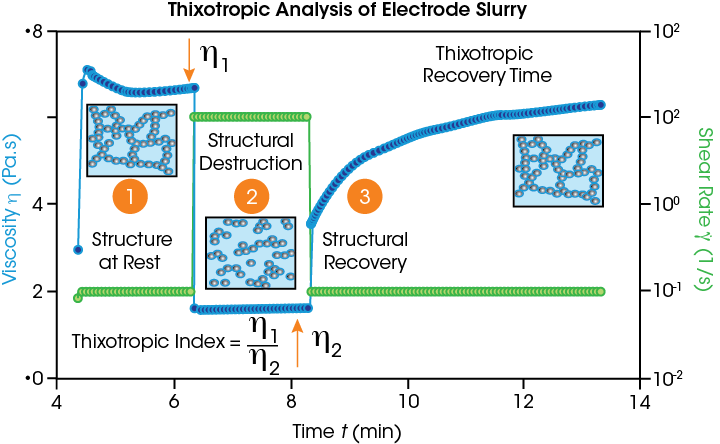
Thixotropy measures shear thinning properties and quantifies structure recovery, making it another useful rheological measurement for battery slurry testing.4 In the following plots, an anode slurry was analyzed using a three-step flow method: low shear, high shear, and low shear again to analyze the percentage of recovery to their initial viscosity. This change in shear rates mimics the slurry coating process.

In the third step, the time it takes for the slurry to recover its initial viscosity is critical to its coating and performance. If the recovery time is too fast, the slurry will leave streak marks or holes in its application. If recovery is too slow, there will be dripping and uneven application. A longer recovery time after shear means a slurry can more easily undergo phase separation, precipitation or settling.
Various slurry ingredients and additives are advertised as enhancing the final slurry’s properties, but which combination actually yields successful slurries? One goal for a successful battery slurry is maintaining its structure and impedance after mixing.
The plots below compare two slurries with different formulations. The good slurry maintains its structure and impedance after mixing, while the bad slurry does not recover its structure. After mixing, the bad slurry has lower resistance overall, indicating that its electrical properties will change when it is coated on an electrode, and it is not well dispersed. Since the difference between these slurries is the additive, this example reveals the importance of testing materials from different suppliers to validate their claims.

Mixing it All Together: Combining Rheology and Impedance Data for Better Slurries
As shown above, rheological and impedance data are both critical for quantitatively comparing slurries and choosing the best formulations. Rheology helps compare slurries’ viscoelasticity, yield stress, thixotropic behavior, and the flow viscosities over a wide range of shear rates. Impedance measurements offer greater insights by directly measuring the conductive network which is critical to electrode performance in the battery cell.
Together, Rheo-Impedance data reveals how slurries’ structure and conductivity changes during mixing and coating. The Discovery Hybrid Rheometer’s Rheo-Impedance Spectroscopy system makes this data more accurate and accessible than ever before, with benefits including:
- Friction-free rheological measurements in the full shear range, essential for low shear region
- Stable impedance measurements without the challenges or limitations of using liquid electrolyte contacts
- Simultaneous impedance and rotational deformation directly measure shear-induced changes in the microstructure
- Measurements of time-dependent recovery after shear
Learn more about Rheo-Impedance Spectroscopy on the DHR. And contact TA Instruments’ battery specialists for expert assistance to enhance your battery slurries.
References
- Cushing, A.; Zheng, T.; Higa, K.; Liu, G. Viscosity Analysis of Battery Electrode Slurry. Polymers 2021, 13, 4033. https://doi.org/10.3390/polym13224033
- TA Instruments. How to Optimize Battery Electrode Slurries with Rheology. https://www.tainstruments.com/how-to-optimize-battery-electrode-slurries-with-rheology/
- TA Instruments. Characterization of LIB Cathode Slurries Using Simultaneous Measurements of Rheology and Impedance Spectroscopy. https://www.tainstruments.com/applications-notes/characterization-of-lib-cathode-slurries-using-simultaneous-measurements-of-rheology-and-impedance-spectroscopy-rh137/
- TA Instruments. Rheological Evaluation of Battery Slurries with Different Graphite Particle Size and Shape. https://www.tainstruments.com/applications-notes/rheological-evaluation-of-battery-slurries-with-different-graphite-particle-size-and-shape/
Other Resources
- Blog – Evaluating Battery Slurries with Simultaneous Rheological and Impedance Measurement
- eBook- Essential Battery Slurry Characterization Techniques
- eBook – Battery Testing Selection Guide
- White Paper – The Power of Powder Rheology for Lithium-Ion Battery Electrode Manufacturing
- Accessory – Rheo-Impedance Spectroscopy
- Contact – Contact TA Instruments Today

