Keywords: Isothermal calorimetry, TAM, heat flow, lithium-ion batteries, electrolyte additives, parasitic heat
MC162
Abstract
Isothermal microcalorimetry is a simple method of determining the effect an electrolyte additive or additive combination has on the parasitic reactions occurring in a lithium-ion battery as a function of state of charge. In this study, a high resolution TAM microcalorimeter equipped with 12 microcalorimeters was used to measure and quantitatively compare the heat flow of lithium-ion batteries that only vary in concentration of electrolyte additive. In this case, with all other sources being identical, the measured difference in heat flow is a direct result of the difference in parasitic heat due to the additive. This is done as a function of state of charge, providing a simple and quick method of determining exactly where and to what extent the electrolyte additive is reducing parasitic reactions. As a demonstrative example, the effect of varying concentrations of vinylene carbonate (VC) on a LiCoO2/graphite cell is examined. It is shown that the presence of VC reduces parasitic reactions above 3.9 V, and continues to reduce these reactions with increasing state of charge. The method and data presented herein have been published (Reference 1) and are reproduced with permission. Copyright 2013, The Electrochemical Society.
Introduction
Lithium-ion batteries are being used in an increasing number of applications that are demanding higher energy densities and longer lifetimes. The use of electrolyte additives is a common method that has shown to extend calendar and cycle life, and reduce parasitic reactions that occur between the electrolyte and electrode materials. However, it is not very well understood how these additives are functioning and exactly where in the charge-discharge cycle they prove advantageous. Therefore, it is of distinct interest to be able to determine the voltage-dependent advantage of a particular additive or additive combination, which can aid in the understanding of how these additives are extending lifetimes of lithium-ion batteries.
Recently the technique of isothermal microcalorimetry has been combined with electrochemical measurements, which has been used to examine the thermal behavior of several lithium-ion chemistries2-9. More recently, Krause et al.10 showed how to use this technique to separate the various contributions to the thermal power and isolate parasitic energy. Here, this technique is used to qualitatively and quantitatively compare the heat flow between cells that only vary in concentration of additive. In this case, with all other sources being identical, the measured difference in heat flow arises from differences in parasitic heat. This is done as a function of state of charge, providing a simple and quick method of determining exactly where and to what extent the additive is reducing parasitic reactions occurring between the electrolyte and electrode materials. As a demonstrative example, the effect of varying concentrations of vinylene carbonate (VC) on a LiCoO2/graphite cell is examined, where VC is a widely used electrolyte additive that has been shown to extend cell lifetimes11.
Experimental
Machine-made 225 mAh LiCoO2 (LCO)/graphite pouch cells (obtained from Pred Materials Co.) were provided dry. The pouches were filled with 0.75 g of electrolyte comprised of 1M LiPF6 in 3:7 ethylene carbonate : ethylmethyl carbonate (Novolyte Technologies, now BASF) with various amounts of VC (Novolyte Technologies, now BASF) additive (0%, 0.5%, 2%, and 4% by weight) and then vacuum sealed. The electrodes were centrifugally wetted using an acceleration of 50 gravities for 20 minutes. The cells were then formed, where they were held at 1.5 V for 24 hours at 40ºC, then charged at 2 mA for 10 hours, then charged at 15 mA to 4.2 V, and then discharged at 15 mA to 3.775 V. The cells were then cut open to release any gas produced and re-sealed. Charging and discharging of cells inside the microcalorimeter was performed using a Maccor series 4000 automated test system (Maccor Inc.).
Isothermal heat flow microcalorimetry measurements were performed using a TAM calorimeter (TA Instruments-Waters LLC), with a measurement uncertainty of < ±1.0 μW and at a temperature of 40.0ºC. The specifics of the instrument calibration and operation, background information, and methods are discussed in detail in Reference 10. The noise level of the instrument is about 10 nW and the baseline drift was less than 500 nW over the time frame of the experiments conducted here.
Results and Discussion
Heat Flow During Cycling
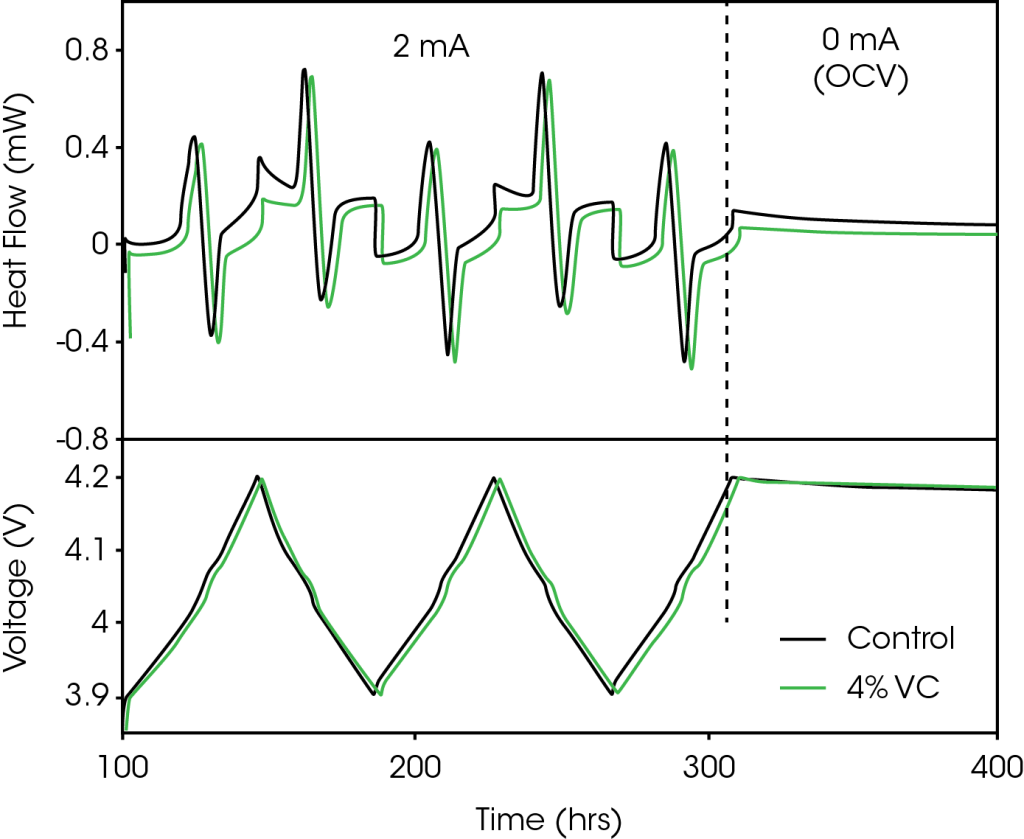
Figure 1 shows a representative segment of the cycling protocol used for cells tested inside the microcalorimeter. Figure 1a shows the measured heat flow and Figure 1b shows the corresponding voltage profile. For simplicity, only the data for the control cell (no VC) and the cell containing 4% VC are shown. The cycling protocol has two distinct segments, as highlighted by a vertical dashed line in Figure 1, which are:
- 2 mA (charge to 4.2 V, discharge to 3.9 V) x2, charge to 4.2 V
- 100 hours at open circuit, starting at 4.2 V
The measured heat flow of the cell during cycling has contributions from three sources: entropy, polarization, and parasitic heat from both the positive and negative electrodes12. The entropy and polarization contributions are current-dependent terms, while the parasitic heat is thought to be independent of current. Both graphite and LCO have large changes in entropy during charge and discharge (staging transitions for graphite13 and order-disorder transitions for LCO14), which are responsible for the majority of the reversible structure in the heat flow profile in Figure 1a. These features have been discussed in further detail in References 7 and 9. Polarization results in a mostly constant exothermic heat flow throughout both charge and discharge. The remainder of the signal is the result of parasitic heat flow.
The machine-made pouch cells used in this experiment are nominally identical as they vary only by the amount of VC added. The variation in capacity between cells was less than 1% in this case. With a small enough current the contributions from entropy and polarization will be identical for all cells, such that the only difference in heat flow will be the result of differences in parasitic heat. Figure 1a shows that the heat flow of the cell containing 4% VC is smaller than that from the control cell. Though not shown in the interest of clarity, all cells containing VC have heat flows below that of the control cell. The difference between the heat flows changes as a function of state of charge, showing the ability of isothermal microcalorimetry to easily determine the voltage-dependence of the parasitic reactions, and where VC or other additives provide their benefit. In this example comparing control to 4% VC, VC noticeably reduced the parasitic heat.
Note that even for such small currents, the heat flow evolved from the pouch cells was 2–3 orders of magnitude greater than the noise level of the TAM microcalorimeter, allowing for extremely precise differentiation between cells.
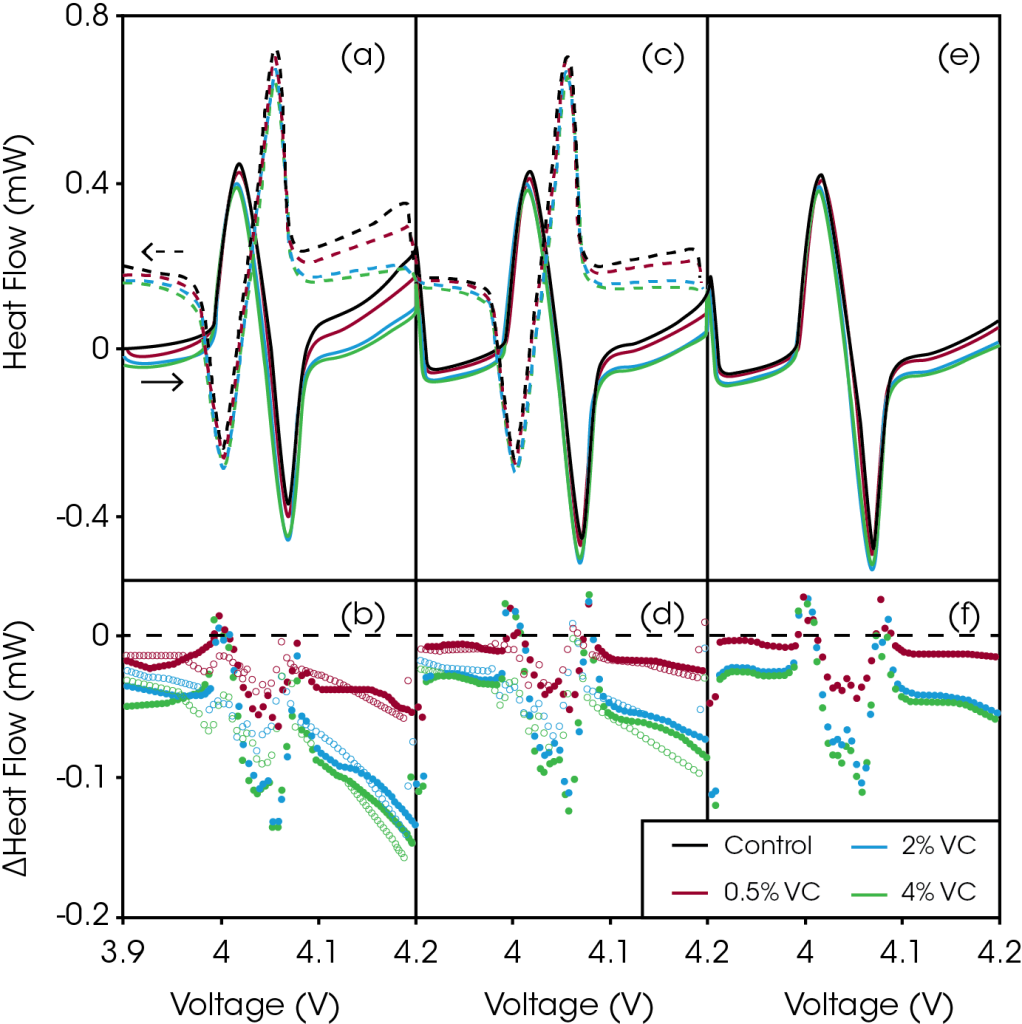
Figure 2 shows the heat flow as a function of voltage during region 1 of the cycling protocol described in Figure 1 (3.9 – 4.2 V at 2 mA). Figure 2a shows the heat flow during the first 2 mA charge and discharge for cells with increasing amounts of VC. With increasing voltage, it is clear that the addition of VC reduced the heat flow, dramatically so at voltages above 4.1 V.
Figure 2b shows the difference obtained by subtracting the heat flow of the control cell (no VC) from the heat flow of the VC-containing cells as a function of voltage. This difference is a good measure of the reduction in parasitic heat due to the additive. Throughout the entire voltage range, the heat flow for VC-containing cells is reduced. However, from approximately 3.98 to 4.1 V, this difference is obscured by slight differences in the curvature of the heat flow profile from passing through the order-disorder transition in LCO. The reduction of heat flow is increasingly pronounced with increased voltage, indicating that VC is reducing parasitic reactions that occur at the positive electrode. Even 0.5% VC produced a significant decrease in heat flow of 54 μW at 4.2 V, while 2% and 4% VC reduced the heat flow by 132 μW and 148 μW at 4.2 V, respectively. The reduction in parasitic heat as a function of additive concentration is non-linear. The differences in heat flow for the cells containing 2% VC and 4% VC are very similar, implying that little benefit is gained by adding more than 2% VC in this cell chemistry.
Figures 2c and 2d show the heat flow as a function of voltage and the corresponding difference plot for the second charge and discharge between 3.9 and 4.2 V. The heat flow for all four cells at all voltages was slightly reduced, and the differences in heat flow were also reduced. Figures 2e and 2f show the same plots for the third and final charge. The heat flow and the differences in heat flow were reduced again. The parasitic reactions decreased with increasing number of cycles, as would be expected. After the third charge, the addition of 0.5%, 2%, and 4% VC reduce the parasitic heat flow at 4.2 V by 15 μW, 54 μW, and 60 μW compared to the control cell, respectively.


Heat Flow at Open Circuit
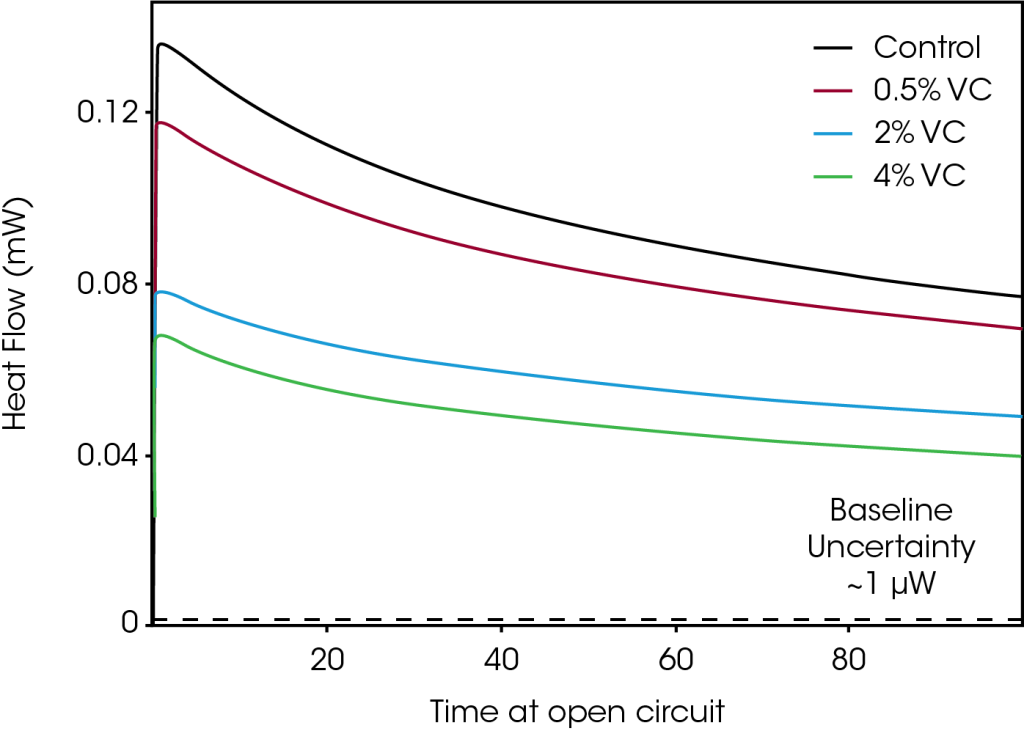
Figure 3 shows the evolution of the heat flow for the same set of cells as they were left at open circuit conditions after being charged to 4.2 V (step 2 in Figure 1). Since no current was applied to the cells, the open circuit heat flow measurements provided a direct measure of the heat flow due to parasitic reactions. A pronounced reduction in parasitic heat was seen with increasing amounts of VC, in qualitative agreement with the results shown in Figure 2. The difference in heat flow between cells decreases with time at open circuit. For example, after 5 hours at open circuit, the difference in heat flow between control and 4% VC is 66 μW, while after 100 hours, that difference decreases to 31 μW. This is consistent with the reduction in parasitic heat with increased cycles (and therefore time) seen in Figure 2.

Conclusions
Isothermal microcalorimetry is a powerful technique able to measure the voltage range over which any additive or additive combination is most effective. This in turn will help efforts to understand electrolyte additives and how to best choose an appropriate additive combination for a particular cell chemistry and operating condition. As a demonstration of the technique, the effect of different concentrations of VC on LCO/graphite full cells was examined. VC dramatically reduced parasitic reactions at high potentials, suggesting that it reduced parasitic reactions that occur at the positive electrode.
References
- L. E. Downie, K. J. Nelson, R. Petibon, V. L. Chevrier, and J. R. Dahn, ECS Electrochem. Lett., 2, A106–A109 (2013).
- W. Lu, I. Belharouak, D. Vissers, and K. Amine, J. Electrochem. Soc., 153, A2147–A2151 (2006).
- W. Lu, I. Belharouak, J. Liu, and K. Amine, J. Power Sources, 174, 673–677 (2007).
- W. Lu, I. Belharouak, J. Liu, and K. Amine, J. Electrochem. Soc., 154, A114–A118 (2007).
- W. Lu, I. Belharouak, S. H. Park, Y. K. Sun, and K. Amine, Electrochimica Acta, 52, 5837–5842 (2007).
- W. Lu and J. Prakash, J. Electrochem. Soc., 150, A262–A266 (2003).
- Y. Kobayashi, H. Miyashiro, K. Kumani, K. Takei, T. Iwahori, and I. Uchida, J. Electrochem. Soc., 149, A978–A982 (2002).
- J.-S. Kim, J. Prakash, and J. R. Selman, Electrochem. Solid-State Lett., 4, A141–A144 (2001).
- Y. Saito, K. Takano, K. Kanari, A. Negishi, K. Nozaki, and K. Kato, J. Power Sources, 97–98, 688–692 (2001).
- L. J. Krause, L. D. Jensen, and J. R. Dahn, J. Electrochem. Soc., 159, A937–A943 (2012).
- J. C. Burns, N. N. Sinha, D. J. Coyle, G. Jain, C. M. VanElzen, W. M. Lamanna, A. Xiao, E. Scott, J. P. Gardner, and J. R. Dahn, J. Electrochem. Soc., 159, A85–A90 (2012).
- J. R. Dahn, W.R. MacKinnon, J.J. Murray, R.R. Haering, R.S. McMillan, and A.H. Rivers-Bowerman, Phys. Rev. B, 32, 3316–3318 (1985).
- J. R. Dahn, Phys. Rev. B, 44, 9170–9177 (1991).
- J. N. Reimers and J. R. Dahn, J. Electrochem. Soc., 139, 2091–2097 (1992).
Acknowledgement
This work was contributed by L.E. Downie and coauthors K.J. Nelson, and J.R. Dahn from the Department of Physics and Atmospheric Science, Dalhousie University, Halifax, N.S., B3H 4R2, Canada as part of the TA Instruments Student Applications Award Program.
The authors acknowledge the support of this work under the auspices of the NSERC/3M Canada Industrial Research Chair in Materials for Advanced Batteries. LED and KJN acknowledge financial support from the NSERC CREATE DREAMS program at Dalhousie University. The authors thank Dr. Jing Li of BASF for providing the electrolyte solvents and salts. Useful discussions with Dr. Larry Krause at 3M are acknowledged.
Click here to download the printable version of this application note.

