Keywords: DSC, MDSC, lithium-ion battery, electrolytes, low temperature
TA468
Abstract
Electrolytes in lithium-ion batteries are required to remain in liquid state for optimal ionic transport and battery performance. Understanding the phase transition of electrolytes is critical for improving low temperature battery performance, especially in colder climates. Differential scanning calorimetry (DSC) provides a simple measurement to evaluate the crystallization and melting of electrolytes. High concentration electrolytes can be supercooled and remain liquid under rapid cooling, resulting in crystallization upon heating. The resulting cold crystallization and melting may overlap at the same temperature range, which a traditional DSC experiment would not be able to fully analyze. Modulated DSC separates the crystallization into a non-reversing heat flow signal and melting into a reversing heat flow signal. This allows a clear and accurate integration of the enthalpy related to crystallization and melting individually, providing further insight in the phase transition mechanism over a temperature range. Two commercially available electrolytes are evaluated in this work to understand transitions at low temperatures which may impact battery performance.
Introduction
Electrolytes in lithium-ion batteries (LIB) enable ions to flow between the cathode and anode to charge and discharge the battery. A key challenge is achieving high energy density while maintaining stability and longevity in a variety of operating conditions. The electrolyte formulation contains a salt, most commonly LiPF6, in an aqueous or organic solution [1]. Ethylene carbonate (EC), ethyl methyl carbonate (EMC), and dimethyl carbonate (DMC) are often used but may be limited at higher voltages due to oxidation. The addition of additives to the formula help enable high voltage while also limit the concentration of EC, which benefits low temperature operation [2] [3].
A common complaint regarding LIB is a decrease in efficiency in cold temperatures. If the electrolyte freezes, ionic transport is reduced, and battery performance is impacted. Analyzing electrolytes to identify phase transitions at low temperatures provides a valuable formulation tool and helps predict battery performance under operating conditions. Differential scanning calorimetry (DSC) provides a simple method to measure heat flow change during the phase transition of a material. TA Instruments Discovery DSC can be used to perform traditional DSC and modulated DSC (MDSC) tests to understand the phase transition of the electrolytes, such as crystallization, melting temperatures, and enthalpies of phase transition.
Traditional DSC measures the heat flow as a function of linearly ramped temperature in a sample; MDSC gives added insight to a traditional DSC test by applying a sinusoidal modulation to an average heating rate [4] [5]. The reversing signal in MDSC is the heat flow response to the heating rate and measures heat capacity (Cp), changes in heat capacity, and crystalline melting. The non-reversing signal measures the heat flow response to absolute temperature and time, capturing kinetic processes such as crystallization, decomposition, evaporation, molecular relaxation, and chemical reactions. The ability to resolve complex transitions into specific components from MDSC measurements improves data interpretation. In this note, a TA Instruments Differential Scanning Calorimeter (DSC) is used to perform both traditional and MDSC measurements of LIB electrolytes to understand phase transition as a function of temperature.
Experimental
Two types of commercial electrolytes were provided by SpectraPower (Livermore, CA) and are referred to as Electrolyte A and Electrolyte B in this study. A TA Instruments DSC with Tzero technology measured the heat flow signal during heating and cooling of electrolyte samples. Samples of approximately 10 mg were prepared inside a glove bag and sealed in a Tzero hermetic pan. Samples were first cooled to -120 °C, then ramped at 10 °C /min from -120 °C to 40 °C to evaluate electrolyte freezing and melting. The onset and peak of the crystallization and melting temperatures were measured, as well as, and enthalpy of the phase transition.
MDSC was performed using the Modulated Heat Only method, shown in Table 1 with a modulation period of 60 s and a heating ramp of 2 °C/min from -120 °C to 40 °C.
Table 1. MDSC Modulated heat only procedure
| Test | Modulated Heat Only |
|---|---|
| Modulation Period | 60 sec |
| Ramp Rate | 2 °C/min |
| Start Temperature | -120 °C |
| Final Temperature | 40 °C |
Results and Discussions
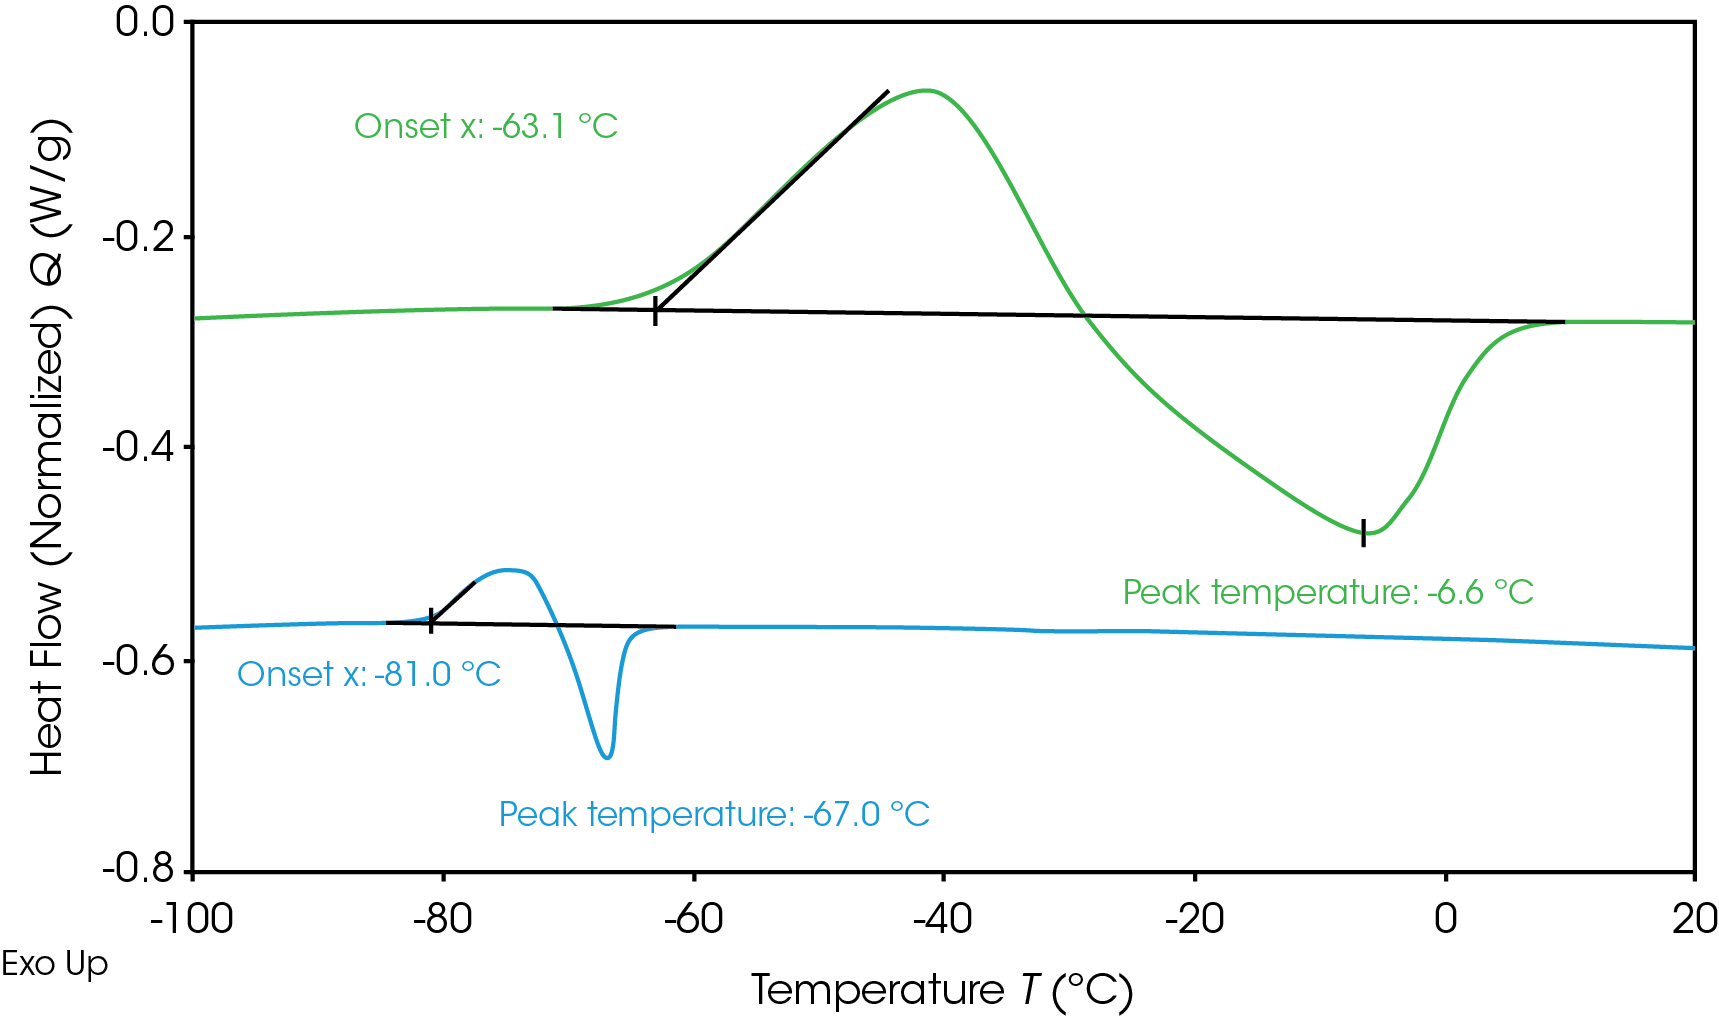
Determining electrolyte phase transitions aids in the prevention of freezing during battery operation in cold temperatures. Electrolyte heat flow during freezing and thawing as measured by DSC is shown in Figure 1. The electrolytes were cooled to -120 °C and then heated up to measure the phase transition. Neither electrolyte showed crystallization during cooling, resulting in supercooled solution; however, both crystallized upon heating (cold crystallization) [6]. Electrolyte A (green) shows crystallization onset at -63.1 °C and melting peak at -6.6 °C. Electrolyte B (blue) shows a lower crystallization onset at -81 °C and melting peak at -67 °C. The lower melting temperature is desirable for operation in colder temperatures as the electrolyte will remain liquid over a wider temperature range. When the electrolyte freezes and crystallizes, the mobility of lithium ions is limited, impacting battery performance. Adjustments can be made to the electrolyte formulation to influence the freezing transition or the thermal management system to prevent the battery from reaching the onset temperature of freezing.

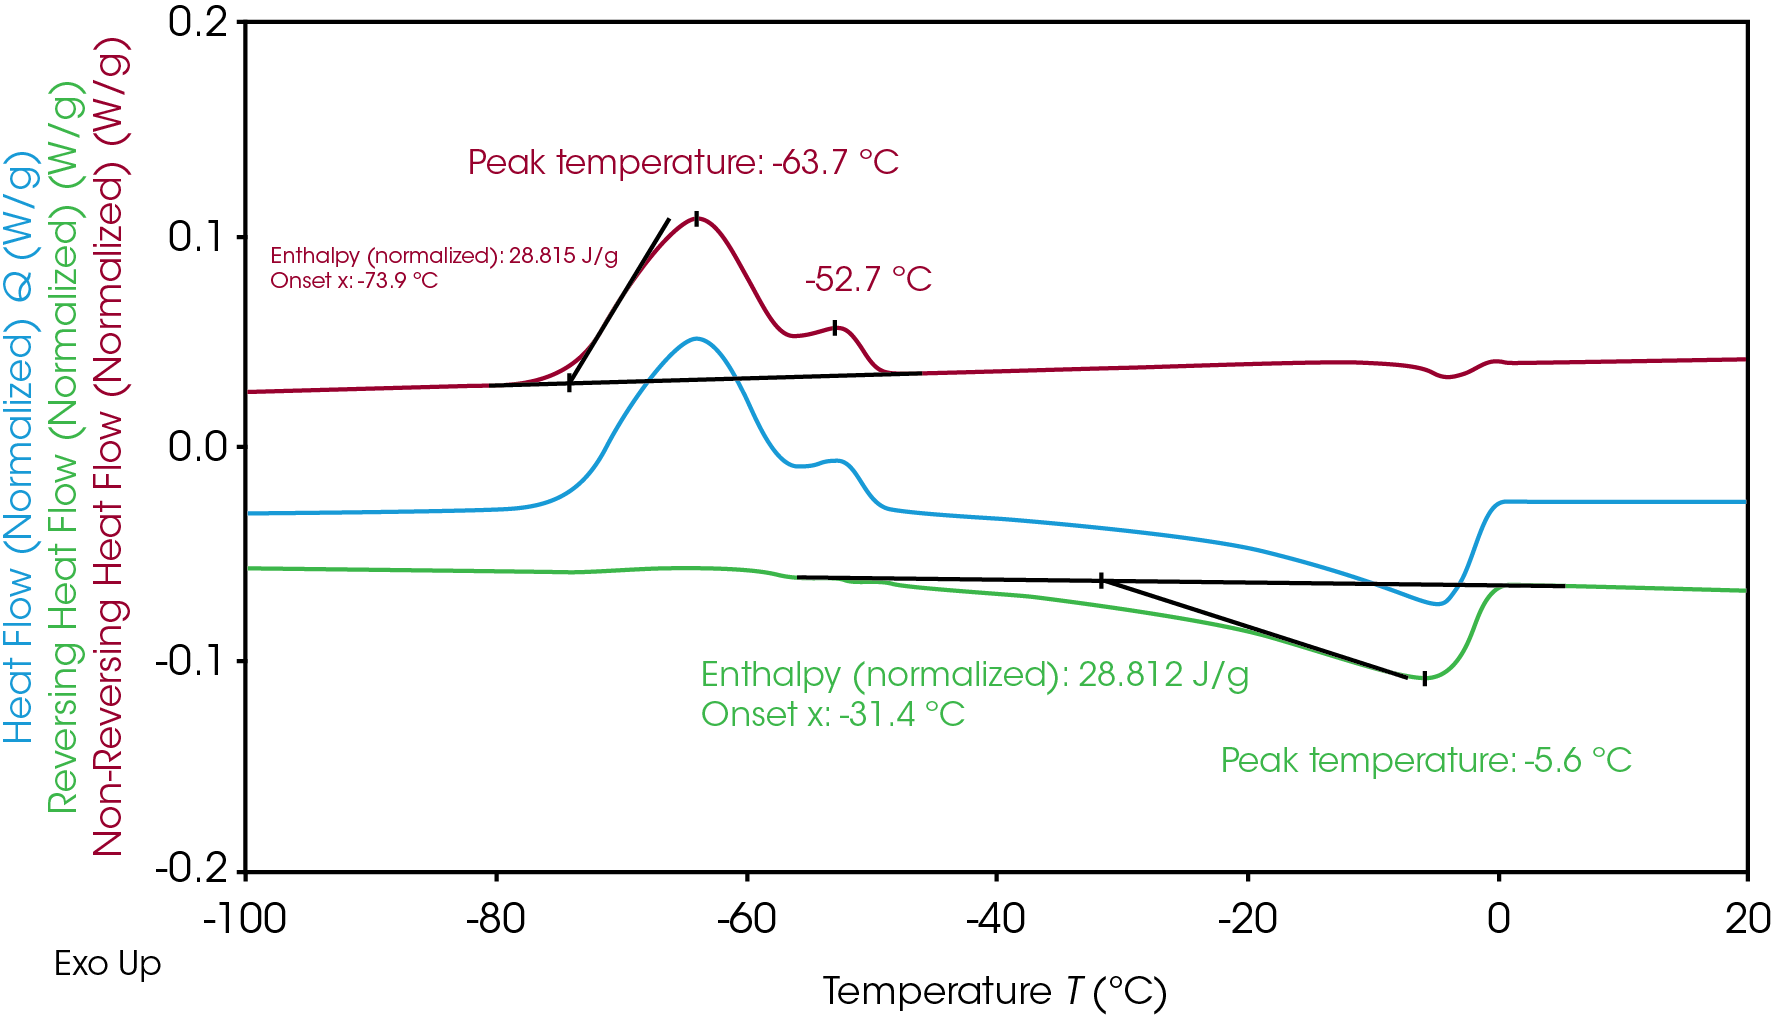
The overlapping transition experienced by Electrolyte A during the freezing and melting can be further understood through MDSC. During heat-only MDSC, the modulated temperature never decreases and the sample is never cooled to prevent induced cooling impact on crystallization [7]. MDSC separated the overlapping crystallization and melting transition (Figure 1) to distinguish crystallization at non-reversing and melting at reversing heat flow signals (Figure 2). The separation allows a clear integration of the enthalpy related to crystallization and melting individually. The resulting crystallization enthalpy of Electrolyte A is 28.8 J/g and the melting enthalpy is 28.8 J/g, which indicates all crystallinity was formed during the cold crystallization at heating. The slow heating rate of 2 °C/min that is used in MDSC compared to traditional DSC at 10 °C/min also improves the resolution and reveals an additional crystallization peak at -63.7 °C and -52.7 °C. Melting occurred immediately after the main crystallization and peak at -5.6 °C.
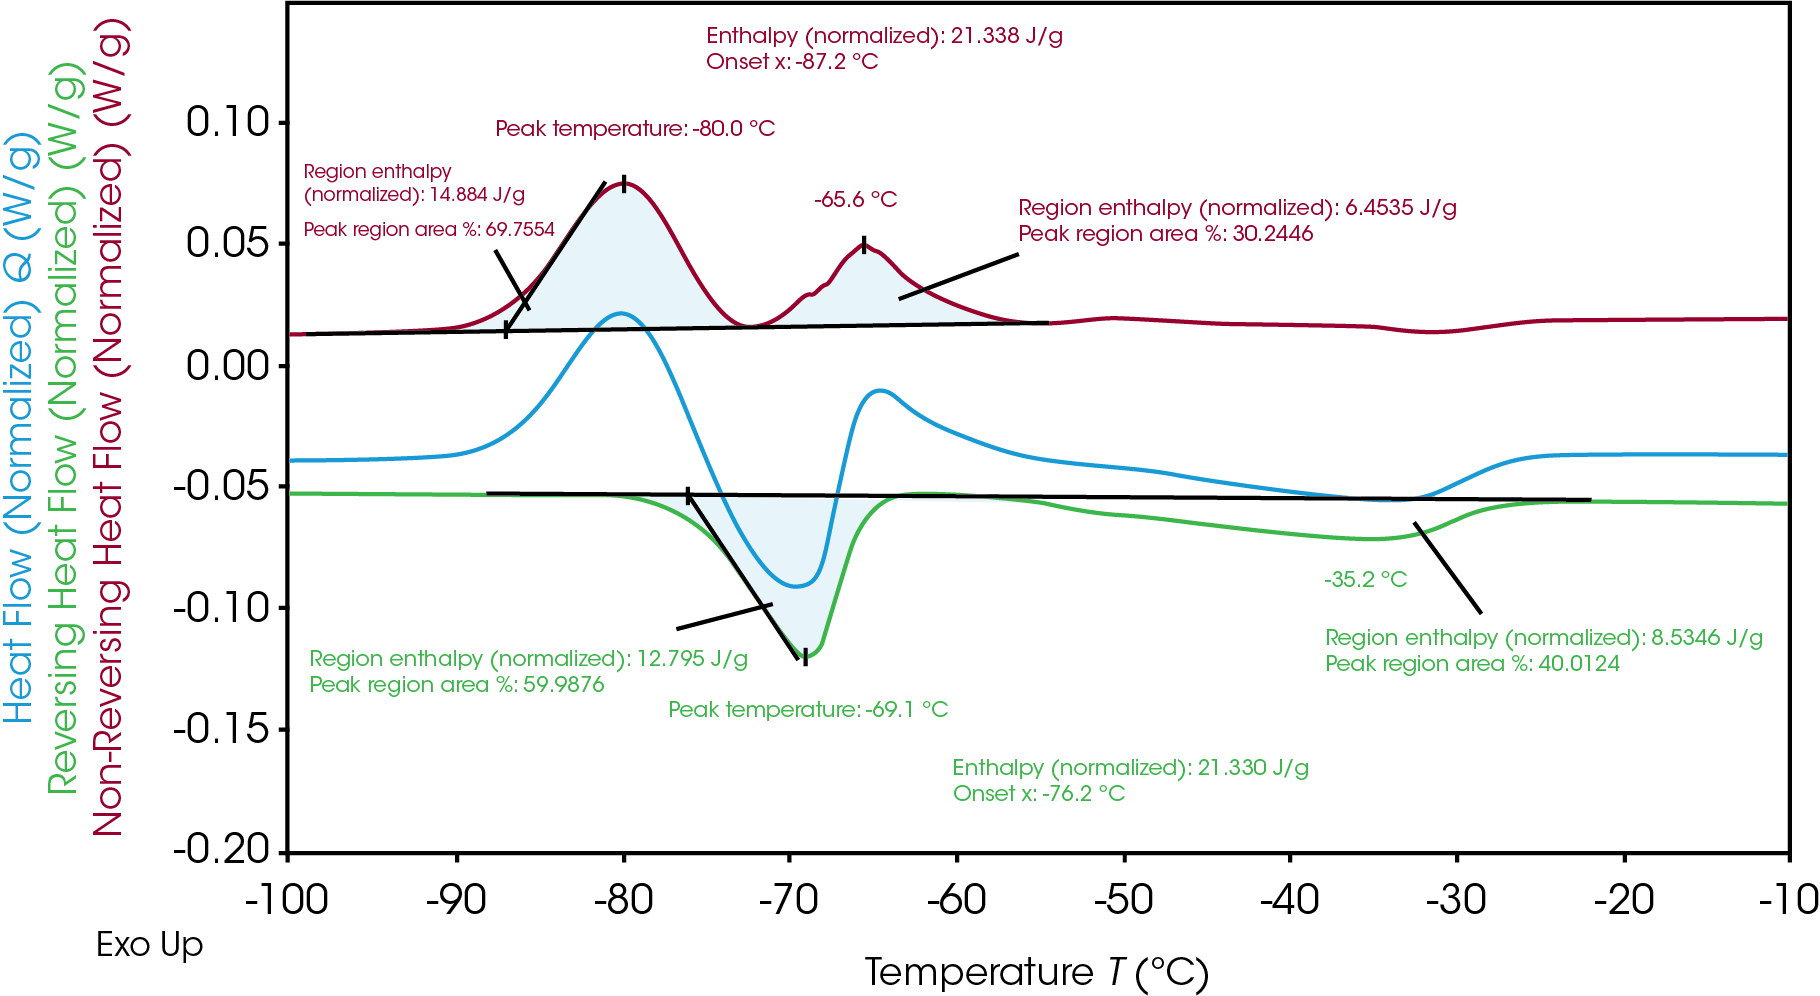
Electrolyte B, shown in Figure 3, has two separate peaks of crystallization and melting. Like Electrolyte A, the similar total crystallization enthalpy (21.3 J/g) and total melting enthalpy (21.3 J/g) of Electrolyte B indicates all crystalline material was formed during the cold crystallization at heating. The total enthalpies can be separated into two for further evaluation of the crystallization and melting mechanism of the Electrolyte B.
TRIOS software can analyze the integration via the “divide peak” feature to show each regional enthalpy and the area percent, revealing how much of the individual enthalpy occurred during each crystallization and melting event. As seen in Table 2, even though the total enthalpy for melting and crystallization are the same, the enthalpy for the 1st crystallization (14.9 J/g) and following melting (12.8 J/g) are not equivalent. The subsequent crystallization (6.5 J/g) occurs and follows a final melting (8.5 J/g). This indicates heterogeneous crystallization and melting of the materials. Across the temperature of the process, there are different phases at a given temperature and this analysis provides insight of the phase transition mechanism.


Table 2. Breakdown of enthalpies of crystallization and melting of Electrolyte B
| Peak Temperature (°C) | Enthalpy (J/g) | Heat Flow signal | |
|---|---|---|---|
| 1st crystallization | -80.0 | 14.9 | Non-reversing |
| 1st melting | -69.1 | 12.8 | Reversing |
| 2nd crystallization | -65.6 | 6.5 | Non-reversing |
| 2nd melting | -35.2 | 8.5 | Reversing |
Conclusions
Understanding phase transitions of electrolytes is critical for performance of lithium-ion batteries in low temperature. Differential scanning calorimetry measures the heat flow of electrolytes and can be used to determine the onset temperatures of freezing and melting temperature. MDSC provides the advantage of separating crystallization and melting transition that sometimes occur at the same temperature range. Through this technique, researchers can investigate new formulations to improve battery performance in low temperatures and manufacturers can employ a DSC for quality control of electrolytes.
References
-
- H. Yang, G. V. Zhuang and P. N. Ross Jr., “Thermal Stability of LiPF6 salt and Li-ion battery electrolytes containing LiPF6,” Journal of Power Sources, vol. 161, pp. 573-579, 2006.
- E. R. Logan, E. M. Tonita, K. L. Gering, L. Ma, M. K. G. Bauer, J. Li, L. Y. Beaulieu and J. R. Dahn, “A Study of the Transport Properties of Ethylene Carbonate-Free Li Electrolytes,” Journal of the Electrochemical Society, vol. 165, no. 3, 2018.
- O. Lavi, S. Luski, N. Shpigel, C. Menachem, Z. Pomerantz, Y. Elias and D. Aurbach, “Electrolyte Solutions for Rechargeable Li-Ion Batteries based on FLuorinated Solvents,” ACS Applied Energy Materials, vol. 3, pp. 7845-7499, 2020.
- L. C. Thomas, “TP006 Modulated DSC® Paper #1: Why Modulated DSC®? ; An Overview and Summary of Advantages and Disadvantages Relative to Traditional DSC,” TA Instruments, New Castle, DE.
- TA Instruments, “TN34 Thermal Applications Note: Modulated DSCTM: A Simple Technique With Significant Benefits,” TA Instruments, New Castle, DE.
- L. A. Robertson, Z. Li, Y. Cao, I. A. Shkrob, M. Tyagi, K. C. Smith, L. Zhang, J. S. Moore and Y. Z, “Observation of Microheterogeneity in Highly Concentrated Nonaqueous Electrolyte Solutions,” Journal of the American Chemical Society, vol. 141, no. 20, pp. 8041-8046, 2019.
- TA Instruments, “TN045: Choosing Conditions in Modulated DSC®,” TA Instruments, New Castle, DE.
Acknowledgement
This note was written by Jennifer Vail, PhD and Hang Lau, PhD. at TA Instruments.
Click here to download the printable version of this application note.

