Keywords: rheology, thermal analysis, DSC, recycled polymer, PET, melt processing, viscosity, viscoelasticity, crystallinity, thermal stability
RH122
Abstract
Polyethylene terephthalate (PET) is one of the most commonly used plastics in our daily life. It is completely recyclable and is the most recycled plastic in the U.S and worldwide. However, recycled PET from different sources may have large variabilities, such as reduced molecular weight, broader molecular weight distribution, different crystallinity and with different impurity contents, which can affect their processing and application. This application note describes the importance of using thermal and rheological techniques to help fingerprinting the molecular architecture of the PET feedstocks. The melt stability of the feedstock is determined through monitoring the viscosity change at the processing temperature. Also, the feedstock processing conditions can be optimized by measuring the crystal melting and viscosity change as a function of temperature.
Introduction
Each year, large amounts of plastic waste release into the environment have causing widespread pollution from landfills to ocean water and negatively affecting marine wildlife. Today, consumers have realized this concern and manufacturers are working to make plastic products more sustainable. The push for sustainable polymers is supporting by governments and companies around the world who are setting targets on using recycled content in plastic products. Numerous recycling technologies such as mechanical recycling and chemical recycling have been developed to address plastic waste [1-4]. Among them, mechanical recycling is one of the most common methods employed to recycle some of widely used plastics such as polyolefins, PET, and polystyrene (PS). This process typically includes collecting, sorting, washing, regrinding, and extruding to make new products. However, compared to virgin resins, the post-consumer recycled (PCR) feedstocks are more complex with significant variability from different sources, which create big challenges to the processing engineers.
Among all of the common plastic wastes, PET is the most recyclable polymer. More than 1.5 billion pounds of used PET bottles and containers are recovered in the United States each year for recycling. Recycled PET (rPET) has been used for numerous applications such as carry bags, roofing materials, and sandwich honeycomb panels for automotive and aerospace insulation use. One of the biggest challenges in rPET application is feedstock variability and contamination. PET collected from different sources may have differing molecular weight (MW), molecular weight distribution (MWD), and impurity contents. These can cause batch-to-batch variation in their crystallinity, crystal melting, and resin melt viscosity. Differential Scanning Calorimetry (DSC) can provide sensitive measurements on PET’s crystallinity and crystal melts, while a rotational rheometer can help fingerprint the molecular architecture of the rPET feedstocks. Through melt viscosity measurement as a function of time and temperature, the rheological analysis can also help determine the thermal stability of the feedstock at their processing temperature and optimize the processing conditions. In this application note, the DSC and rheology characterization techniques are utilized to guide the melt extrusion of rPET feedstocks from different sources.
Experimental Setup
Four batches of recycled PET samples labeled as rPET -1, -2, -3 and -4 are kindly provided by EconCore N.V in Belgium. These samples are collected from difference sources and are reported to have big differences in their intrinsic viscosity. EconCore uses these rPET feedstocks in manufacturing of sandwich honeycomb panels for insulation applications. The commonly used processing (i.e. extrusion) temperature is reported to be at 280 °C.
A TA Instruments ARES-G2 rheometer with forced convection oven (FCO) and 25 mm parallel plate geometry was used for the rheological analysis. To identify the linear viscoelastic region of the molten polymer, a dynamic amplitude sweep test was performed at 280 °C with a frequency of 10 rad/s. The dynamic frequency sweep measurements were conducted at a frequency range from 1-600 rad/s using a 5% strain, which is within the linear region of the sample. The time sweep test was setup at 280 °C at a constant frequency of 10 rad/s and strain at 5%. Finally, the dynamic temperature ramp test was programmed from 265 °C to 280 °C with a heating rate of 2 °C/min. The DSC temperature scans were performed using TA Instruments Discovery DSC 2500. A 10 °C/min heating rate was used to heat the sample from 10 °C to 300 °C. More detailed DSC analysis results are reported in reference [5].
Results and Discussions
Determine Linear Viscoelastic Region
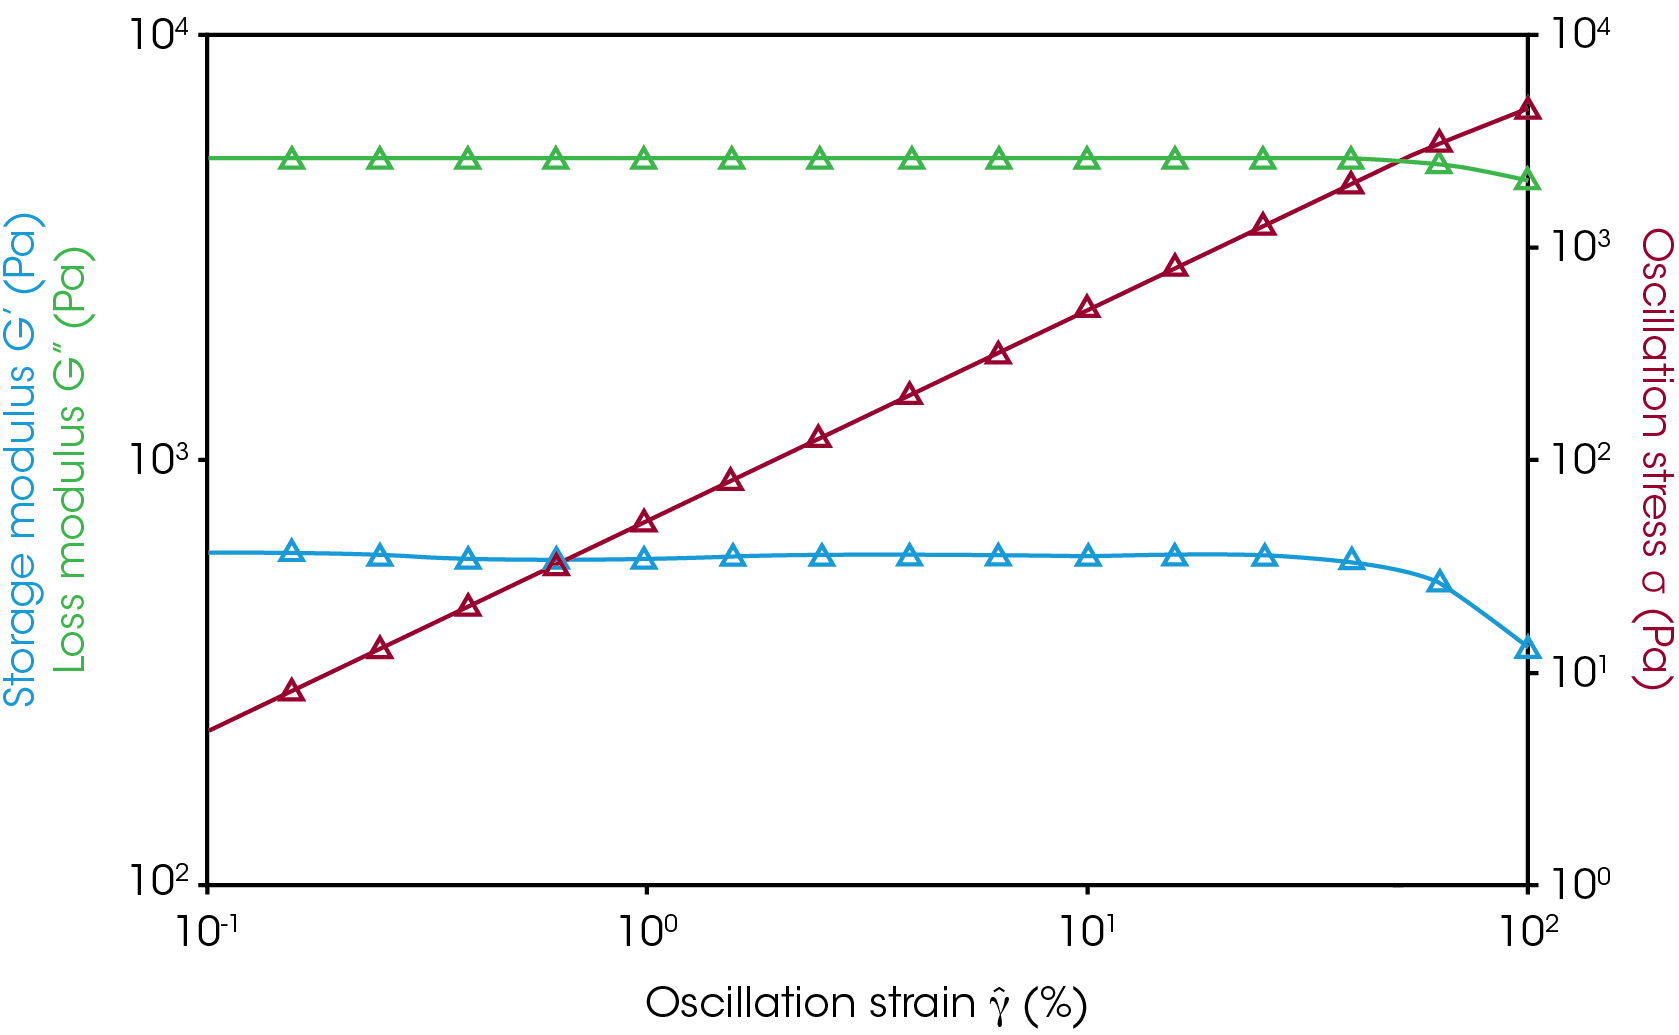
Figure 1 shows an example amplitude sweep testing result of rPET-2 at 280 °C. This amplitude sweep test is used to determine the linear viscoelastic region of the polymer sample at its processing temperature. Within the linear viscoelastic region, the sample’s oscillation stress and strain follow a linear relationship, where the measured moduli (G’ and G”) are independent of the testing stress and strain. Based on this test result, an oscillation strain of 5% is selected to use for the rest of the dynamic measurements including frequency sweeps, time sweeps and temperature ramps.
Fingerprint the Molecular Architecture
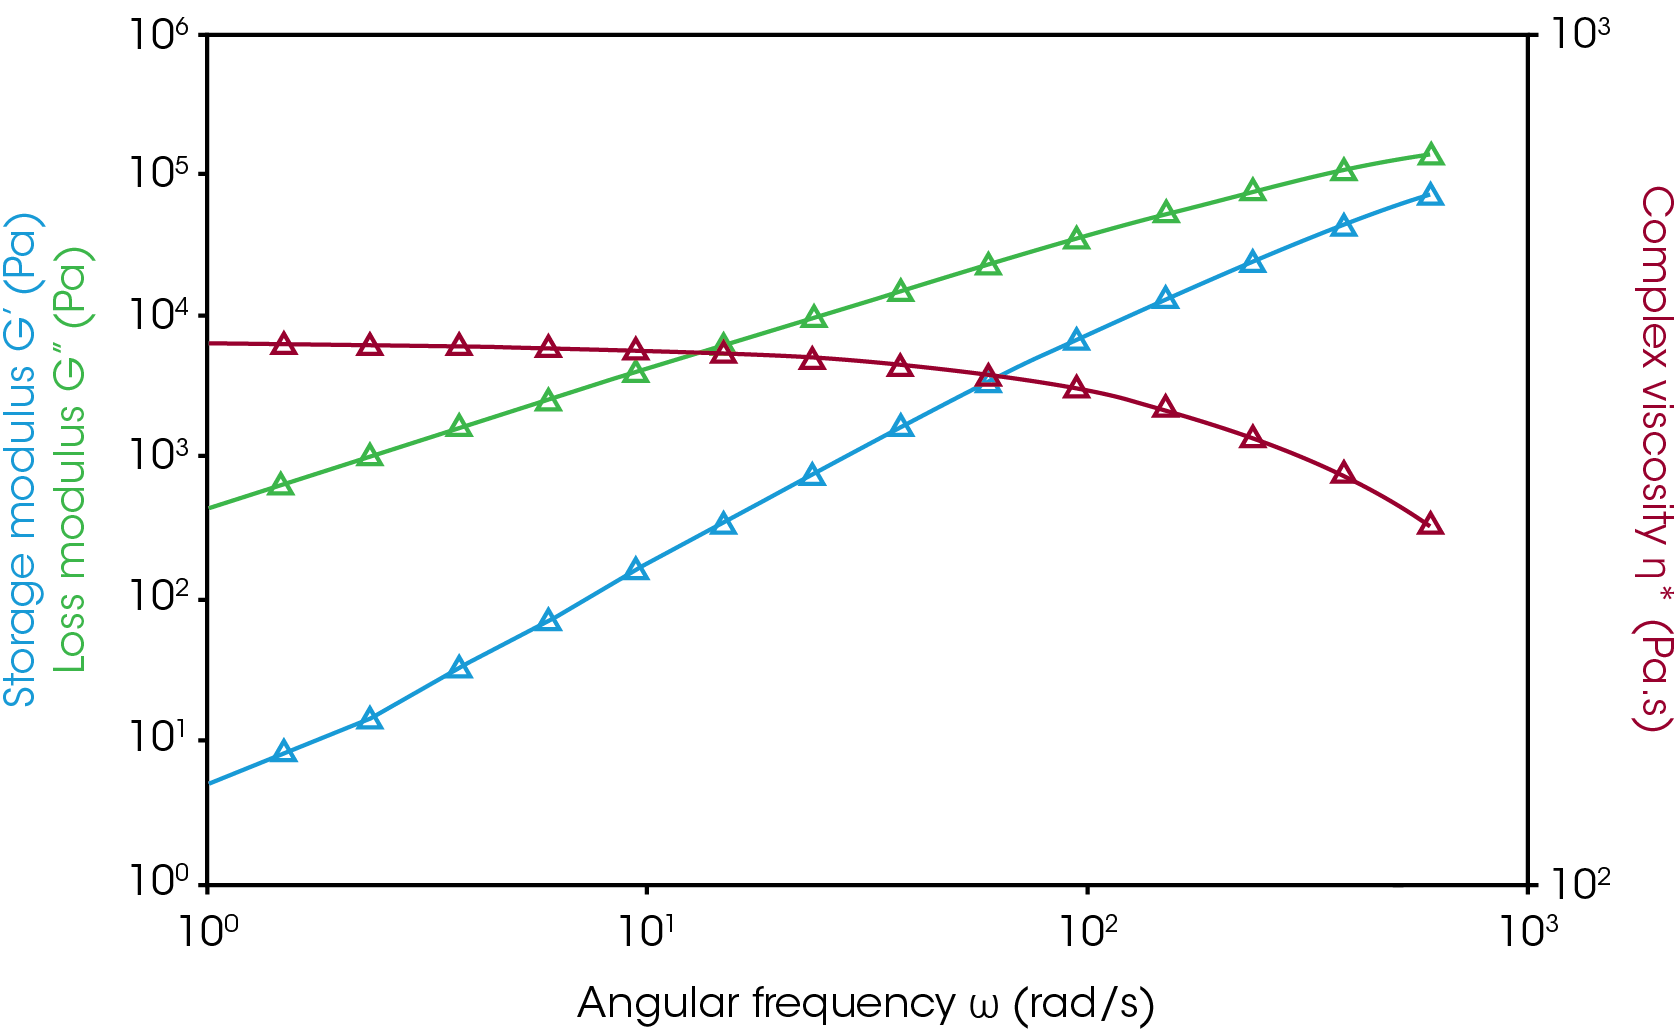
Figure 2 shows the dynamic frequency sweep test result of rPET-2 at 280 °C. Dynamic frequency sweep test is commonly used in polymer melt analysis as a nondestructive alternative to flow viscosity testing. The measurement results correlate to the polymer molecular architecture, such as molecular weight (MW) and molecular weight distribution (MWD). At 280 °C, rPET-2 is fully molten. Within the measurement frequency range, loss modulus (G”) is greater than storage modulus (G’). No G’/G” crossover is observed. In the terminal low frequency regime, the slope of G” curve is at -1, and the slope of G’ curve is approaching to -2 as expected. The complex viscosity curve reaches to the plateau regime, and the zero-shear viscosity, which is the plateau viscosity extrapolate down to shear rate (frequency) of zero, is observed at 430Pa.s.
The zero-shear viscosity measured in frequency sweep experiment directly correlates with the molecular weight of the polymer. As shown in Equations 1 below, the factor K depends on the polymer molecular structure, and alpha equals to 3.4 to 3.6 when the molecular weight of the polymer is greater than the critical entanglement molecular weight.
η0 = k · Mwα (1)
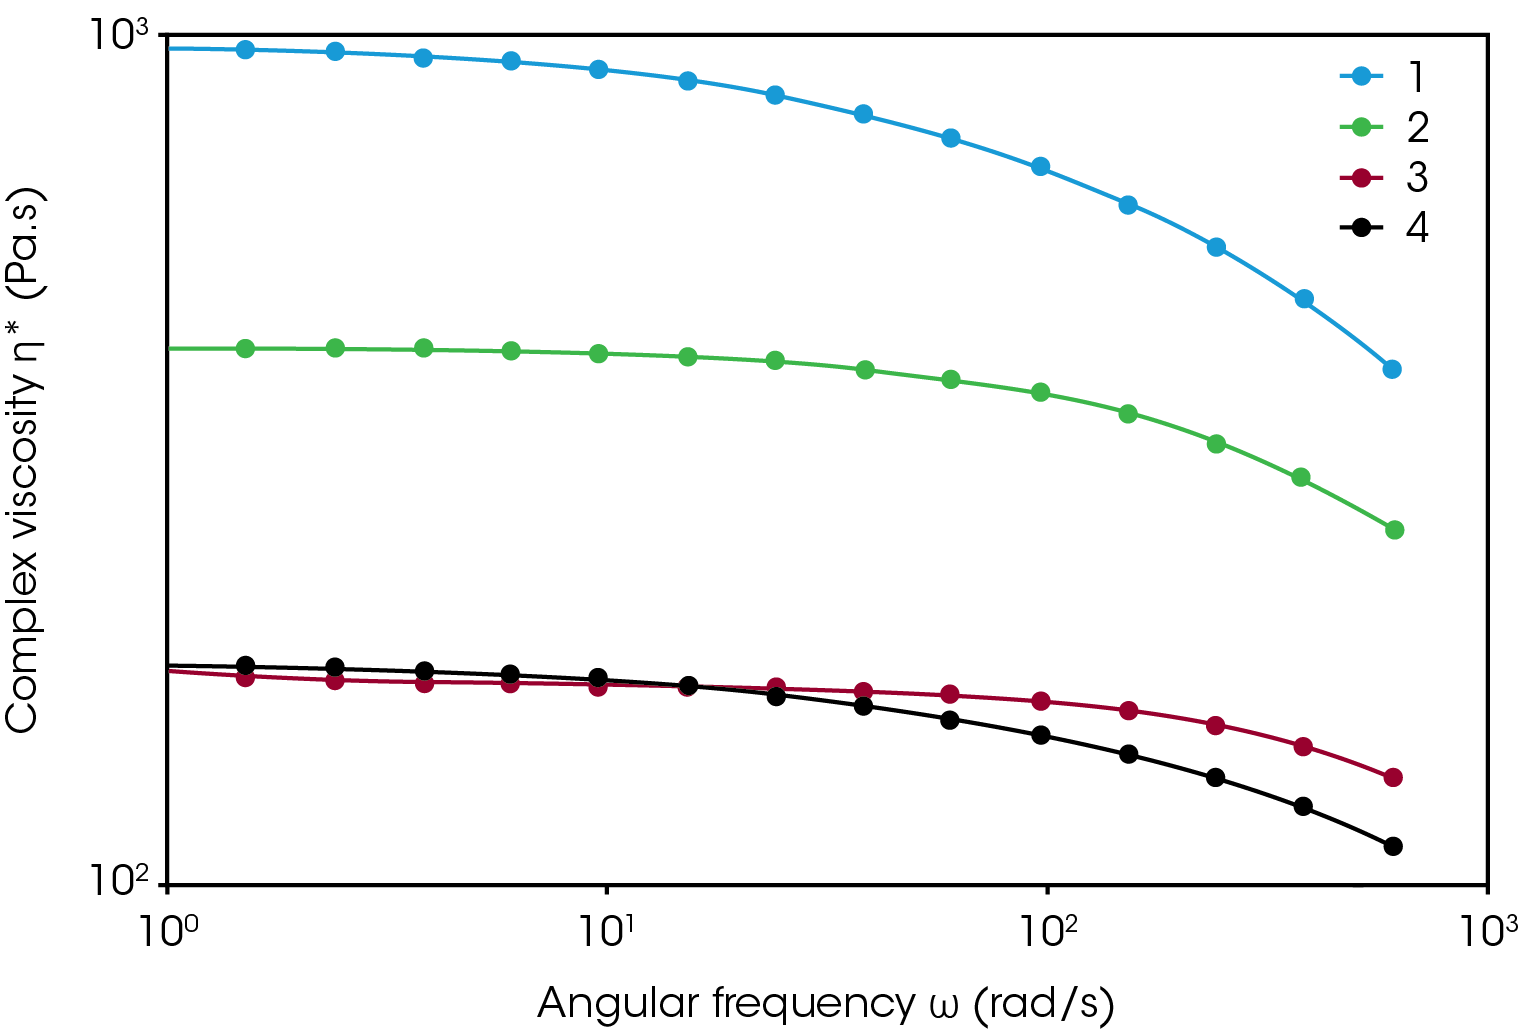
The frequency sweep test results on the four different batches of rPET samples are plotted in Figure 3. The measurement results clearly show that the zero-shear viscosities of these four batches of rPET are significantly different, which means they have different molecular weight.
The zero-shear viscosity of rPET-1 is high and close to the viscosity of virgin PET. But rPET-2, -3 and -4 have much lower viscosity, indicating a significant reduction in MW due to feedstock processing such as grinding. While rPET-3 and rPET-4 have similar zero shear viscosity, but rPET-4 seems to be more shear thinning. This indicates that the batch feedstock for rPET-4 may have a broader MWD. Polymers with wider MWD always show an earlier shear thinning compared to narrow MWD. This is due to the increased molecular mobility caused by low MW fractions in polymer, which leads to the polymer to shear thin earlier at lower rates.
Process Optimization
The most commonly used extrusion temperature for processing virgin PET is at 280 °C. However, because the recycled PET has reduced molecular weight, and also have differences in their crystallinity [5], they may have different thermal stability and lower melting temperature. Among the industry, it is well known that PET polymer undergoes a slow crosslinking reaction under its molten state. The higher the processing temperature, the more crosslinking is observed. If the resin is not properly dried before processing, the residual moisture could also accelerate this crosslinking reaction.
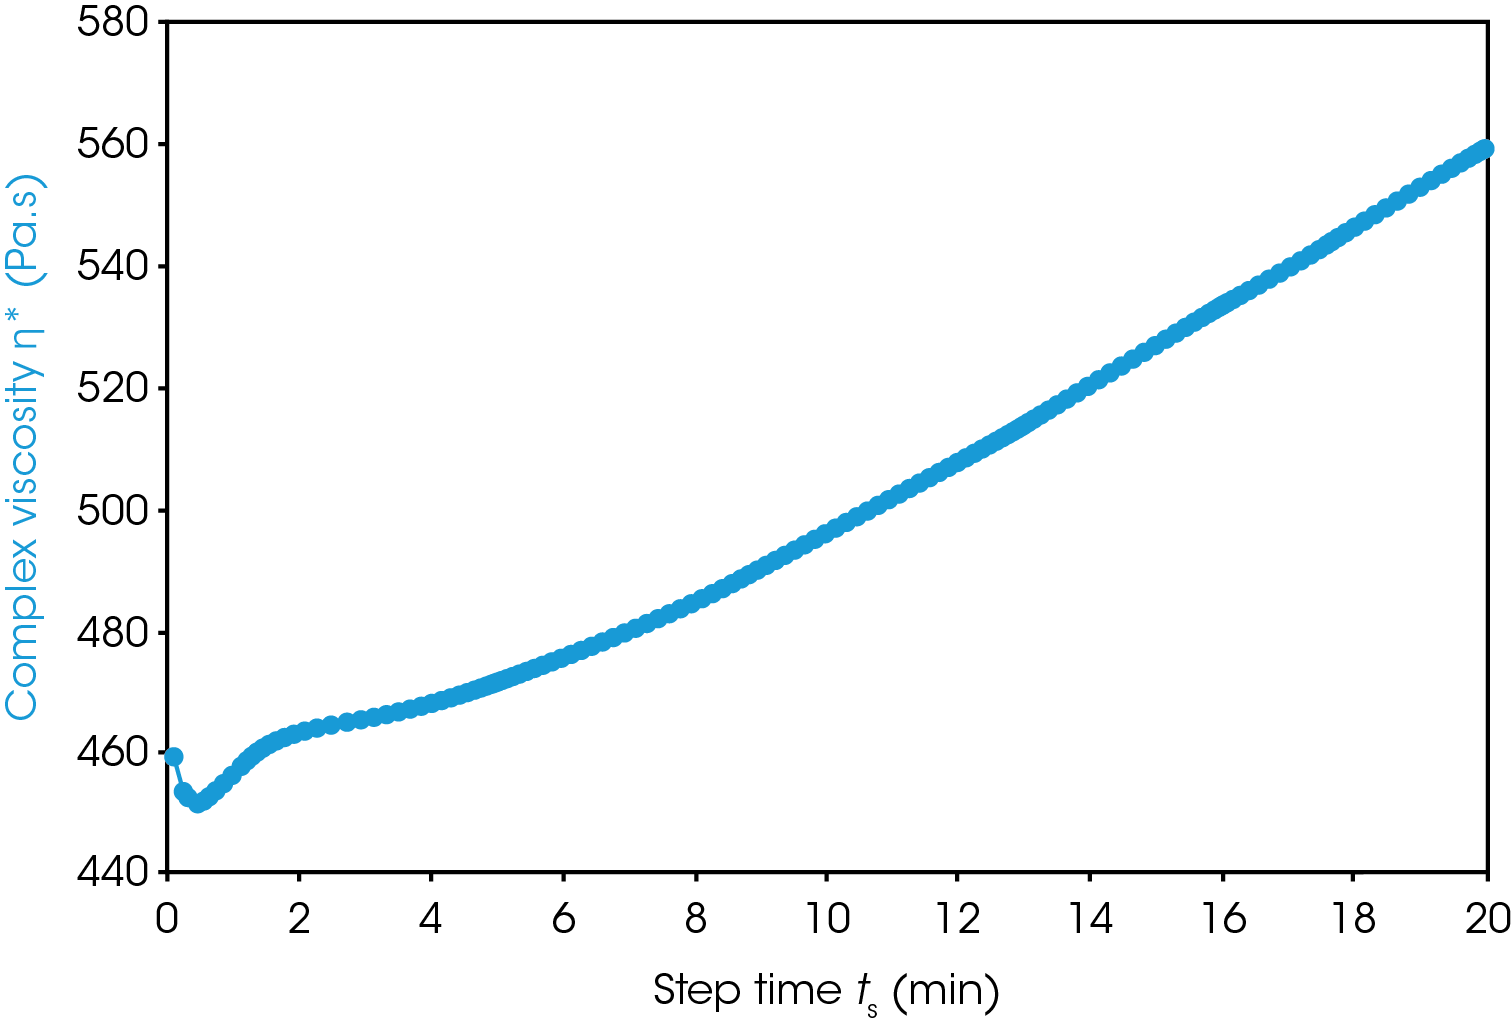
A dynamic time sweep experiment can be used to evaluate the thermal stability of polymers at a given processing temperature. Figure 4 shows the time sweep test result of rPET-2 at 280 °C. The measurement result shows that the melt viscosity of rPET-2 increased about 10% within the first 10 minutes of equilibration, and 24% within 20 minutes equilibration at 280 °C. These results suggesting that properly reducing the processing temperature could be beneficial for improving the thermal stability.
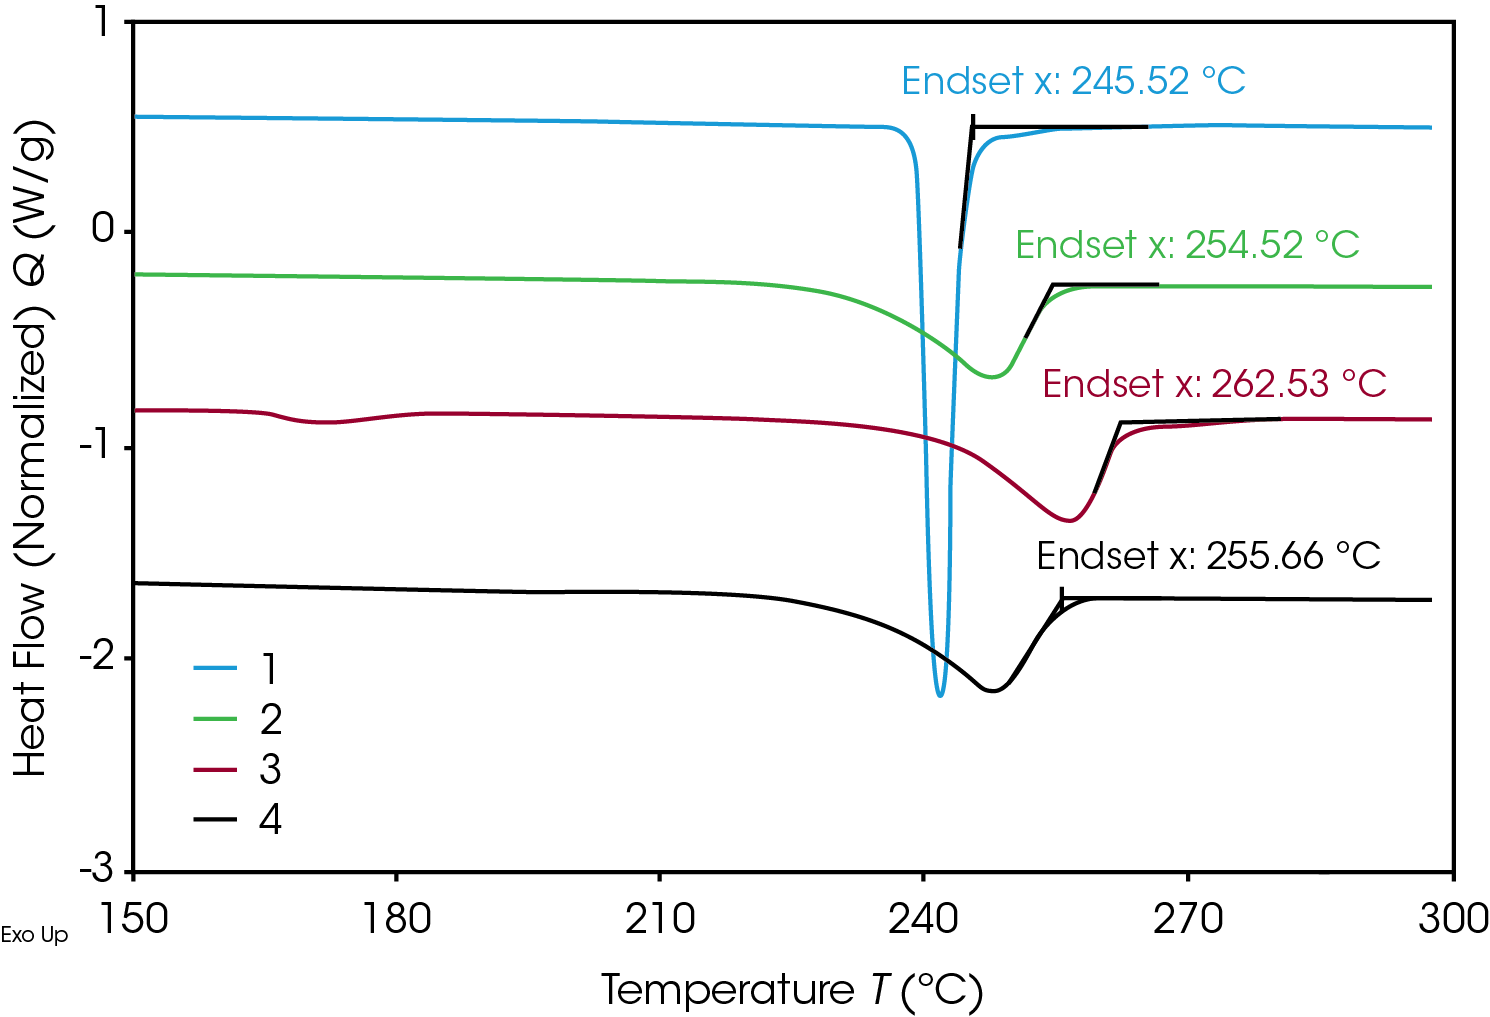
Using thermal and rheological characterization techniques can help optimize the polymer processing temperature. First of all, a quick DSC scan on the feedstock helps to determine at what temperature the polymer crystals can fully melt. Figure 5 shows the overlay results of the DSC first heat scans on these four rPET resins. These results indicate that all 4 batches of rPET resins can get fully molten at temperature above 265 °C. The endset of melting peaks are observed at 246 °C-263 °C. During melt extrusion processing, the high shear rates experienced by the polymer can cause the PET crystals to break down and melt at temperatures even below the end of melting point, which is observed in the DSC testing. Therefore, a temperature of 265 °C can be selected as a reasonable starting temperature for further rheological investigation.
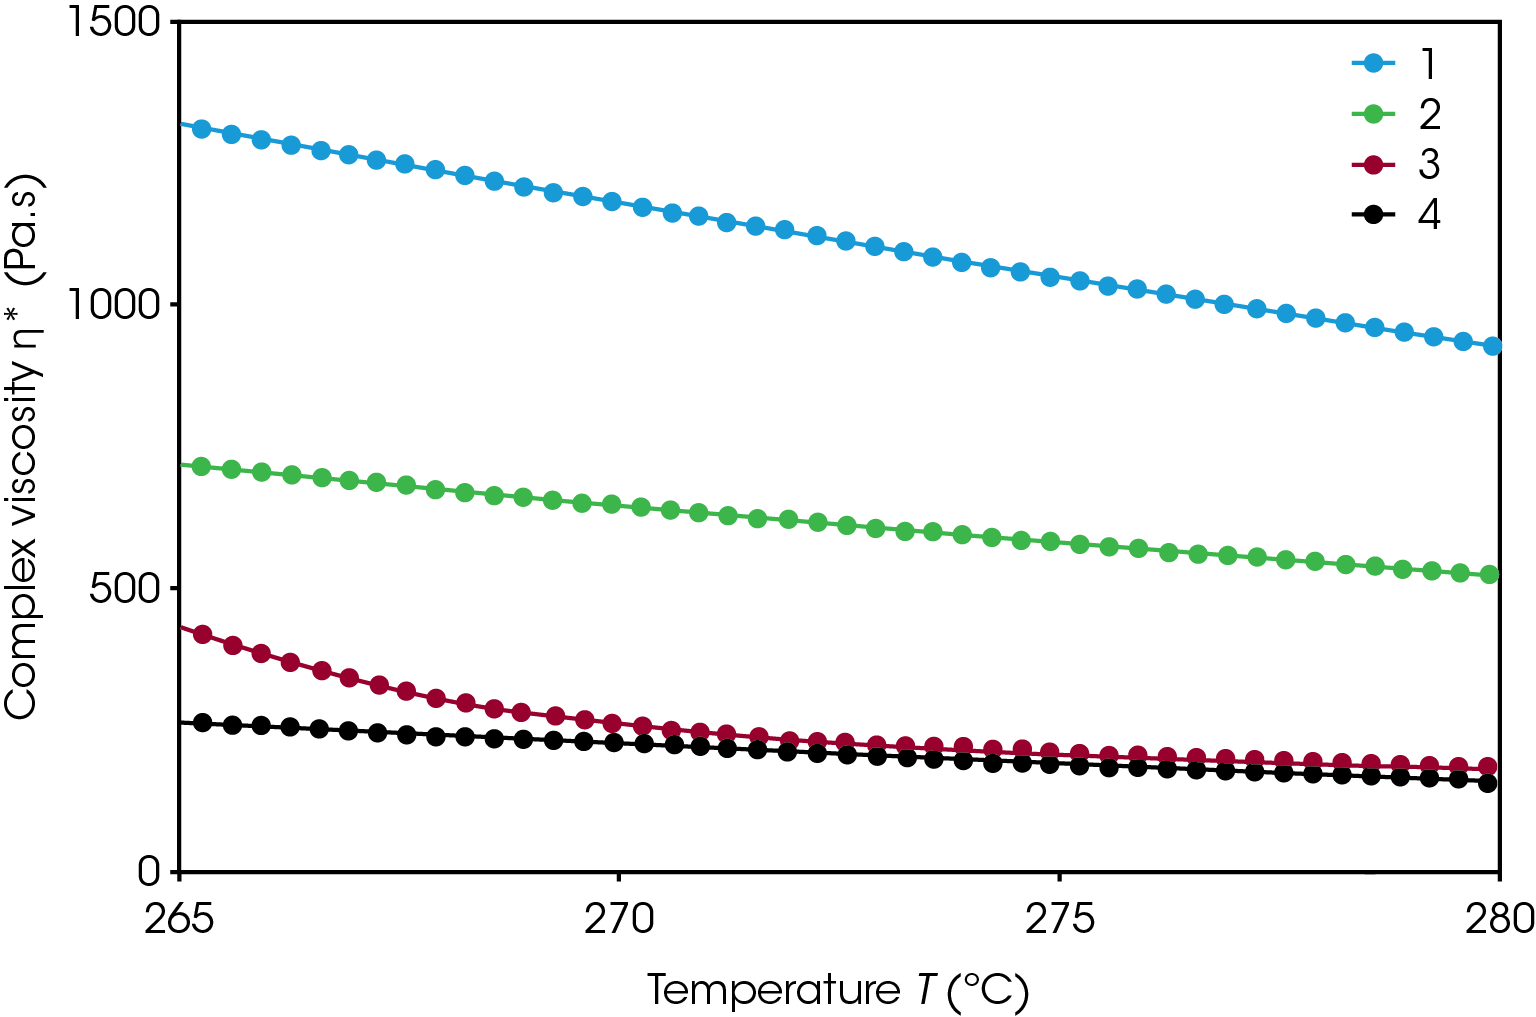
Based on the DSC results, a melt rheology temperature ramp experiment from 265 °C to 280 °C was conducted to monitor the viscosity change of the molten polymers versus temperature. Figure 6 shows the overlay temperature ramp test results of the four rPET resins, and the viscosities of these polymers at temperature between 265 °C and 280 °C are summarized in Table 1. After melt, the viscosity of rPET-1 remains high within the measurement temperature range, showing that this particular batch rPET may require a higher processing temperature of 280 °C. Because rPET-2, -3 and -4 have much lower molecular weight, their melt viscosities are low and do not have significant increase with decreasing measurement temperature. Therefore, these three rPET resins can be processed under lower temperatures.
| Viscosity @ Temperature | 265 ºC (Pa.s) | 270 ºC (Pa.s) | 275 ºC (Pa.s) | 280 ºC (Pa.s) |
|---|---|---|---|---|
| Sample 1 | 1318 | 1180 | 1050 | 983 |
| Sample 2 | 722 | 646 | 581 | 430 |
| Sample 3 | 436 | 266 | 206 | 176 |
| Sample 4 | 264 | 229 | 192 | 186 |
Table 1. The melt viscosity summary of four rPET resins at different temperatures
Conclusion
Recycled PET has been widely reused in different applications. However, as the raw feedstocks are collected from different sources, the polymer resins may have significantly reduced molecular weight, wider molecular weight distribution and with different crystallinity. The processing conditions, which commonly used for processing the original virgin resins may not be optimum for their recycled products. Thermal and rheological characterization techniques can help fingerprint the polymer molecular architecture, providing useful guidance to the optimization of processing conditions:
- A dynamic frequency sweep analysis can help fingerprinting the molecular architecture (MW, MWD) of the feedstock resins
- A time sweep test can monitor the polymer stability at their processing temperatures
- The DSC temperature scan and the rheology melt viscosity measurement at different temperatures help guide and optimize the processing temperature
References
1. Zoe O. G. Schyns, M. P. Shaver. “Mechanical Recycling of Packaging Plastics: A Review”. Macromolecular Rapid Communications. 2021, 42, 2000415. DOI: 10.1002/marc.202000415
2. T. Thiounn, R.C. Smith. “ Advances and approaches for chemical recycling of plastics waste”, J. of Polymer Science. 2020, 58, 1347. DOI: 10.1002/pol.20190261
3. R.Y. Geto, N.Mishra, A. Ramudhin, “The role of technological innovation in plastic production within a circular economy framework”. Resources, Conservation & Recylcing, 2020, 163, 105094
4. K. Ragaert, L. Delva, K.V. Geem, “Mechanical and chemical recycling of solid plastic waster”, Waste Management, 2017, 69, 24.
5. Els Verdonck, “Comparison of the thermal behavior of different types of recycled PET for advanced honeycomb structures”, TA Instruments applications note TA444. https://www.tainstruments.com/pdf/literature/TA444.pdf
Other Resources
Acknowledgement
This paper was written by Dr. Tianhong (Terri) Chen, Principal Application Scientist at TA Instruments | Waters. This research work was collaborated with Jarne Saelens (Project Engineer) from EconCore N.V. (Leuven, Belgium), who kindly provided all rPET samples and actively involved with technical discussions.
Click here to download the printable version of this application note.


